Service Robotics Market - Industry Overview 2026-2034 by Component, Environment, Application and, Region
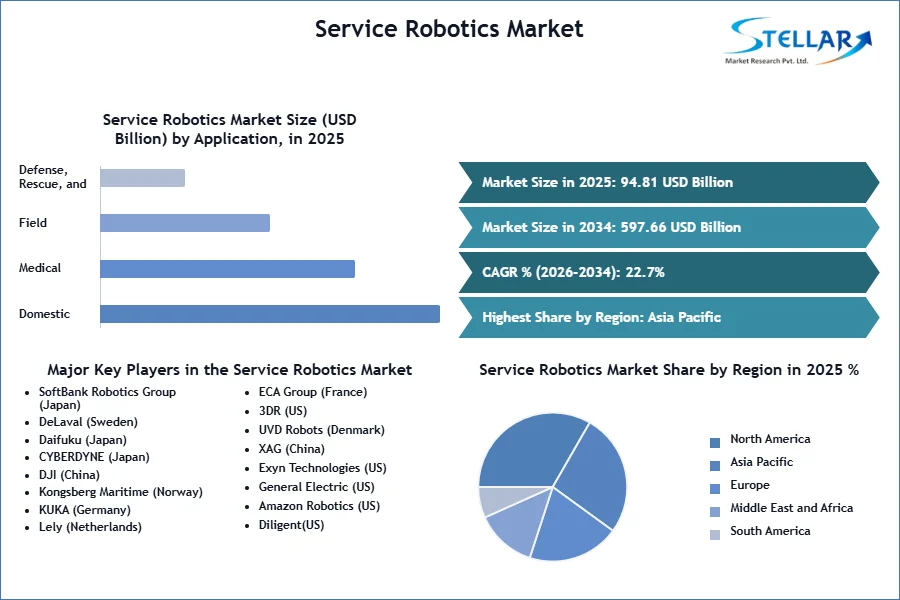
Service Robotics Market size was valued at USD 94.81 Billion in 2025 and the total Service Robotics revenue is expected to grow at 22.7% through 2026 to 2034, reaching nearly USD 597.66 Billion.
Service Robotics Market Overview:
Service robotics market in 2025 has a promising sales volume. Expert assessments from the International Federation of Robotics affirm a combined market share of 27.6 billion dollars. Furthermore, the majority of additional service robot businesses currently account for 29.5 percent of the total number of robotic enterprises registered in the United States.
The entire world of robots may be classified into traditional and advanced robotics as an aspect of robot classification and definitions. Traditional robotics is also split based on the unit's properties; hence, mobile robots and robot controllers may be distinguished, and traditional robotics also covers industrial robotics. Service robots, in this sense, are part of the advanced robotics sector. This wide description is accurate, yet it is very broad, since robotics is a huge field of study.
The market's growth drivers, as well as the market's segments (Component, Environment, Application and, Region), are analyzed in this research. Market participants, regions, and special requirements have all provided data. This market study provides an in-depth look at all of the important advancements that are currently taking place across all industry sectors. Statistics, infographics, and presentations are used to provide key data analysis. The analysis looks at the market's Drivers, Restraints, Opportunities, and Challenges for the Service Robotics market. The study aids in the evaluation of market growth drivers and the determination of how to employ these drivers as a tool. The research also aids in the correction and resolution of difficulties with the global Service Robotics market.
To get more Insights: Request Free Sample Report
Service Robotics Market Dynamics:
- The increased use of the Internet of Things in service robotics is a major driver of the service robotics market.
The Internet of Things (IoT) is a term that refers to the digital networking of different devices and systems to establish integrated operations. The technique of anticipating future difficulties before they occur is known as predictive maintenance. An IoT-based system may store petabytes and execute machine learning algorithms on multiple machines concurrently to detect possible risks and indicate when equipment is likely to break, aiding in preventive analytics. Input from a robot's many detectors, e.g. heat and pressure sensors, is gathered on the web and evaluated using machine learning algorithms. To uncover hidden relationships in databases and detect anomalous data patterns, machine learning methods are used.
- The data privacy regulations and policies are the primary restraint in the service robotics market.
Data proprietorship raises ethical concerns, particularly with the advent of robotic software applications. The information obtained by terrestrial robots may differ significantly from that collected by unmanned aerial vehicles. Consumers' data is provided on the web as the usage of domestic robots for home duties, learning, and leisure grows. Service providers, e.g. advertising and analytics organizations, frequently acquire this info, putting individuals' info at risk.
- Imprecision in critical operations is the main challenge in the service robotics market.
Robots are utilized in a variety of vital applications, including surgical treatments, bomb dispersal, security, and senior citizen support. Robots, on the other hand, cannot be designed to account for all scenarios. Robots, for example, may not be capable of delivering an appropriate answer in medical operations, because each human body poses a unique difficulty. While executing a key activity, robots might experience technological challenges such as infections in programs and a lack of Internet access. Catastrophe can also occur owing to malfunctioning circuits and batteries. It's difficult to enhance drone accuracy when it comes to preventing accidents with moving objects that change course often.
Service Robotics Market Segment Analysis:
By Component, the software segment is expected to grow at a CAGR of 7.9% in the aforementioned forecast period. Because the installation of service robots is projected to be more implementation-specific, the component growth rate in the service robotics market is expected to be greater for the software segment. An Automated Guided Vehicle programmed for hive movement on a production line, for example, might also be configured for grocery delivery. Authentic technology would be required for supply drone operations, taking into consideration elements e.g. weather. The majority of developments in vacuums cleaners have occurred in the programming, including capabilities such as continuous area mapping and distant control via voice assistant integration. As a result, the software segment is predicted to increase at a faster rate than the hardware segment throughout the forecast period.
By Environment, the Aerial segment of service robotics market is expected to grow at a high CAGR of 9.3% in the forecast period. This is due to the growing use of business drones for tasks such as inspecting farmland and traffic control, as well as corporate drones' increased retail price related to drone technology. Reduced costs of Unmanned Aerial Vehicle production and the development of solar panels as a source of power for UAVs can decrease the cost of propulsion technology and lead to a faster pace of growth.
Service Robotics Market Regional Insights:
Because of the widespread use of robotic systems in China, Japan, and India, APAC is predicted to have the greatest market share by the end of the forecast period. Provincial authorities play an important role in the growth of a local robotics market. India, for example, aims to invest in military robots and wants to launch sophisticated robotic troops by 2034.
The Chinese authorities have heavy investment plans for the automation sector in the country. The robotics business, together with artificial intelligence, has been identified by the administration as one of the key areas for great potential to accelerate the transition and transformation of the networking industry. This drive is likely to boost Chinese service robotics market share.
Furthermore, Asian financial firms are aiming to reduce prices to increase shareholder dividends, preserve profit margin, and have a new technique at their discretion that attracts clients, e.g. service robots.
The purpose of this research is to provide stakeholders in the industry with a thorough insight into the Service Robotics Market. The study includes an analysis of difficult data in simple language, as well as the industry's historical and current state, as well as anticipated market size and trends. The market report examines all segments of the industry, with a focus on significant players such as market leaders, followers, and new entrants. The report includes a PORTER, PESTEL analysis as well as the possible influence of microeconomic market determinants. External and internal elements that are expected to have a favorable or negative impact on the firm have been examined, providing decision-makers with a clear future vision of the industry. The research also aids in comprehending the Service Robotics Market dynamics and structure by studying market segments and forecasting market size. The research is an investor's guide since it depicts the competitive analysis of major competitors in the Service Robotics Market by product, price, financial situation, product portfolio, growth plans, and geographical presence.
Breakthroughs in the service robotics m
arket are discussed, as well as organic and inorganic growth plans. Various companies are focusing on organic growth strategies such as new product releases, product approvals, and other items such as patents and events. Inorganic growth strategies used in the industry included acquisitions, partnerships, and collaborations.
Service Robotics Market Scope:
|
Service Robotics Market |
|
|
Market Size in 2025 |
USD 94.81 Bn. |
|
Market Size in 2034 |
USD 597.66 Bn. |
|
CAGR (2026-2034) |
22.7% |
|
Historic Data |
2020-2025 |
|
Base Year |
2025 |
|
Forecast Period |
2026-2034 |
|
Segment Scope |
By Component
|
|
By Environment
|
|
|
|
By Application
|
|
Regional Scope |
North America- United States, Canada, and Mexico Europe – UK, France, Germany, Italy, Spain, Sweden, Austria, and Rest of Europe Asia Pacific – China, India, Japan, South Korea, Australia, ASEAN, Rest of APAC Middle East and Africa - South Africa, GCC, Egypt, Nigeria, Rest of the Middle East and Africa South America – Brazil, Argentina, Rest of South America |
Service Robotics Market Players:
- SoftBank Robotics Group (Japan)
- DeLaval (Sweden)
- Daifuku (Japan)
- CYBERDYNE (Japan)
- DJI (China)
- Kongsberg Maritime (Norway)
- KUKA (Germany)
- Lely (Netherlands)
- ECA Group (France)
- 3DR (US)
- UVD Robots (Denmark)
- XAG (China)
- Exyn Technologies (US)
- General Electric (US)
- Amazon Robotics (US)
- Diligent(US)
Frequently Asked Questions
The data privacy regulations and policies are the primary restraint in the service robotics market.
The key players are XAG, 3DR, etc.
the software segment is expected to grow at a CAGR of 7.9% in the aforementioned forecast period.
- Chapter 1 Scope of the Report
Chapter 2 Research Methodology
2.1.Research Process
2.2.Global Service Robotics Market: Target Audience
2.3.Global Service Robotics Market: Primary Research (As per Client Requirement)
2.4.Global Service Robotics Market: Secondary Research
Chapter 3 Executive Summary
Chapter 4 Competitive Landscape
4.1.Market Share Analysis, By Value, 2026-2034
4.1.1.Market Share Analysis, By Region, By Value, 2026-2034 (In %)
4.1.1.1.North America Market Share Analysis, By Value, 2026-2034 (In %)
4.1.1.2.Europe Market Share Analysis, By Value, 2026-2034 (In %)
4.1.1.3.Asia Pacific Market Share Analysis, By Value, 2026-2034 (In %)
4.1.1.4.South America Market Share Analysis, By Value, 2026-2034 (In %)
4.1.1.5.Middle East and Africa Market Share Analysis, By Value, 2026-2034 (In %)
4.1.2.Market Share Analysis, By Component, By Value, 2026-2034 (In %)
4.1.2.1.North America Market Share Analysis, By Component, By Value, 2026-2034 (In %)
4.1.2.1.1.USA Market Share Analysis, By Component, By Value, 2026-2034 (In %)
4.1.2.1.2.Canada Market Share Analysis, By Component, By Value, 2026-2034 (In %)
4.1.2.1.3.Mexico Market Share Analysis, By Component, By Value, 2026-2034 (In %)
4.1.2.2.Europe Market Share Analysis, By Component, By Value, 2026-2034 (In %)
4.1.2.2.1.UK Market Share Analysis, By Component, By Value, 2026-2034 (In %)
4.1.2.2.2.France Market Share Analysis, By Component, By Value, 2026-2034 (In %)
4.1.2.2.3.Germany Market Share Analysis, By Component, By Value, 2026-2034 (In %)
4.1.2.2.4.Italy Market Share Analysis, By Component, By Value, 2026-2034 (In %)
4.1.2.2.5.Spain Market Share Analysis, By Component, By Value, 2026-2034 (In %)
4.1.2.2.6.Sweden Market Share Analysis, By Component, By Value, 2026-2034 (In %)
4.1.2.2.7.Austria Market Share Analysis, By Component, By Value, 2026-2034 (In %)
4.1.2.2.8.Rest of Europe Market Share Analysis, By Component, By Value, 2026-2034 (In %)
4.1.2.3.Asia Pacific Market Share Analysis, By Component, By Value, 2026-2034 (In %)
4.1.2.3.1.China Market Share Analysis, By Component, By Value, 2026-2034 (In %)
4.1.2.3.2.India Market Share Analysis, By Component, By Value, 2026-2034 (In %)
4.1.2.3.3.Japan Market Share Analysis, By Component, By Value, 2026-2034 (In %)
4.1.2.3.4.South Korea Market Share Analysis, By Component, By Value, 2026-2034 (In %)
4.1.2.3.5.Australia Market Share Analysis, By Component, By Value, 2026-2034 (In %)
4.1.2.3.6.ASEAN Market Share Analysis, By Component, By Value, 2026-2034 (In %)
4.1.2.3.7.Rest of APAC Market Share Analysis, By Component, By Value, 2026-2034 (In %)
4.1.2.4.South America Market Share Analysis, By Component, By Value, 2026-2034 (In %)
4.1.2.4.1.Brazil Market Share Analysis, By Component, By Value, 2026-2034 (In %)
4.1.2.4.2.Argentina Market Share Analysis, By Component, By Value, 2026-2034 (In %)
4.1.2.4.3.Rest of South America Market Share Analysis, By Component, By Value, 2026-2034 (In %)
4.1.2.5.Middle East and Africa Market Share Analysis, By Component, By Value, 2026-2034 (In %)
4.1.2.5.1.South Africa Market Share Analysis, By Component, By Value, 2026-2034 (In %)
4.1.2.5.2.GCC Market Share Analysis, By Component, By Value, 2026-2034 (In %)
4.1.2.5.3.Egypt Market Share Analysis, By Component, By Value, 2026-2034 (In %)
4.1.2.5.4.Nigeria Market Share Analysis, By Component, By Value, 2026-2034 (In %)
4.1.2.5.5.Rest of Middle East and Africa Market Share Analysis, By Component, By Value, 2026-2034 (In %)
4.1.3.Market Share Analysis, By Environment, By Value, 2026-2034 (In %)
4.1.3.1.North America Market Share Analysis, By Environment, By Value, 2026-2034 (In %)
4.1.3.1.1.USA Market Share Analysis, By Environment, By Value, 2026-2034 (In %)
4.1.3.1.2.Canada Market Share Analysis, By Environment, By Value, 2026-2034 (In %)
4.1.3.1.3.Mexico Market Share Analysis, By Environment, By Value, 2026-2034 (In %)
4.1.3.2.Europe Market Share Analysis, By Environment, By Value, 2026-2034 (In %)
4.1.3.2.1.UK Market Share Analysis, By Environment, By Value, 2026-2034 (In %)
4.1.3.2.2.France Market Share Analysis, By Environment, By Value, 2026-2034 (In %)
4.1.3.2.3.Germany Market Share Analysis, By Environment, By Value, 2026-2034 (In %)
4.1.3.2.4.Italy Market Share Analysis, By Environment, By Value, 2026-2034 (In %)
4.1.3.2.5.Spain Market Share Analysis, By Environment, By Value, 2026-2034 (In %)
4.1.3.2.6.Sweden Market Share Analysis, By Environment, By Value, 2026-2034 (In %)
4.1.3.2.7.Austria Market Share Analysis, By Environment, By Value, 2026-2034 (In %)
4.1.3.2.8.Rest of Europe Market Share Analysis, By Environment, By Value, 2026-2034 (In %)
4.1.3.3.Asia Pacific Market Share Analysis, By Environment, By Value, 2026-2034 (In %)
4.1.3.3.1.China Market Share Analysis, By Environment, By Value, 2026-2034 (In %)
4.1.3.3.2.India Market Share Analysis, By Environment, By Value, 2026-2034 (In %)
4.1.3.3.3.Japan Market Share Analysis, By Environment, By Value, 2026-2034 (In %)
4.1.3.3.4.South Korea Market Share Analysis, By Environment, By Value, 2026-2034 (In %)
4.1.3.3.5.Australia Market Share Analysis, By Environment, By Value, 2026-2034 (In %)
4.1.3.3.6.ASEAN Market Share Analysis, By Environment, By Value, 2026-2034 (In %)
4.1.3.3.7.Rest of APAC Market Share Analysis, By Environment, By Value, 2026-2034 (In %)
4.1.3.4.South America Market Share Analysis, By Environment, By Value, 2026-2034 (In %)
4.1.3.4.1.Brazil Market Share Analysis, By Environment, By Value, 2026-2034 (In %)
4.1.3.4.2.Argentina Market Share Analysis, By Environment, By Value, 2026-2034 (In %)
4.1.3.4.3.Rest of South America Market Share Analysis, By Environment, By Value, 2026-2034 (In %)
4.1.3.5 Middle East and Africa Market Share Analysis, By Environment, By Value, 2026-2034 (In %)
4.1.3.5.1.South Africa Market Share Analysis, By Environment, By Value, 2026-2034 (In %)
4.1.3.5.2.GCC Market Share Analysis, By Environment, By Value, 2026-2034 (In %)
4.1.3.5.3.Egypt Market Share Analysis, By Environment, By Value, 2026-2034 (In %)
4.1.3.5.4.Nigeria Market Share Analysis, By Environment, By Value, 2026-2034 (In %)
4.1.3.5.5.Rest of Middle East and Africa Market Share Analysis, By Environment, By Value, 2026-2034 (In %)
4.1.4.Market Share Analysis, By Application, By Value, 2026-2034 (In %)
4.1.4.1.North America Market Share Analysis, By Application, By Value, 2026-2034 (In %)
4.1.4.1.1.USA Market Share Analysis, By Application, By Value, 2026-2034 (In %)
4.1.4.1.2.Canada Market Share Analysis, By Application, By Value, 2026-2034 (In %)
4.1.4.1.3.Mexico Market Share Analysis, By Application, By Value, 2026-2034 (In %)
4.1.4.2.Europe Market Share Analysis, By Application, By Value, 2026-2034 (In %)
4.1.4.2.1.UK Market Share Analysis, By Application, By Value, 2026-2034 (In %)
4.1.4.2.2.France Market Share Analysis, By Application, By Value, 2026-2034 (In %)
4.1.4.2.3.Germany Market Share Analysis, By Application, By Value, 2026-2034 (In %)
4.1.4.2.4.Italy Market Share Analysis, By Application, By Value, 2026-2034 (In %)
4.1.4.2.5.Spain Market Share Analysis, By Application, By Value, 2026-2034 (In %)
4.1.4.2.6.Sweden Market Share Analysis, By Application, By Value, 2026-2034 (In %)
4.1.4.2.7.Austria Market Share Analysis, By Application, By Value, 2026-2034 (In %)
4.1.4.2.8.Rest of Europe Market Share Analysis, By Application, By Value, 2026-2034 (In %)
4.1.4.3. Asia Pacific Market Share Analysis, By Application, By Value, 2026-2034 (In %)
4.1.4.3.1.China Market Share Analysis, By Application, By Value, 2026-2034 (In %)
4.1.4.3.2.India Market Share Analysis, By Application, By Value, 2026-2034 (In %)
4.1.4.3.3.Japan Market Share Analysis, By Application, By Value, 2026-2034 (In %)
4.1.4.3.4.South Korea Market Share Analysis, By Application, By Value, 2026-2034 (In %)
4.1.4.3.5.Australia Market Share Analysis, By Application, By Value, 2026-2034 (In %)
4.1.4.3.6.ASEAN Market Share Analysis, By Application, By Value, 2026-2034 (In %)
4.1.4.3.7.Rest of APAC Market Share Analysis, By Application, By Value, 2026-2034 (In %)
4.1.4.4. South America Market Share Analysis, By Application, By Value, 2026-2034 (In %)
4.1.4.4.1.Brazil Market Share Analysis, By Application, By Value, 2026-2034 (In %)
4.1.4.4.2.Argentina Market Share Analysis, By Application, By Value, 2026-2034 (In %)
4.1.4.4.3.Rest of South America Market Share Analysis, By Application, By Value, 2026-2034 (In %)
4.1.4.5.Middle East and Africa Market Share Analysis, By Application, By Value, 2026-2034 (In %)
4.1.4.5.1.South Africa Market Share Analysis, By Application, By Value, 2026-2034 (In %)
4.1.4.5.2.GCC Market Share Analysis, By Application, By Value, 2026-2034 (In %)
4.1.4.5.3.Egypt Market Share Analysis, By Application, By Value, 2026-2034 (In %)
4.1.4.5.4.Nigeria Market Share Analysis, By Application, By Value, 2026-2034 (In %)
4.1.4.5.5.Rest of Middle East and Africa Market Share Analysis, By Application, By Value, 2026-2034 (In %)
4.2.Stellar Competition matrix
4.2.1.Global Stellar Competition Matrix
4.2.2.North America Stellar Competition Matrix
4.2.3.Europe Stellar Competition Matrix
4.2.4.Asia Pacific Stellar Competition Matrix
4.2.5.South America Stellar Competition Matrix
4.2.6.Middle East and Africa Stellar Competition Matrix
4.3. Key Players Benchmarking
4.3.1.Key Players Benchmarking By Component, Pricing, Market Share, Investments, Expansion Plans, Physical Presence and Presence in the Market.
4.4. Mergers and Acquisitions in Industry
4.4.1.M&A by Region, Value and Strategic Intent
4.5.Market Dynamics
4.5.1.Market Drivers
4.5.2.Market Restraints
4.5.3.Market Opportunities
4.5.4.Market Challenges
4.5.5.PESTLE Analysis
4.5.6.PORTERS Five Force Analysis
4.5.7.Value Chain Analysis
Chapter 5 Global Service Robotics Market Segmentation: By Component
5.1.Global Service Robotics Market, By Component, Overview/Analysis, 2026-2034
5.2.Global Service Robotics Market, By Component, By Value, Market Share (%), 2026-2034 (USD Billion)
5.3.Global Service Robotics Market, By Component, By Value, -
5.3.1.Hardware
5.3.2.Software
Chapter 6 Global Service Robotics Market Segmentation: By Environment
6.1.Global Service Robotics Market, By Environment, Overview/Analysis, 2026-2034
6.2.Global Service Robotics Market Size, By Environment, By Value, Market Share (%), 2026-2034 (USD Billion)
6.3.Global Service Robotics Market, By Environment, By Value, -
6.3.1.Aerial
6.3.2.Ground
6.3.3.Marine
Chapter 7 Global Service Robotics Market Segmentation: By Application
7.1.Global Service Robotics Market, By Application, Overview/Analysis, 2026-2034
7.2.Global Service Robotics Market Size, By Application, By Value, Market Share (%), 2026-2034 (USD Billion)
7.3.Global Service Robotics Market, By Application, By Value, - 2026-2034 (USD Billion)
7.3.1.Domestic
7.3.2.Medical
7.3.3.Field
7.3.4.Defense, Rescue, and Security
7.3.5.Entertainment, Education, and Personal
7.3.6.Public Relation
7.3.7.Inspection and Maintenance
7.3.8.Logistics
7.3.9.Construction and Demolition
7.3.10.Marine
7.3.11.Research and Space Exploration
Chapter 8 Global Service Robotics Market Segmentation: By Region
8.1. Global Service Robotics Market, By Region – North America
8.1.1.North America Service Robotics Market Size, By Component, By Value, 2026-2034 (USD Billion)
8.1.2.North America Service Robotics Market Size, By Environment, By Value, 2026-2034 (USD Billion)
8.1.3.North America Service Robotics Market Size, By Application, By Value, 2026-2034 (USD Billion)
8.1.4.By Country – U.S.
8.1.4.1.U.S. Service Robotics Market Size, By Component, By Value, 2026-2034 (USD Billion)
8.1.4.2.U.S. Service Robotics Market Size, By Environment, By Value, 2026-2034 (USD Billion)
8.1.4.3.U.S. Service Robotics Market Size, By Application, By Value, 2026-2034 (USD Billion)
8.1.4.4.Canada Service Robotics Market Size, By Value, 2026-2034 (USD Billion)
8.1.4.5.Mexico Service Robotics Market Size, By Value, 2026-2034 (USD Billion)
8.2. Europe Service Robotics Market Size, By Value, 2026-2034 (USD Billion)
8.2.1.UK
8.2.2.France
8.2.3.Germany
8.2.4.Italy
8.2.5.Spain
8.2.6.Sweden
8.2.7.Austria
8.2.8.Rest of Europe
8.3.Asia Pacific Service Robotics Market Size, By Value, 2026-2034 (USD Billion)
8.3.1.China
8.3.2.India
8.3.3.Japan
8.3.4.South Korea
8.3.5.Australia
8.3.6.ASEAN
8.3.7.Rest of APAC
8.4.Middle East and Africa Service Robotics Market Size, By Value, 2026-2034 (USD Billion)
8.4.1.South Africa
8.4.2.GCC
8.4.3.Egypt
8.4.4.Nigeria
8.4.5.Rest of Middle East and Africa
8.5.South America Service Robotics Market Size, By Value, 2026-2034 (USD Billion)
8.5.1.Brazil
8.5.2.Argentina
8.5.3.Rest of South America
Chapter 9 Company Profiles
9.1.Key Players
9.1.1.SoftBank Robotics Group (Japan)
9.1.1.1.Company Overview
9.1.1.2.Tube Portfolio
9.1.1.3.Financial Overview
9.1.1.4.Business Strategy
9.1.1.5.Key Developments
9.1.2.DeLaval (Sweden)
9.1.3.Daifuku (Japan)
9.1.4.CYBERDYNE (Japan)
9.1.5.DJI (China)
9.1.6.Kongsberg Maritime (Norway)
9.1.7.KUKA (Germany)
9.1.8.Lely (Netherlands)
9.1.9.ECA Group (France)
9.1.10.3DR (US)
9.1.11.UVD Robots (Denmark)
9.1.12.XAG (China)
9.1.13.Exyn Technologies (US)
9.1.14.General Electric (US)
9.1.15.Amazon Robotics (US)
9.1.16.Diligent(US)
9.2.Key Findings
9.3.Recommendations