AI in Computer Vision Market Industry Overview (2026-2032) by Offering, ML Model, Application, Industry and, Region
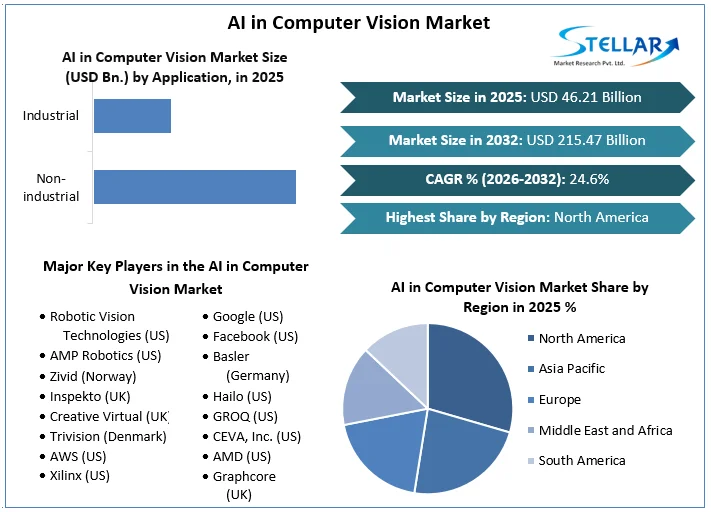
AI in Computer Vision Market size was valued at US$ 46.21 Billion in 2025 and the total AI in Computer Vision revenue is expected to grow at 24.6% through 2026 to 2032, reaching nearly US$ 215.47 Billion.
AI in Computer Vision Market Overview:
Computer vision is an artificial intelligence discipline that teaches computers to analyze and comprehend images. Systems can properly recognize and categorize entities incorporating digital pictures from cameras and webcams, as well as deep neural network models, and then respond to what they detect.
In the healthcare system, computer vision is frequently utilized. The examination of visuals, radiographs, and photos is crucial in medical diagnosis. Computer vision solutions offer to not only expedite but also to avoid mistaken diagnostics and lower medical costs by analyzing ultrasound pictures, MRIs, and CT scans, which are all part of contemporary modern medical regular repertoire. Computer vision isn't meant to take the role of medical experts; rather, it's meant to make their jobs easier and to help them make better judgments.
The market's growth drivers, as well as the market's segments (Offering, ML Model, Application, Industry and, Region), are analyzed in this research. Market participants, regions, and special requirements have all provided data. This market study provides an in-depth look at all of the important advancements that are currently taking place across all industry sectors. Statistics, infographics, and presentations are used to provide key data analysis. The analysis looks at the market's Drivers, Restraints, Opportunities, and Challenges for AI in computer vision market. The study aids in the evaluation of market growth drivers and the determination of how to employ these drivers as a tool. The research also aids in the correction and resolution of difficulties with the global AI in computer vision market.
To get more Insights: Request Free Sample Report
AI in Computer Vision Market Dynamics:
The need for standard inspection and automation is the primary driver of the AI in computer vision market. Industrial businesses all around the world are aiming to boost their automation investments in the post-COVID-19 timeframe since it minimizes the necessity for human involvement in different processes. Furthermore, as industry participants have grasped the relevance of automated quality control in production processes, the demand for it has grown. As a result, Intelligence-based computer vision systems are now widely accepted as an important aspect of long-term automated processes. The application of computer vision in automated manufacturing operations aids in the rapid identification of issues, lowering costs, and improving reaction times.
The growing safety concerns regarding image processing analytics are a major restraint for AI in computer vision Market. In areas e.g. consumer devices and surveillance systems, AI in computer vision products is predicted to have tremendous development potential. However, difficulties linked to the cloud storage system, such as data leaks, information theft, and cloud data unreliability, are becoming more common by the day. As a result, cloud service providers must supply consumers with dependable data services. Despite the potential benefits, cloud consumers are hesitant to save private data such as personal health information, messages, and susceptible files in cloud computing platforms. Customers forfeit full control over their collected data once it is stored in a cloud data center.
Consumer electronics, which includes items such as cellphones and smart homes, has evolved from a luxury to a need. This category, which includes monitors, computers, workstations, and other devices, was harmed when output fell owing to interruptions in the globalized economy during the coronavirus outbreak, particularly in China, which is the industry's key hub. However, there is an increase in the usage of AI-based smartphones and other devices among customers, which is driving the growth of AI in computer vision market.
AI in Computer Vision Market Segment Analysis:
By Industry, the consumer electronics segment is expected to witness a CAGR of 10.3% in the aforementioned forecast period.
AI in computer vision market is booming due to rising consumption for AI-based computer vision applications in consumer devices e.g. smartphones, PCs, and laptops. Universal health care, on the other hand, is expected to witness the fastest growth throughout the projection period, as AI-based computer vision devices are becoming increasingly important in products e.g. radiology and diagnostic imaging.
Besides that, the growing involvement of major automobile and IT behemoths in the development of self-driving automobiles is driving AI's advancement in the computer vision business for the automotive sector.
In the field of security and monitoring, the usage of AI-based computer vision applications to assess the risks and individuals is escalating, driving the acceptance of AI-based computer vision products in this domain. Furthermore, improvements in machine learning technologies, e.g. intelligent cameras and digitalization, have expanded the scope of artificial intelligence in the physical security industry.
AI in Computer Vision Market Regional Insights:
Over the forecast period, North America AI in computer vision market is expected to witness a CAGR of 6.5%. This increase can be attributed to favorable government measures aimed at promoting the use of computer vision in the province. The revolution has taken AI and computer vision to public health departments for practical testing and implementation. The United States General Services Administration's domain Artificial Intelligence Center of Excellence also assists entities and organizations across the country in developing AI applications by embracing NLP, deep learning, machine vision, robotic process automation, and smart process development.
The purpose of this research is to provide stakeholders in the industry with a thorough insight into AI in Computer Vision Market. The study includes an analysis of difficult data in simple language, as well as the industry's historical and current state, as well as anticipated market size and trends. The market report examines all segments of the industry, with a focus on significant players such as market leaders, followers, and new entrants. The report includes a PORTER, PESTEL analysis as well as the possible influence of microeconomic market determinants. External and internal elements that are expected to have a favorable or negative impact on the firm have been examined, providing decision-makers with a clear future vision of the industry. The research also aids in comprehending the AI in Computer Vision Market dynamics and structure by studying market segments and forecasting market size. The research is an investor's guide since it depicts the competitive analysis of major competitors in the market by product, price, financial situation, product portfolio, growth plans, and geographical presence.
Breakthroughs in the AI in the Computer Vision industry are discussed, as well as organic and inorganic growth plans. Various companies are focusing on organic growth strategies such as new product releases, product approvals, and other items such as patents and events. Inorganic growth strategies used in the industry included acquisitions, partnerships, and collaborations.
AI in Computer Vision Market Scope:
|
AI in Computer Vision Market |
|
|
Market Size in 2025 |
USD 46.21 Billion |
|
Market Size in 2032 |
USD 215.47 Billion |
|
CAGR (2026-2032) |
24.6% |
|
Historic Data |
2020-2025 |
|
Base Year |
2025 |
|
Forecast Period |
2026-2032 |
|
Segment Scope |
by Offering
|
|
by ML Model
|
|
|
by Application
|
|
|
by Industry
|
|
|
Regional Scope |
North America- United States, Canada, and Mexico Europe – UK, France, Germany, Italy, Spain, Sweden, Austria, and Rest of Europe Asia Pacific – China, India, Japan, South Korea, Australia, ASEAN, Rest of APAC Middle East and Africa - South Africa, GCC, Egypt, Nigeria, Rest of the Middle East and Africa South America – Brazil, Argentina, Rest of South America |
AI in Computer Vision Market Players:
- Robotic Vision Technologies (US)
- AMP Robotics (US)
- Zivid (Norway)
- Inspekto (UK)
- Creative Virtual (UK)
- Trivision (Denmark)
- AWS (US)
- Xilinx (US)
- Google (US)
- Facebook (US)
- Basler (Germany)
- Hailo (US)
- GROQ (US)
- CEVA, Inc. (US)
- AMD (US)
- Graphcore (UK)
Frequently Asked Questions
The growing safety concerns regarding image processing analytics are a major restraint in the market.
The key players are Facebook, Google etc.
The consumer electronics segment is expected to witness a CAGR of 10.3% in the aforementioned forecast period.
1. AI in Computer Vision Market: Research Methodology
1.1. Research Data
1.1.1. Primary Data
1.1.2. Secondary Data
1.2. Market Size Estimation
1.2.1. Bottom-Up Approach
1.2.2. Top-Down Approach
1.3. Market breakdown and Data Triangulation
1.4. Assumptions
2. AI in Computer Vision Market: Executive Summary
2.1. Market Overview
2.2. Market Size (2025) and Forecast (2026– 2032) and Y-O-Y%
2.3. Market Size (USD) and Market Share (%) – By Segments and Regions
3. AI in Computer Vision Market: Competitive Landscape
3.1. Stellar Competition Matrix
3.2. Key Players Benchmarking
3.2.1. Company Name
3.2.2. Headquarter
3.2.3. Business Segment
3.2.5. End-user Segment
3.2.6. Y-O-Y%
3.2.7. Revenue (2025)
3.2.8. Profit Margin
3.2.9. Market Share
3.2.10. Company Locations
3.3. Market Structure
3.3.1. Market Leaders
3.3.2. Market Followers
3.3.3. Emerging Players
3.4. Consolidation of the Market
3.4.1. Strategic Initiatives and Developments
3.4.2. Mergers and Acquisitions
3.4.3. Collaborations and Partnerships
3.4.4. Product Launches and Innovations
4. AI in Computer Vision Market: Dynamics
4.1. Market Trends by Region
4.1.1. North America
4.1.2. Europe
4.1.3. Asia Pacific
4.1.4. Middle East and Africa
4.1.5. South America
4.2. Market Drivers
4.3. Market Restraints
4.4. Market Opportunities
4.5. Market Challenges
4.6. PORTER’s Five Forces Analysis
4.6.1. Intensity of the Rivalry
4.6.2. Threat of New Entrants
4.6.3. Bargaining Power of Suppliers
4.6.4. Bargaining Power of Buyers
4.6.5. Threat of Substitutes
4.7. PESTLE Analysis
4.7.1. Political Factors
4.7.2. Economic Factors
4.7.3. Social Factors
4.7.4. Legal Factors
4.7.5. Environmental Factors
4.8. Technological Roadmap
4.9. Regulatory Landscape by Region
4.9.1.1. North America
4.9.1.2. Europe
4.9.1.3. Asia Pacific
4.9.1.4. Middle East and Africa
4.9.1.5. South America
5. AI in Computer Vision Market Size and Forecast by Segments (by Value USD Million)
5.1. AI in Computer Vision Market Size and Forecast, By Offering (2025-2032)
5.1.1. Hardware
5.1.2. Software
5.2. AI in Computer Vision Market Size and Forecast, By ML Model (2025-2032)
5.2.1. Supervised Learning
5.2.2. Unsupervised Learning
5.2.3. Reinforcement Learning
5.3. AI in Computer Vision Market Size and Forecast, By Application (2025-2032)
5.3.1. Non-Industrial
5.3.2. Industrial
5.4. AI in Computer Vision Market Size and Forecast, By Industry (2025-2032)
5.4.1. Automotive
5.4.2. Consumer Electronics
5.4.3. Healthcare
5.4.4. Retail
5.4.5. Security & Surveillance
5.4.6. Manufacturing
5.4.7. Agriculture
5.4.8. Transportation & Logistics
5.4.9. Other
5.5. AI in Computer Vision Market Size and Forecast, by Region (2025-2032)
5.5.1. North America
5.5.2. Europe
5.5.3. Asia Pacific
5.5.4. Middle East and Africa
5.5.5. South America
6. North America AI in Computer Vision Market Size and Forecast (by Value USD Million)
6.1. North America AI in Computer Vision Market Size and Forecast, By Offering (2025-2032)
6.1.1. Hardware
6.1.2. Software
6.2. North America AI in Computer Vision Market Size and Forecast, By ML Model (2025-2032)
6.2.1. Supervised Learning
6.2.2. Unsupervised Learning
6.2.3. Reinforcement Learning
6.3. North America AI in Computer Vision Market Size and Forecast, By Application (2025-2032)
6.3.1. Non-Industrial
6.3.2. Industrial
6.4. North America AI in Computer Vision Market Size and Forecast, By Industry (2025-2032)
6.4.1. Automotive
6.4.2. Consumer Electronics
6.4.3. Healthcare
6.4.4. Retail
6.4.5. Security & Surveillance
6.4.6. Manufacturing
6.4.7. Agriculture
6.4.8. Transportation & Logistics
6.4.9. Other
6.5. North America AI in Computer Vision Market Size and Forecast, by Country (2025-2032)
6.5.1. United States
6.5.2. Canada
6.5.3. Mexico
7. Europe AI in Computer Vision Market Size and Forecast (by Value USD Million)
7.1. Europe AI in Computer Vision Market Size and Forecast, By Offering (2025-2032)
7.2. Europe AI in Computer Vision Market Size and Forecast, By ML Model (2025-2032)
7.3. Europe AI in Computer Vision Market Size and Forecast, By Application (2025-2032)
7.4. Europe AI in Computer Vision Market Size and Forecast, By Industry (2025-2032)
7.5. Europe AI in Computer Vision Market Size and Forecast, by Country (2025-2032)
7.5.1. UK
7.5.2. France
7.5.3. Germany
7.5.4. Italy
7.5.5. Spain
7.5.6. Sweden
7.5.7. Austria
7.5.8. Rest of Europe
8. Asia Pacific AI in Computer Vision Market Size and Forecast (by Value USD Million)
8.1. Asia Pacific AI in Computer Vision Market Size and Forecast, By Offering (2025-2032)
8.2. Asia Pacific AI in Computer Vision Market Size and Forecast, By ML Model (2025-2032)
8.3. Asia Pacific AI in Computer Vision Market Size and Forecast, By Application (2025-2032)
8.4. Asia Pacific AI in Computer Vision Market Size and Forecast, By Industry (2025-2032)
8.5. Asia Pacific AI in Computer Vision Market Size and Forecast, by Country (2025-2032)
8.5.1. China
8.5.2. S Korea
8.5.3. Japan
8.5.4. India
8.5.5. Australia
8.5.6. Indonesia
8.5.7. Malaysia
8.5.8. Vietnam
8.5.9. Taiwan
8.5.10. Bangladesh
8.5.11. Pakistan
8.5.12. Rest of Asia Pacific
9. Middle East and Africa AI in Computer Vision Market Size and Forecast (by Value USD Million)
9.1. Middle East and Africa AI in Computer Vision Market Size and Forecast, By Offering (2025-2032)
9.2. Middle East and Africa AI in Computer Vision Market Size and Forecast, By ML Model (2025-2032)
9.3. Middle East and Africa AI in Computer Vision Market Size and Forecast, By Application (2025-2032)
9.4. Middle East and Africa AI in Computer Vision Market Size and Forecast, By Industry (2025-2032)
9.5. Middle East and Africa AI in Computer Vision Market Size and Forecast, by Country (2025-2032)
9.5.1. South Africa
9.5.2. GCC
9.5.3. Egypt
9.5.4. Nigeria
9.5.5. Rest of ME&A
10. South America AI in Computer Vision Market Size and Forecast (by Value USD Million)
10.1. South America AI in Computer Vision Market Size and Forecast, By Offering (2025-2032)
10.2. South America AI in Computer Vision Market Size and Forecast, By ML Model (2025-2032)
10.3. South America AI in Computer Vision Market Size and Forecast, By Application (2025-2032)
10.4. South America AI in Computer Vision Market Size and Forecast, By Industry (2025-2032)
10.5. South America AI in Computer Vision Market Size and Forecast, by Country (2025-2032)
10.5.1. Brazil
10.5.2. Argentina
10.5.3. Rest of South America
11. Company Profile: Key players
11.1. Robotics Vision Technologies
11.1.1. Company Overview
11.1.2. Business Portfolio
11.1.2.1. Service Name
11.1.2.2. Service Details
11.1.3. Financial Overview
11.1.3.1. Total Revenue
11.1.3.2. Segment Revenue
11.1.3.3. Regional Revenue
11.1.4. SWOT Analysis
11.1.5. Strategic Analysis
11.1.6. Recent Developments
11.2. AMP Robotics
11.3. Zivid
11.4. Inspekto
11.5. Creative Virtual
11.6. AWS
11.7. Trivision
11.8. Xilinx
11.9. Facebook
11.10. Basler
11.11. Hailo
11.12. AMD
11.13. GROQ
11.14. Graphcore
11.15. CEVA, Inc.
12. Key Findings
13. Industry Recommendations
13.1. Strategic Recommendations
13.2. Future Outlook