Industrial Automation Services Market - Global Industry Analysis and Forecast 2026-2034 Trends, Statistics, Dynamics, Segmentation by Type of Service, Product Type, End User and Region
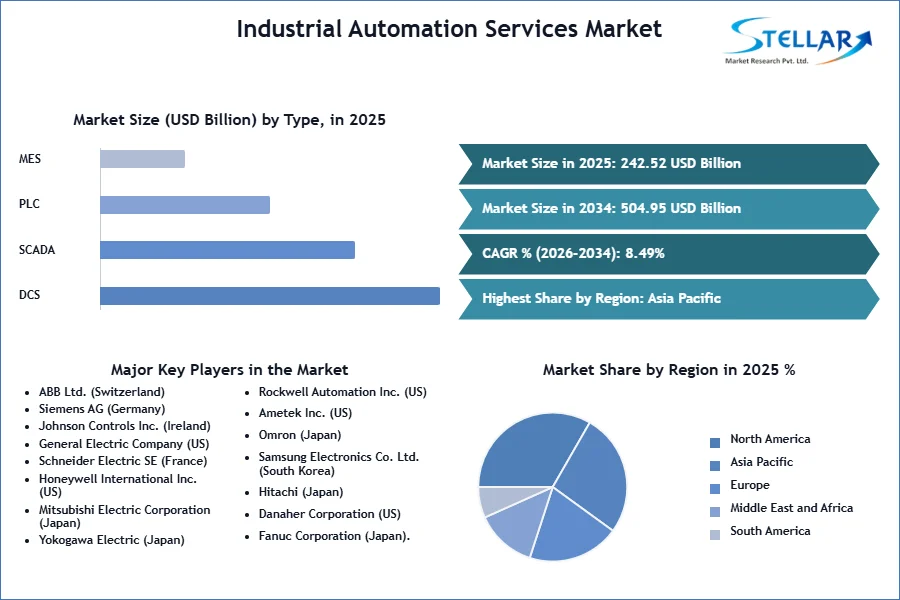
Industrial Automation Services Market was valued nearly USD 242.52 Bn. in 2025. Global Industrial Automation Services Market size is estimated to grow at a CAGR of 8.49% and is expected to reach at USD 504.95 Bn. by 2034.
Industrial Automation Services Market Overview & Dynamics:
Services of industrial automation can manage a large amount of unstructured data more professionally than manual handling. Industrial automation services use control systems such as computers or robots and information technology to handle operate machinery and different processes. These services control & regulate processes like installation, designing, maintenance & support. The Industrial Automation Services Market is studied and analysed on the basis of type of service, product type, end-user and region.
A rapidly growing demand for fast production volumes is primarily driving the global market for industrial automation services. Many industrial segments are accepting automation systems to decrease labour burdens, therefore accelerating market growth. The adoption of automation software is aiding companies to control the whole manufacturing process & delivery of superior-quality products. The deployment of industrial automation software solutions like PLCs, SCADA, and DCS has enabled industries to reduce costs associated with operational failures and wastage, in turn, booming the global growth of the industrial automation services market.
To get more Insights: Request Free Sample Report
Government Investments And Initiatives Provide a Good Opportunity For The Global Fluid Coupling Market To Grow.
The Thailand government intends to invest 12 billion USD 362 million in the first year, with an increase of US$ 6 Bn. Baht over the next 5 years. In addition, the development strategy intends to cut yearly robotics and automation system imports by USD 3.97 Bn. Companies such as Cairn, an Indian oil and gas facility, have demonstrated that they were able to maintain 1.6 lakh barrels of oil per day with automation and digitization, as opposed to 1.8 lakh barrels with less than a third of their staff due to the quarantine measures. These government investments and initiatives will help to accelerate the growth of the industrial automation services market.
Emerging Trends of Industrial Automation Services Market:
One of the key industrial automation services market trends that will contribute to market expansion is the virtualization of automation control systems. Physical servers' performance and usage are limited because they can only run one operating system and application at a time. This raises the overall cost for end-users who need several servers to run different operating systems and apps. As a result, end-users are rapidly adopting virtualization, which offers advantages such as better resource use and operation, as well as lower power costs. Virtual machines provide easy access to physical servers that are connected with industrial automation systems at various locations around the plant, lowering overall server costs. The growing use of virtualization in automation control systems will be aided by increased understanding of virtual software and flexibility in operating automation software.
Industrial Automation Services Market Segmentation:
The report covers all segments in the industrial automation services market such as type of service, product type, and end-user. Based on product type, the DCS segment is expected to grow at the highest CAGR of 9.52% over 2026-2034. DCS allows for central control, reporting, and monitoring of different components, which helps to centralise operations and give flexibility. The rising demand for DCS is due to benefits like scalability, ease of installation, and automatic updates. Furthermore, increased demand for DCS has been fuelled by global industrialization, particularly in developing APAC and Middle Eastern economies.
Strategic Expansion by Key Players:
In recent years, major players in the industrial automation services market have taken several strategic measures, such as facility expansions and partnerships.
APAC is expected to Hold Significant Share:
Thanks to the presence of large-scale companies in these regions, APAC will hold the greatest share of the industrial automation services market in 2025, followed by Europe and North America. The major manufacturers and end-users of industrial robots, sensors, and machine vision systems are Asian economies like China and Japan. In addition, the automobile, consumer goods, electronics, and pharmaceutical industries in India, China, and South Korea are all thriving. Furthermore, government initiatives and policies promoting the digitization of manufacturing plants, as well as investments in the IIoT, are important factors driving the adoption of industrial automation systems in these countries.
China is expected to lead the APAC market, generating revenue worth $XX Mn by 2034.
Chinese industrial automation services market is expected to register a CAGR of 10% during 2026-2034. Sensors, batteries, microchips, and other components utilised in the internet of things (IoT) system are all made in China. Furthermore, government efforts in India, such as Make in India and MSME, assist small and medium-sized firms in adopting innovative manufacturing solutions. The government's active activities are projected to drive the market's growth in this region.
Industry Developments:
Key developments in the Global Industrial Automation Services market, as well as organic and inorganic growth strategies, are covered in the studies. Product launches, product approvals, and other organic growth tactics such as patents and events are being prioritised by a number of companies.
Omron introduced the i4 series SCARA robot in January 2025, which automates high-speed, high-precision assembly and transportation while being simple to install. The i4 series includes a high-performance i4H medium to large model and a compact i4L variant appropriate for lightweight applications. The interlocking of each device is possible by smoothly integrating and operating the "i4 series" robots, the robot-hands (End Effector*1), and other peripheral devices, and intricate operations that could not be done with ordinary SCARA robots are now automated.
Mitsubishi Electric Corporation announced the development of seven additional X-Series products in April 2025, including two HVIGBTs and five HVDIODEs, for a total of 24 X-Series power semiconductor modules. These modules are intended for high-voltage, large-current equipment such as traction motors, DC-power transmitters, large industrial machines, and other high-voltage, small-size inverters. The models will be released in order starting in July.
The objective of the report is to present a comprehensive analysis of the Industrial Automation Services Market to the stakeholders in the industry. The report provides trends that are most dominant in the Industrial Automation Services Market and how these trends will influence new business investments and market development throughout the forecast period. The report also aids in the comprehension of the global market dynamics and competitive structure of the market by analyzing market leaders, market followers, and regional players.
The qualitative and quantitative data provided in the Industrial Automation Services Market report is to help understand which market segments, regions are expected to grow at higher rates, factors affecting the market, and key opportunity areas, which will drive the industry and market growth through the forecast period. The report also includes the competitive landscape of key players in the industry along with their recent developments in the Industrial Automation Services Market. The report studies factors such as company size, market share, market growth, revenue, production volume, and profits of the key players in the global market.
The report provides Porter's Five Force Model, which helps in designing the business strategies in the market. The report helps in identifying how many rivals are existing, who they are, and how their product quality is in the Market. The report also analyses if the Industrial Automation Services Market is easy for a new player to gain a foothold in the market, do they enter or exit the market regularly if the market is dominated by a few players, etc.
The report also includes a PESTEL Analysis, which aids in the development of company strategies. Political variables help in figuring out how much a government can influence the Market. Economic variables aid in the analysis of economic performance drivers that have an impact on the Market. Understanding the impact of the surrounding environment and the influence of environmental concerns on the Industrial Automation Services Market is aided by legal factors.
Global Industrial Automation Services Market Scope:
|
Industrial Automation Services Market |
|
|
Market Size in 2025 |
USD 242.52 Bn. |
|
Market Size in 2034 |
USD 504.95 Bn. |
|
CAGR (2026-2034) |
8.4% |
|
Historic Data |
2020-2025 |
|
Base Year |
2025 |
|
Forecast Period |
2026-2034 |
|
Segment Scope |
By Type of Service
|
|
By Product Type
|
|
|
By End User
|
|
|
Regional Scope |
North America- United States, Canada, and Mexico Europe – UK, France, Germany, Italy, Spain, Sweden, Austria, and Rest of Europe Asia Pacific – China, India, Japan, South Korea, Australia, ASEAN, Rest of APAC Middle East and Africa - South Africa, GCC, Egypt, Nigeria, Rest of the Middle East and Africa South America – Brazil, Argentina, Rest of South America |
Major Players operating in the Global Industrial Automation Services Market are:
- ABB Ltd. (Switzerland)
- Siemens AG (Germany)
- Johnson Controls Inc. (Ireland)
- General Electric Company (US)
- Schneider Electric SE (France)
- Honeywell International Inc. (US)
- Mitsubishi Electric Corporation (Japan)
- Yokogawa Electric (Japan)
- Rockwell Automation Inc. (US)
- Ametek Inc. (US)
- Omron (Japan)
- Samsung Electronics Co. Ltd. (South Korea)
- Hitachi (Japan)
- Danaher Corporation (US)
- Fanuc Corporation (Japan).
Regional Breakdown:
Frequently Asked Questions
The US will lead the Industrial Automation Market in North America in the future.
Major competitors of the market are Rockwell, ABB, Siemens and GE.
APAC and Europe are going to grow with the highest CAGR
The market size of the Digital Railway Market by 2034 is USD 504.95Bn.
1. Research Methodology
1.1 Research Data
1.1.1. Primary Data
1.1.2. Secondary Data
1.2. Market Size Estimation
1.2.1. Bottom-Up Approach
1.2.2. Top-Down Approach
1.3. Market Breakdown and Data Triangulation
1.4. Research Assumption
2. Industrial Automation Services Market Executive Summary
2.1. Market Overview
2.2. Market Size (2025) and Forecast (2026– 2034) and Y-O-Y%
2.3. Market Size (USD) and Market Share (%) – By Segments and Regions
3. Global Industrial Automation Services Market: Competitive Landscape
3.1. SMR Competition Matrix
3.2. Key Players Benchmarking
3.2.1. Company Name
3.2.2. Headquarter
3.2.3. Business Segment
3.2.4. End-user Segment
3.2.5. Y-O-Y%
3.2.6. Revenue (2025)
3.2.7. Profit Margin
3.2.8. Market Share
3.2.9. Company Locations
3.3. Market Structure
3.3.1. Market Leaders
3.3.2. Market Followers
3.3.3. Emerging Players
3.4. Consolidation of the Market
3.4.1. Strategic Initiatives
3.4.2. Mergers and Acquisitions
3.4.3. Collaborations and Partnerships
3.4.4. Developments and Innovations
4. Industrial Automation Services Market: Dynamics
4.1. Industrial Automation Services Market Trends by Region
4.1.1. North America
4.1.2. Europe
4.1.3. Asia Pacific
4.1.4. Middle East and Africa
4.1.5. South America
4.2. Industrial Automation Services Market Drivers
4.3. Industrial Automation Services Market Restraints
4.4. Industrial Automation Services Market Opportunities
4.5. Industrial Automation Services Market Challenges
4.6. PORTER’s Five Forces Analysis
4.6.1. Intensity of the Rivalry
4.6.2. Threat of New Entrants
4.6.3. Bargaining Power of Suppliers
4.6.4. Bargaining Power of Buyers
4.6.5. Threat of Substitutes
4.7. PESTLE Analysis
4.7.1. Political Factors
4.7.2. Economic Factors
4.7.3. Social Factors
4.7.4. Technological Factors
4.7.5. Legal Factors
4.7.6. Environmental Factors
4.8. Technological Roadmap
4.9. Regulatory Landscape
4.9.1. Market Regulation by Region
4.9.1.1. North America
4.9.1.2. Europe
4.9.1.3. Asia Pacific
4.9.1.4. Middle East and Africa
4.9.1.5. South America
4.9.2. Impact of Regulations on Market Dynamics
4.9.3. Government Schemes and Initiatives
5. Global Industrial Automation Services Market: Global Market Size and Forecast by Segmentation (by Value in USD Million) (2026-2034)
5.1. Global Industrial Automation Services Market Size and Forecast, by Type of Service (2026-2034)
5.1.1. Project Engineering and Installation
5.1.2. Maintenance and Support Services
5.1.3. Consulting Services
5.1.4. Operational Services
5.2. Global Industrial Automation Services Market Size and Forecast, by Product Type (2026-2034)
5.2.1. DCS
5.2.2. SCADA
5.2.3. PLC
5.2.4. MES
5.2.5. Others
5.3. Global Industrial Automation Services Market Size and Forecast, by End User (2026-2034)
5.3.1. Discrete Industries
5.3.2. Process Industries
5.4. Global Industrial Automation Services Market Size and Forecast, by Region (2026-2034)
5.4.1. North America
5.4.2. Europe
5.4.3. Asia Pacific
5.4.4. Middle East and Africa
5.4.5. South America
6. North America Industrial Automation Services Market Size and Forecast by Segmentation (by Value in USD Million) (2026-2034)
6.1. North America Industrial Automation Services Market Size and Forecast, by Type of Service (2026-2034)
6.1.1. Project Engineering and Installation
6.1.2. Maintenance and Support Services
6.1.3. Consulting Services
6.1.4. Operational Services
6.2. North America Industrial Automation Services Market Size and Forecast, by Product Type (2026-2034)
6.2.1. DCS
6.2.2. SCADA
6.2.3. PLC
6.2.4. MES
6.2.5. Others
6.3. North America Industrial Automation Services Market Size and Forecast, by End User (2026-2034)
6.3.1. Discrete Industries
6.3.2. Process Industries
6.4. North America Industrial Automation Services Market Size and Forecast, by Country (2026-2034)
6.4.1. United States
6.4.2. Canada
6.4.3. Mexico
7. Europe Industrial Automation Services Market Size and Forecast by Segmentation (by Value in USD Million) (2026-2034)
7.1. Europe Industrial Automation Services Market Size and Forecast, by Type of Service (2026-2034)
7.2. Europe Industrial Automation Services Market Size and Forecast, by Product Type (2026-2034)
7.3. Europe Industrial Automation Services Market Size and Forecast, by End User (2026-2034)
7.4. Europe Industrial Automation Services Market Size and Forecast, by Country (2026-2034)
7.4.1. United Kingdom
7.4.2. France
7.4.3. Germany
7.4.4. Italy
7.4.5. Spain
7.4.6. Sweden
7.4.7. Austria
7.4.8. Rest of Europe
8. Asia Pacific Industrial Automation Services Market Size and Forecast by Segmentation (by Value in USD Million) (2026-2034)
8.1. Asia Pacific Industrial Automation Services Market Size and Forecast, by Type of Service (2026-2034)
8.2. Asia Pacific Industrial Automation Services Market Size and Forecast, by Product Type (2026-2034)
8.3. Asia Pacific Industrial Automation Services Market Size and Forecast, by End User (2026-2034)
8.4. Asia Pacific Industrial Automation Services Market Size and Forecast, by Country (2026-2034)
8.4.1. China
8.4.2. S Korea
8.4.3. Japan
8.4.4. India
8.4.5. Australia
8.4.6. Indonesia
8.4.7. Malaysia
8.4.8. Vietnam
8.4.9. Taiwan
8.4.10. Rest of Asia Pacific
9. Middle East and Africa Industrial Automation Services Market Size and Forecast by Segmentation (by Value in USD Million) (2026-2034)
9.1. Middle East and Africa Industrial Automation Services Market Size and Forecast, by Type of Service (2026-2034)
9.2. Middle East and Africa Industrial Automation Services Market Size and Forecast, by Product Type (2026-2034)
9.3. Middle East and Africa Industrial Automation Services Market Size and Forecast, by End User (2026-2034)
9.4. Middle East and Africa Industrial Automation Services Market Size and Forecast, by Country (2026-2034)
9.4.1. South Africa
9.4.2. GCC
9.4.3. Nigeria
9.4.4. Rest of ME&A
10. South America Industrial Automation Services Market Size and Forecast by Segmentation (by Value in USD Million) (2026-2034)
10.1. South America Industrial Automation Services Market Size and Forecast, by Type of Service (2026-2034)
10.2. South America Industrial Automation Services Market Size and Forecast, by Product Type (2026-2034)
10.3. South America Industrial Automation Services Market Size and Forecast, by End User (2026-2034)
10.4. South America Industrial Automation Services Market Size and Forecast, by Country (2026-2034)
10.4.1. Brazil
10.4.2. Argentina
10.4.3. Rest Of South America
11. Company Profile: Key Players
11.1. ABB Ltd. (Switzerland)
11.1.1. Company Overview
11.1.2. Business Portfolio
11.1.3. Financial Overview
11.1.3.1. Total Revenue
11.1.3.2. Segment Revenue
11.1.3.3. Regional Revenue
11.1.4. SWOT Analysis
11.1.5. Strategic Analysis
11.1.6. Recent Developments
11.2. Siemens AG (Germany)
11.3. Johnson Controls Inc. (Ireland)
11.4. General Electric Company (US)
11.5. Schneider Electric SE (France)
11.6. Honeywell International Inc. (US)
11.7. Mitsubishi Electric Corporation (Japan)
11.8. Yokogawa Electric (Japan)
11.9. Rockwell Automation Inc. (US)
11.10. Ametek Inc. (US)
11.11. Omron (Japan)
11.12. Samsung Electronics Co. Ltd. (South Korea)
11.13. Hitachi (Japan)
11.14. Danaher Corporation (US)
11.15. Fanuc Corporation (Japan)
12. Key Findings
13. Analyst Recommendations
13.1. Strategic Recommendations
13.2. Future Outlook