Topical Drug Delivery Market Global Industry Analysis and Forecast (2026-2032) by Product, Route of Administration, Facility of Use, and Region
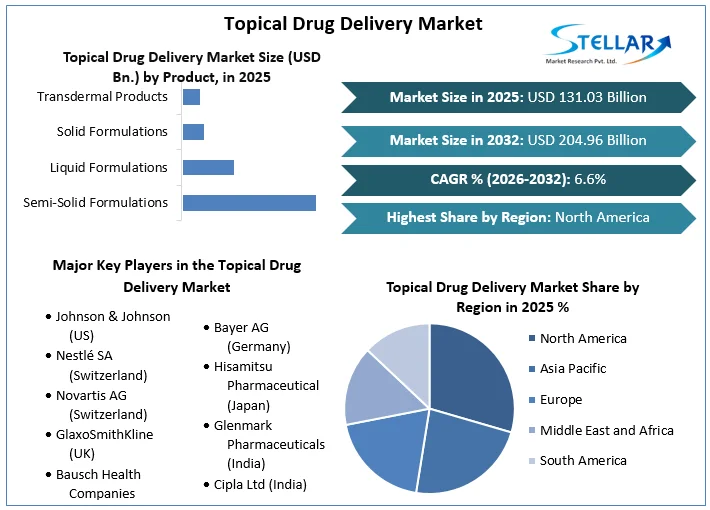
Topical Drug Delivery Market size was valued at US$ 131.03 Bn. in 2025 and the total revenue is expected to grow at a CAGR of 6.6% through 2026 to 2032, reaching nearly US$ 204.96 Bn
Topical Drug Delivery Market Overview:
A topical drug delivery system (TDDS) is a method of delivering medications to the skin for topical therapeutic effects. Pharmacists use the skin to deliver various medications because it is one of the largest and most superficial organs in the human body. This system usually has a local influence on specific body postures.
Though topical drug delivery market forecast through 2032 is based on real output, demand and supply of 2025, 2025 numbers are also estimated on real numbers published by key players as well all-important players across the world. Market forecasting till 2032 is done based on past data from 2020 to 2025 with the impact of global lock down on the market in 2020 and 2021.
To get more Insights: Request Free Sample Report
Topical Drug Delivery Market Dynamics:
Skin diseases such as psoriasis, eczema, skin cancer, and vitiligo continue to be the fourth-leading cause of nonfatal disease burden globally, according to the Global Burden of Disease Project, and affect a considerable proportion of the global population. According to the World Health Organization, between 2 and 3 million cases of non-melanoma skin cancer and 132,000 cases of melanoma skin cancer are detected each year. Furthermore, the global prevalence of psoriasis ranges from 0.09 percent to 11.43 percent, making it a severe global disease affecting at least 100 million people. The Topical Drug Delivery Market is expected to grow, due to rise in demand for sophisticated topical products, as topical drug administration is the first line of treatment for the majority of skin illnesses.
Patients and end users can choose from a variety of medicine delivery options. The advantages of these options over topical drug delivery are a significant impediment to the topical drug delivery market's growth. The oral route is the most popular since it is simple to use, convenient, cost-effective, and safe. Orally delivered medications can also be kept easily and are portable, cost-effective, noninvasive, and safe. In comparison to topical preparations, no additional training is necessary for the administration of these medications. Injectables, such as insulin injections for diabetics to self-administer, are also widely used.
One of the emerging trends in the topical drug delivery market is the delivery of biologics via the transdermal route. The use of transdermal delivery of big molecules instead of intramuscular, subcutaneous, or intravenous routes of administration is expected to give considerable patient benefits, including painless medication delivery and cost-effective treatment.
Topical Drug Delivery Market Segment Analysis:
Based on the Product, the market is segmented into Semi-solid Formulations, Liquid Formulations, Solid Formulations, and Transdermal Products. Semi-solid Formulations segment is expected to hold the largest market shares of xx% by 2032. The factors are due to their capacity to deliver a wide range of pharmacological molecules and the ease with which semi-solid formulations can be applied. Creams, gels, ointments, suppositories, and other topical dose forms fall into the semi-solid medication group. Consistency, dosage homogeneity, preservatives, method of administration, and formulation base are all characteristics shared by semi-solid medication formulations. These are the factors that are expected to drives the growth of this segment in the Topical Drug Delivery market during the forecast period 2026-2032.
Based on the Route of Administration, the market is segmented into Dermal Drug Delivery, Ophthalmic Drug Delivery, Rectal Drug Delivery, Vaginal Drug Delivery, and Nasal Drug Delivery. Dermal Drug Delivery segment is expected to grow rapidly at a CAGR of xx% during the forecast period 2026-2032. Because it is more convenient and patient-friendly than other topical medication delivery methods. Dermal products are subject to less regulations than ophthalmic products, which must undergo sterility testing.
Based on the Facility of Use, the topical drug delivery market is segmented into Home Care Settings, Hospitals & Clinics, Burn Centers, and Other Facilities. Home Care Settings segment is expected to grow rapidly at a CAGR of xx% during the forecast period 2026-2032. This is due to major factors such as the ease of use and low cost of topical medicines for home administration. Furthermore, for patients who require long-term therapy, inpatient care is not only prohibitive to resuming a normal lifestyle and work activities, but it is also prohibitively expensive. In this aspect, technological improvements have aided patients in receiving therapies at home in an effective and safe manner.

Topical Drug Delivery Market Regional Insights:
North America region is expected to dominate the Topical Drug Delivery market during the forecast period 2026-2032. North America region is expected to hold the largest market share of xx% by 2032. The market is expecting positive growth as a result of the COVID-19 outbreak. This is primarily owing to the unique treatment that is currently being developed. For example, the US Food and Drug Administration authorised 'T3X,' an over-the-counter ointment created by Advanced Penetration Technology, in August 2020. It has been found to be effective against the SARS-CoV-2 virus. Due to circumstances such as the availability of a wide number of pharmaceutical businesses and medication delivery technology suppliers, research have revealed that T3X was able to eliminate the virus within 30 seconds. These are the key major drivers that are expected to drives the growth of the North America region in the Topical Drug Delivery Market during the forecast period.
Asia Pacific region is expected to grow rapidly at a CAGR of xx% during the forecast period 2026-2032. Topical drug delivery has been on the rise in Asia Pacific, as a result of skin diseases (e.g. skin cancer), increasing contraceptive use, and the focus of pharmaceutical companies on developing smart transdermal drug delivery systems.
The objective of the report is to present a comprehensive analysis of the Topical Drug Delivery Market to the stakeholders in the industry. The report provides trends that are most dominant in the Topical Drug Delivery Market and how these trends will influence new business investments and market development throughout the forecast period. The report also aids in the comprehension of the market dynamics and competitive structure of the market by analyzing market leaders, market followers, and regional players.
The qualitative and quantitative data provided in the Topical Drug Delivery Market report is to help understand which market segments, regions are expected to grow at higher rates, factors affecting the market, and key opportunity areas, which will drive the industry and market growth through the forecast period. The report also includes the competitive landscape of key players in the industry along with their recent developments in the Topical Drug Delivery Market. The report studies factors such as company size, market share, market growth, revenue, production volume, and profits of the key players in the global market.
The report provides Porter's Five Force Model, which helps in designing the business strategies in the market. The report helps in identifying how many rivals are existing, who they are, and how their product quality is in the Market. The report also analyses if the Topical Drug Delivery Market is easy for a new player to gain a foothold in the market, do they enter or exit the market regularly if the market is dominated by a few players, etc.
The report also includes a PESTEL Analysis, which aids in the development of company strategies. Political variables help in figuring out how much a government can influence the Market. Economic variables aid in the analysis of economic performance drivers that have an impact on the Market. Understanding the impact of the surrounding environment and the influence of environmental concerns on the Topical Drug Delivery Market is aided by legal factors.
Topical Drug Delivery Market Scope:
|
Topical Drug Delivery Market |
|
|
Market Size in 2025 |
USD 131.03 Bn. |
|
Market Size in 2032 |
USD 204.96 Bn. |
|
CAGR (2026-2032) |
6.6% |
|
Historic Data |
2020-2025 |
|
Base Year |
2025 |
|
Forecast Period |
2026-2032 |
|
Segment Scope |
By Product
|
|
By Route of Administration
|
|
|
By Facility of Use
|
|
|
Regional Scope |
North America- United States, Canada, and Mexico Europe – UK, France, Germany, Italy, Spain, Sweden, Austria, and Rest of Europe Asia Pacific – China, India, Japan, South Korea, Australia, ASEAN, Rest of APAC Middle East and Africa - South Africa, GCC, Egypt, Nigeria, Rest of the Middle East and Africa South America – Brazil, Argentina, Rest of South America |
Topical Drug Delivery Market Key Players
- Johnson & Johnson (US)
- Nestlé SA (Switzerland)
- Novartis AG (Switzerland)
- GlaxoSmithKline (UK)
- Bausch Health Companies (Canada)
- Merck & Co (US)
- Bayer AG (Germany)
- Hisamitsu Pharmaceutical (Japan)
- Glenmark Pharmaceuticals (India)
- Cipla Ltd (India)
- Crescita Therapeutics Inc. (Canada)
- Mylan (US)
- Encore Dermatology, Inc. (US)
- LEO Pharma (Denmark)
- Almirall, S.A (Spain)
- Aclaris Therapeutics, Inc. (US)
- Taro Pharmaceutical Industries Ltd. (US)
Frequently Asked Questions
North America is expected to hold the highest share in the Topical Drug Delivery Market.
Johnson & Johnson (US), Nestlé SA (Switzerland), Novartis AG (Switzerland), GlaxoSmithKline (UK), and Bausch Health Companies (Canada) are the top key players in the Topical Drug Delivery Market.
Semi-solid Formulations segment hold the largest market share in the Topical Drug Delivery market by 2032.
The market size of the Topical Drug Delivery market is expected to reach US $ 204.96 Bn. by 2032.
The market size of the Topical Drug Delivery market was worth US $ 131.03 Bn. in 2025.
1. Topical Drug Delivery Market: Research Methodology
1.1. Research Data
1.1.1. Primary Data
1.1.2. Secondary Data
1.2. Market Size Estimation
1.2.1. Bottom-Up Approach
1.2.2. Top-Down Approach
1.3. Market Breakdown and Data Triangulation
1.4. Research Assumptions
2. Topical Drug Delivery Market: Executive Summary
2.1. Market Overview
2.2. Market Size (2025) and Forecast (2026– 2032) and Y-O-Y%
2.3. Market Size (USD) and Market Share (%) – By Segments and Regions
3. Topical Drug Delivery Market: Competitive Landscape
3.1. Stellar Competition Matrix
3.2. Key Players Benchmarking
3.2.1. Company Name
3.2.2. Headquarter
3.2.3. Business Segment
3.2.5. End-user Segment
3.2.6. Y-O-Y%
3.2.7. Revenue (2025)
3.2.8. Profit Margin
3.2.9. Market Share
3.2.10. Company Locations
3.3. Market Structure
3.3.1. Market Leaders
3.3.2. Market Followers
3.3.3. Emerging Players
3.4. Consolidation of the Market
3.4.1. Strategic Initiatives and Developments
3.4.2. Mergers and Acquisitions
3.4.3. Collaborations and Partnerships
4. Topical Drug Delivery Market: Dynamics
4.1. Market Trends by Region
4.1.1. North America
4.1.2. Europe
4.1.3. Asia Pacific
4.1.4. Middle East and Africa
4.1.5. South America
4.2. Market Drivers
4.3. Market Restraints
4.4. Market Opportunities
4.5. Market Challenges
4.6. PORTER’s Five Forces Analysis
4.6.1. Intensity of the Rivalry
4.6.2. Threat of New Entrants
4.6.3. Bargaining Power of Suppliers
4.6.4. Bargaining Power of Buyers
4.6.5. Threat of Substitutes
4.7. PESTLE Analysis
4.7.1. Political Factors
4.7.2. Economic Factors
4.7.3. Social Factors
4.7.4. Technological Factors
4.7.5. Legal Factors
4.7.6. Environmental Factors
4.8. Technological Roadmap
4.9. Regulatory Landscape
4.9.1. Market Regulation by Region
4.9.1.1. North America
4.9.1.2. Europe
4.9.1.3. Asia Pacific
4.9.1.4. Middle East and Africa
4.9.1.5. South America
4.9.2. Impact of Regulations on Market Dynamics
4.9.3. Government Schemes and Initiatives
5. Topical Drug Delivery Market Size and Forecast by Segments (by Value USD Million)
5.1. Topical Drug Delivery Market Size and Forecast, By Product (2025-2032)
5.1.1. Semi-Solid Formulations
5.1.2. Liquid Formulations
5.1.3. Solid Formulations
5.1.4. Transdermal Products
5.2. Topical Drug Delivery Market Size and Forecast, By Route of Administration (2025-2032)
5.2.1. Dermal Drug Delivery
5.2.2. Ophthalmic Drug Delivery
5.2.3. Rectal Drug Delivery
5.2.4. Vaginal Drug Delivery
5.2.5. Nasal Drug Delivery
5.3. Topical Drug Delivery Market Size and Forecast, By Facility of Use (2025-2032)
5.3.1. Home Care Settings
5.3.2. Hospitals & Clinics
5.3.3. Burn Centers
5.3.4. Other Facilities
5.4. Topical Drug Delivery Market Size and Forecast, by Region (2025-2032)
5.4.1. North America
5.4.2. Europe
5.4.3. Asia Pacific
5.4.4. Middle East and Africa
5.4.5. South America
6. North America Topical Drug Delivery Market Size and Forecast (by Value USD Million)
6.1. North America Topical Drug Delivery Market Size and Forecast, By Product (2025-2032)
6.1.1. Semi-Solid Formulations
6.1.2. Liquid Formulations
6.1.3. Solid Formulations
6.1.4. Transdermal Products
6.2. North America Topical Drug Delivery Market Size and Forecast, By Route of Administration (2025-2032)
6.2.1. Dermal Drug Delivery
6.2.2. Ophthalmic Drug Delivery
6.2.3. Rectal Drug Delivery
6.2.4. Vaginal Drug Delivery
6.2.5. Nasal Drug Delivery
6.3. North America Topical Drug Delivery Market Size and Forecast, By Facility of Use (2025-2032)
6.3.1. Home Care Settings
6.3.2. Hospitals & Clinics
6.3.3. Burn Centers
6.3.4. Other Facilities
6.4. North America Topical Drug Delivery Market Size and Forecast, by Country (2025-2032)
6.4.1. United States
6.4.2. Canada
6.4.3. Mexico
7. Europe Topical Drug Delivery Market Size and Forecast (by Value USD Million)
7.1. Europe Topical Drug Delivery Market Size and Forecast, By Product (2025-2032)
7.2. Europe Topical Drug Delivery Market Size and Forecast, By Route of Administration (2025-2032)
7.3. Europe Topical Drug Delivery Market Size and Forecast, By Facility of Use (2025-2032)
7.4. Europe Topical Drug Delivery Market Size and Forecast, by Country (2025-2032)
7.4.1. UK
7.4.2. France
7.4.3. Germany
7.4.4. Italy
7.4.5. Spain
7.4.6. Sweden
7.4.7. Austria
7.4.8. Rest of Europe
8. Asia Pacific Topical Drug Delivery Market Size and Forecast (by Value USD Million)
8.1. Asia Pacific Topical Drug Delivery Market Size and Forecast, By Product (2025-2032)
8.2. Asia Pacific Topical Drug Delivery Market Size and Forecast, By Route of Administration (2025-2032)
8.3. Asia Pacific Topical Drug Delivery Market Size and Forecast, By Facility of Use (2025-2032)
8.4. Asia Pacific Topical Drug Delivery Market Size and Forecast, by Country (2025-2032)
8.4.1. China
8.4.2. S Korea
8.4.3. Japan
8.4.4. India
8.4.5. Australia
8.4.6. Indonesia
8.4.7. Malaysia
8.4.8. Vietnam
8.4.9. Taiwan
8.4.10. Bangladesh
8.4.11. Pakistan
8.4.12. Rest of Asia Pacific
9. Middle East and Africa Topical Drug Delivery Market Size and Forecast (by Value USD Million)
9.1. Middle East and Africa Topical Drug Delivery Market Size and Forecast, By Product (2025-2032)
9.2. Middle East and Africa Topical Drug Delivery Market Size and Forecast, By Route of Administration (2025-2032)
9.3. Middle East and Africa Topical Drug Delivery Market Size and Forecast, By Facility of Use (2025-2032)
9.4. Middle East and Africa Topical Drug Delivery Market Size and Forecast, by Country (2025-2032)
9.4.1. South Africa
9.4.2. GCC
9.4.3. Egypt
9.4.4. Nigeria
9.4.5. Rest of ME&A
10. South America Topical Drug Delivery Market Size and Forecast (by Value USD Million)
10.1. South America Topical Drug Delivery Market Size and Forecast, By Product (2025-2032)
10.2. South America Topical Drug Delivery Market Size and Forecast, By Route of Administration (2025-2032)
10.3. South America Topical Drug Delivery Market Size and Forecast, By Facility of Use (2025-2032)
10.4. South America Topical Drug Delivery Market Size and Forecast, by Country (2025-2032)
10.4.1. Brazil
10.4.2. Argentina
10.4.3. Rest of South America
11. Company Profile: Key players
11.1. Johnson & Johnson (US)
11.1.1. Overview
11.1.2. Business Portfolio
11.1.3. Financial Overview
11.1.3.1. Total Revenue
11.1.3.2. Segment Revenue
11.1.3.3. Regional Revenue
11.1.4. SWOT Analysis
11.1.5. Strategic Analysis
11.1.6. Recent Developments
11.2. Nestlé SA (Switzerland)
11.3. Novartis AG (Switzerland)
11.4. GlaxoSmithKline (UK)
11.5. Bausch Health Companies (Canada)
11.6. Merck & Co (US)
11.7. Bayer AG(Germany)
11.8. Hisamitsu Pharmaceutical (Japan)
11.9. Glenmark Pharmaceuticals (India)
11.10. Cipla Ltd (India)
11.11. Crescita Therapeutics Inc. (Canada)
11.12. Mylan (US)
11.13. Encore Dermatology, Inc. (US)
11.14. LEO Pharma (Denmark)
11.15. Almirall, S.A (Spain)
11.16. Aclaris Therapeutics, Inc. (US)
11.17. Taro Pharmaceutical Industries Ltd. (US)
12. Key Findings
13. Industry Recommendations
13.1. Strategic Recommendations
13.2. Future Outlook


