Membrane Market: Global Industry Analysis and Forecast (2024-2030) by Technology, Application, and Region
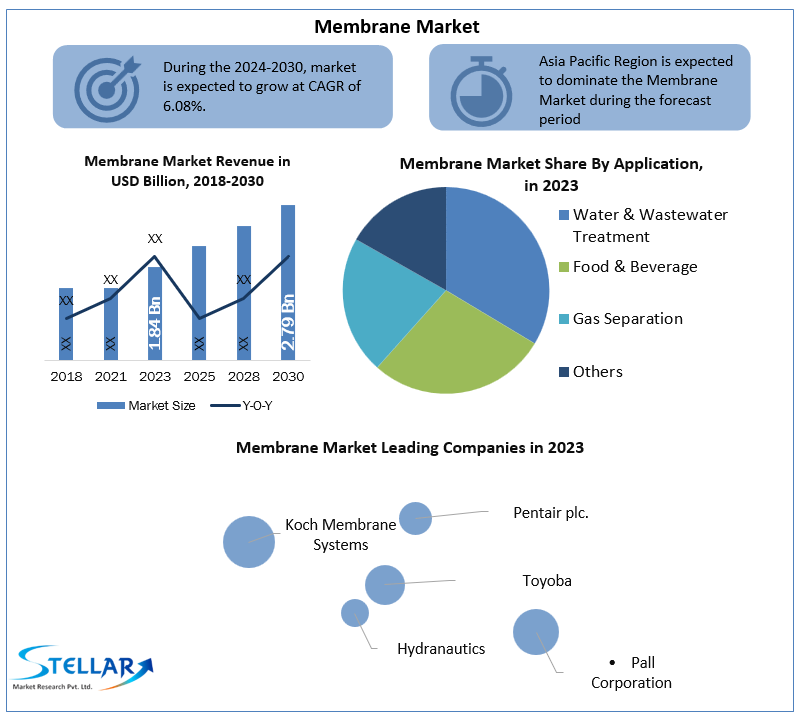
Membrane Market size was valued at US$ 1.84 Billion in 2023 and the Membrane Market revenue is expected to grow at 6.08% through 2024 to 2030, reaching nearly US$ 2.79 Billion.
Format : PDF | Report ID : SMR_112
Membrane Market Overview:
Membranes are thin films that allow certain molecules and particles to pass through depending on their size. To put it another way, they're semi-permeable. Depending on the size of the substrates to be separated, methods such as MF (microfiltration), UF (ultrafiltration), NF (nanofiltration), and others are adopted for a variety of applications. Microfiltration and Ultrafiltration are two of the earliest large-scale uses of these barrier films, and they are currently in use in a number of water treatment plants throughout the world. Natural or synthetic polymers, as well as metallic powders, ceramics, and zeolites, are used to make these barrier films. The global report for the Membrane market helps with the segment wise analysis based on the technologies available and the applications.
To get more Insights: Request Free Sample Report
Polymeric membranes, particularly polytetrafluoroethylene (PTFE) and polyvinylidene fluoride (PVDF), dominate the global Membrane market. Ceramic ones are highly inert and are preferred in settings with strong acidity and basicity. Because of their homogeneous pore distribution, zeolite membranes are preferred in gas separation procedures.
Membrane Market Dynamics:
Water purification needs are growing due to a scarcity of fresh drinking water:
The survival of human life depends on the availability of freshwater for drinking. The water issue has only deepened as a result of the rapid increase in population, and it has become imperative to make optimum use of limited resources. Advances in this technology have helped to alleviate some of the pressure on current freshwater resources. Using this method, seawater may now be transformed to drinking water.
Desalination plants (which employ this technology) have proven to be a blessing to individuals and countries with restricted water supplies. People in places like the Middle East and Africa, for example, rely heavily on desalination plants for a variety of activities, including farming, industry, and day-to-day needs. As the world's population grows, water shortages become more acute, and the growing number of desalination projects will going to drive the Membrane market growth.
Also, an increasing number of home water purifiers based on this technology add significantly to consumption.
Water pollution is increasing as a result of increased human activities to meet demand:
Industries contribute considerably to water pollution, and the burden on water resources in emerging countries has increased significantly as a result of growing urbanization and industrialization. Increasing environmental concerns have pushed legislators to enact strict industry discharge regulations in order to reduce water pollution. To comply with the rules, several firms use membrane-based technologies to lower the severity and level of contaminants in their discharge streams. This also drives Membrane market growth.
The concept of zero-discharge is relatively new, and membranes are critical to attaining zero liquid discharge (ZLD) and therefore decreasing industry's environmental effect. As the process of industrialization progresses, limiting the impact is the only way to maintain long-term growth.
Fouling causes frequent membrane replacements, which has an impact on its adoption:
Membrane fouling is a key issue that has a negative impact on its functioning and resposible in Membrane market growth restraining. It not only reduces efficiency, but it also reduces flux, leading in higher energy consumption and deterioration of water or stream quality. To get rid of contaminated products, the two options are chemical cleaning or replacement (both of which come at a high cost). When these expenses are taken into account, applications and acceptance are limited to specific industries, limiting market growth.
Membrane Market Key Advancements:
- In January 2022, Lanxess, a specialized chemical business, sold Suez the reverse osmosis (RO) membrane product line. Suez will be able to address the increased demand for brackish water RO membranes as a result of this acquisition.
- In October 2020, In the metallurgical business, Guo Chu Technology created innovative electrolytic membranes for corrosion solutions.
Membrane Market Segment Analysis:
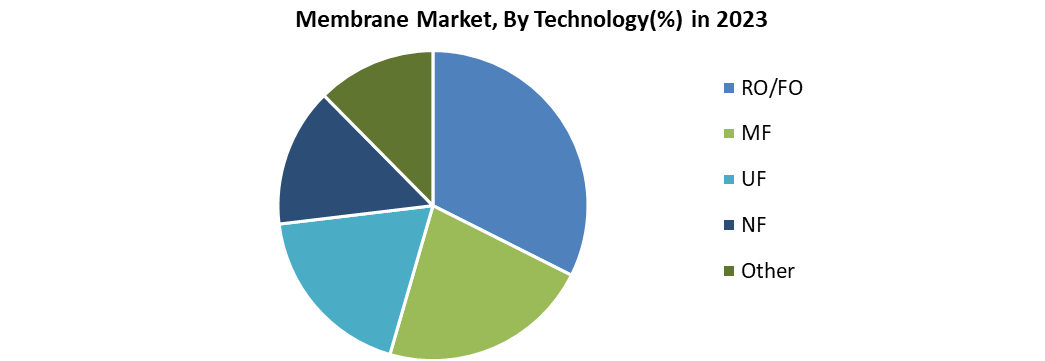
Based on Technology: RO/FO membrane technology is expected to remain dominant in the Global Membrane market.
Because of its widespread usage in water and wastewater treatment, RO/FO membrane technology is the most widely adopted. Also, it has a high rate of adoption in industrial applications, ensuring its long-term success in the sector. As the world's water crises worsen, RO/FO technology is expected to grow at the fastest rate in the membranes industry.
MF, which plays a major role in stream pre-treatment, is expected to grow at a slower rate than RO. Because of its capacity to remove high molecular dissolved chemicals, UF is becoming increasingly popular. In water and wastewater treatment, as well as industrial applications, NF is in high demand.
Detailed analysis of each segment mentioned in the scope table is covered in the SMR’s report.
Membrane Market Regional Insights:
In the year 2020, the Asia-Pacific region had the highest share of the membrane market, accounting for 40%. The rapid population rise in countries like India and China, along with an increase in demand for safe drinking water, is driving up the demand for wastewater treatment in the region. The overall operational capacity of wastewater treatment plants in India, as updated in June 2021, is 26,869 mega liters per day, according to statistics published by the National Informatics Centre of India. In India, 107 million people had access to safe drinking water at home by 2020.
Also, according to CWR (China Water Risk), China has set a goal of boosting wastewater treatment to 70% of urban households and improving the wastewater treatment situation by installing a 125,900km pipe network. The need for membrane filtration in the APAC area is growing as a result of this.
The report includes a PORTER, PESTEL analysis as well as the possible influence of microeconomic market determinants. External and internal elements that are expected to have a favorable or negative impact on the firm have been examined, providing decision-makers with a clear future vision of the industry. The research also aids in comprehending the Membrane market dynamics and structure by studying market segments and forecasting market size. The research is an investor's guide since it depicts the competitive analysis of major competitors in the Membrane market by product, price, financial situation, product portfolio, growth plans, and geographical presence.
Major breakthroughs in the Membrane industry are discussed, as well as organic and inorganic growth plans. Various companies are focusing on organic growth strategies such as new product releases, product approvals, and other items such as patents and events. Inorganic growth strategies used in the industry included acquisitions, partnerships, and collaborations.
Membrane Market Scope:
|
Membrane Market |
|
|
Market Size in 2023 |
USD 1.84 Bn. |
|
Market Size in 2030 |
USD 2.79 Bn. |
|
CAGR (2024-2030) |
6.08 % |
|
Historic Data |
2018-2022 |
|
Base Year |
2023 |
|
Forecast Period |
2024-2030 |
|
Segment Scope |
By Technology
|
|
By Application
|
|
|
Regional Scope |
North America- United States, Canada, and Mexico Europe – UK, France, Germany, Italy, Spain, Sweden, Austria, and Rest of Europe Asia Pacific – China, India, Japan, South Korea, Australia, ASEAN, Rest of APAC Middle East and Africa - South Africa, GCC, Egypt, Nigeria, Rest of the Middle East and Africa South America – Brazil, Argentina, Rest of South America |
Membrane Market Players
• Toray Industries Inc.
• DuPont
• Suez
• Koch Membrane Systems
• Pentair plc
• Toyoba
• Hydranautics
• Pall Corporation
• Seccua GmbH
• Aquatech
• Synder Filtration
• The Merck Group
• 3M
• Cytiva
• Prominent Group
• Others
Frequently Asked Questions
India region have the highest growth rate of xx% in the Membrane Market.
Toray Industries Inc., DuPont, Suez, Koch Membrane Systems, Pentair plc, Toyoba, Hydranautics, Pall Corporation, Seccua GmbH, Aquatech, Synder Filtration, The Merck Group, 3M, Cytiva, Prominent Group, and Others are the top players in the Membrane Market.
The Asia Pacific region held almost 40% of the overall market share.
Chapter 1 Scope of the Report
Chapter 2 Research Methodology
2.1. Research Process
2.2. Global Membrane Market: Target Audience
2.3. Global Membrane Market: Primary Research (As per Client Requirement)
2.4. Global Membrane Market: Secondary Research
Chapter 3 Executive Summary
Chapter 4 Competitive Landscape
4.1. Market Share Analysis, By Value, 2023-2030
4.1.1. Market Share Analysis, By Region, By Value, 2023-2030 (In %)
4.1.1.1. North America Market Share Analysis, By Value, 2023-2030 (In %)
4.1.1.2. Europe Market Share Analysis, By Value, 2023-2030 (In %)
4.1.1.3. Asia Pacific Market Share Analysis, By Value, 2023-2030 (In %)
4.1.1.4. South America Market Share Analysis, By Value, 2023-2030 (In %)
4.1.1.5. Middle East and Africa Market Share Analysis, By Value, 2023-2030 (In %)
4.1.2. Market Share Analysis, By Technology, By Value, 2023-2030 (In %)
4.1.2.1. North America Market Share Analysis, By Technology, By Value, 2023-2030 (In %)
4.1.2.1.1. USA Market Share Analysis, By Technology, By Value, 2023-2030 (In %)
4.1.2.1.2. Canada Market Share Analysis, By Technology, By Value, 2023-2030 (In %)
4.1.2.1.3. Mexico Market Share Analysis, By Technology, By Value, 2023-2030 (In %)
4.1.2.2. Europe Market Share Analysis, By Technology, By Value, 2023-2030 (In %)
4.1.2.2.1. UK Market Share Analysis, By Technology, By Value, 2023-2030 (In %)
4.1.2.2.2. France Market Share Analysis, By Technology, By Value, 2023-2030 (In %)
4.1.2.2.3. Germany Market Share Analysis, By Technology, By Value, 2023-2030 (In %)
4.1.2.2.4. Italy Market Share Analysis, By Technology, By Value, 2023-2030 (In %)
4.1.2.2.5. Spain Market Share Analysis, By Technology, By Value, 2023-2030 (In %)
4.1.2.2.6. Sweden Market Share Analysis, By Technology, By Value, 2023-2030 (In %)
4.1.2.2.7. Austria Market Share Analysis, By Technology, By Value, 2023-2030 (In %)
4.1.2.2.8. Rest of Europe Market Share Analysis, By Technology, By Value, 2023-2030 (In %)
4.1.2.3. Asia Pacific Market Share Analysis, By Technology, By Value, 2023-2030 (In %)
4.1.2.3.1. China Market Share Analysis, By Technology, By Value, 2023-2030 (In %)
4.1.2.3.2. India Market Share Analysis, By Technology, By Value, 2023-2030 (In %)
4.1.2.3.3. Japan Market Share Analysis, By Technology, By Value, 2023-2030 (In %)
4.1.2.3.4. South Korea Market Share Analysis, By Technology, By Value, 2023-2030 (In %)
4.1.2.3.5. Australia Market Share Analysis, By Technology, By Value, 2023-2030 (In %)
4.1.2.3.6. ASEAN Market Share Analysis, By Technology, By Value, 2023-2030 (In %)
4.1.2.3.7. Rest of APAC Market Share Analysis, By Technology, By Value, 2023-2030 (In %)
4.1.2.4. South America Market Share Analysis, By Technology, By Value, 2023-2030 (In %)
4.1.2.4.1. Brazil Market Share Analysis, By Technology, By Value, 2023-2030 (In %)
4.1.2.4.2. Argentina Market Share Analysis, By Technology, By Value, 2023-2030 (In %)
4.1.2.4.3. Rest of South America Market Share Analysis, By Technology, By Value, 2023-2030 (In %)
4.1.2.5. Middle East and Africa Market Share Analysis, By Technology, By Value, 2023-2030 (In %)
4.1.2.5.1. South Africa Market Share Analysis, By Technology, By Value, 2023-2030 (In %)
4.1.2.5.2. GCC Market Share Analysis, By Technology, By Value, 2023-2030 (In %)
4.1.2.5.3. Egypt Market Share Analysis, By Technology, By Value, 2023-2030 (In %)
4.1.2.5.4. Nigeria Market Share Analysis, By Technology, By Value, 2023-2030 (In %)
4.1.2.5.5. Rest of Middle East and Africa Market Share Analysis, By Technology, By Value, 2023-2030 (In %)
4.1.3. Market Share Analysis, By Application, By Value, 2023-2030 (In %)
4.1.4. North America Market Share Analysis, By Application, By Value, 2023-2030 (In %)
4.1.4.1.1. USA Market Share Analysis, By Application, By Value, 2023-2030 (In %)
4.1.4.1.2. Canada Market Share Analysis, By Application, By Value, 2023-2030 (In %)
4.1.4.1.3. Mexico Market Share Analysis, By Application, By Value, 2023-2030 (In %)
4.1.4.2. Europe Market Share Analysis, By Application, By Value, 2023-2030 (In %)
4.1.4.2.1. UK Market Share Analysis, By Application, By Value, 2023-2030 (In %)
4.1.4.2.2. France Market Share Analysis, By Application, By Value, 2023-2030 (In %)
4.1.4.2.3. Germany Market Share Analysis, By Application, By Value, 2023-2030 (In %)
4.1.4.2.4. Italy Market Share Analysis, By Application, By Value, 2023-2030 (In %)
4.1.4.2.5. Spain Market Share Analysis, By Application, By Value, 2023-2030 (In %)
4.1.4.2.6. Sweden Market Share Analysis, By Application, By Value, 2023-2030 (In %)
4.1.4.2.7. Austria Market Share Analysis, By Application, By Value, 2023-2030 (In %)
4.1.4.2.8. Rest of Europe Market Share Analysis, By Application, By Value, 2023-2030 (In %)
4.1.4.3. Asia Pacific Market Share Analysis, By Application, By Value, 2023-2030 (In %)
4.1.4.3.1. China Market Share Analysis, By Application, By Value, 2023-2030 (In %)
4.1.4.3.2. India Market Share Analysis, By Application, By Value, 2023-2030 (In %)
4.1.4.3.3. Japan Market Share Analysis, By Application, By Value, 2023-2030 (In %)
4.1.4.3.4. South Korea Market Share Analysis, By Application, By Value, 2023-2030 (In %)
4.1.4.3.5. Australia Market Share Analysis, By Application, By Value, 2023-2030 (In %)
4.1.4.3.6. ASEAN Market Share Analysis, By Application, By Value, 2023-2030 (In %)
4.1.4.3.7. Rest of APAC Market Share Analysis, By Application, By Value, 2023-2030 (In %)
4.1.4.4. South America Market Share Analysis, By Application, By Value, 2023-2030 (In %)
4.1.4.4.1. Brazil Market Share Analysis, By Application, By Value, 2023-2030 (In %)
4.1.4.4.2. Argentina Market Share Analysis, By Application, By Value, 2023-2030 (In %)
4.1.4.4.3. Rest of South America Market Share Analysis, By Application, By Value, 2023-2030 (In %)
4.1.4.5. Middle East and Africa Market Share Analysis, By Application, By Value, 2023-2030 (In %)
4.1.4.5.1. South Africa Market Share Analysis, By Application, By Value, 2023-2030 (In %)
4.1.4.5.2. GCC Market Share Analysis, By Application, By Value, 2023-2030 (In %)
4.1.4.5.3. Egypt Market Share Analysis, By Application, By Value, 2023-2030 (In %)
4.1.4.5.4. Nigeria Market Share Analysis, By Application, By Value, 2023-2030 (In %)
4.1.4.5.5. Rest of Middle East and Africa Market Share Analysis, By Application, By Value, 2023-2030 (In %)
4.2. Stellar Competition matrix
4.2.1. Global Stellar Competition Matrix
4.2.2. North America Stellar Competition Matrix
4.2.3. Europe Stellar Competition Matrix
4.2.4. Asia Pacific Stellar Competition Matrix
4.2.5. South America Stellar Competition Matrix
4.2.6. Middle East and Africa Stellar Competition Matrix
4.3. Key Players Benchmarking
4.3.1. Key Players Benchmarking by Technology, Pricing, Market Share, Investments, Expansion Plans, Physical Presence and Presence in the Market.
4.4. Mergers and Acquisitions in Industry
4.4.1. M&A by Region, Value and Strategic Intent
4.5. Market Dynamics
4.5.1. Market Drivers
4.5.2. Market Restraints
4.5.3. Market Opportunities
4.5.4. Market Challenges
4.5.5. PESTLE Analysis
4.5.6. PORTERS Five Force Analysis
4.5.7. Value Chain Analysis
Chapter 5 Global Membrane Market Segmentation: By Technology
5.1. Global Membrane Market, By Technology, Overview/Analysis, 2023-2030
5.2. Global Membrane Market, By Technology, By Value, Market Share (%), 2023-2030 (USD Billion)
5.3. Global Membrane Market, By Technology, By Value, -
5.3.1. RO/FO
5.3.2. MF
5.3.3. UF
5.3.4. NF
5.3.5. Other
Chapter 6 Global Membrane Market Segmentation: By Application
6.1. Global Membrane Market, By Application, Overview/Analysis, 2023-2030
6.2. Global Membrane Market Size, By Application, By Value, Market Share (%), 2023-2030 (USD Billion)
6.3. Global Membrane Market, By Application, By Value, -
6.3.1. Water & Wastewater Treatment
6.3.2. Food & Beverage
6.3.3. Gas Separation
6.3.4. Others
Chapter 7 Global Membrane Market Segmentation: By Region
7.1. Global Membrane Market, By Region – North America
7.1.1. North America Membrane Market Size, By Technology, By Value, 2023-2030 (USD Billion)
7.1.2. North America Membrane Market Size, By Application, By Value, 2023-2030 (USD Billion)
7.1.3. By Country – U.S.
7.1.3.1. U.S. Membrane Market Size, By Technology, By Value, 2023-2030 (USD Billion)
7.1.3.2. U.S. Membrane Market Size, By Application, By Value, 2023-2030 (USD Billion)
7.1.3.3. Canada Membrane Market Size, By Value, 2023-2030 (USD Billion)
7.1.3.4. Mexico Membrane Market Size, By Value, 2023-2030 (USD Billion)
7.2. Europe Membrane Market Size, By Value, 2023-2030 (USD Billion)
7.2.1. UK
7.2.2. France
7.2.3. Germany
7.2.4. Italy
7.2.5. Spain
7.2.6. Sweden
7.2.7. Austria
7.2.8. Rest of Europe
7.3. Asia Pacific Membrane Market Size, By Value, 2023-2030 (USD Billion)
7.3.1. China
7.3.2. India
7.3.3. Japan
7.3.4. South Korea
7.3.5. Australia
7.3.6. ASEAN
7.3.7. Rest of APAC
7.4. Middle East and Africa Membrane Market Size, By Value, 2023-2030 (USD Billion)
7.4.1. South Africa
7.4.2. GCC
7.4.3. Egypt
7.4.4. Nigeria
7.4.5. Rest of Middle East and Africa
7.5. South America Membrane Market Size, By Value, 2023-2030 (USD Billion)
7.5.1. Brazil
7.5.2. Argentina
7.5.3. Rest of South America
Chapter 8 Company Profiles
8.1. Key Players
8.1.1. Toray Industries Inc. (Japan)
8.1.1.1. Company Overview
8.1.1.2. Technology Portfolio
8.1.1.3. Financial Overview
8.1.1.4. Business Strategy
8.1.1.5. Key Developments
8.1.2. Toray Industries Inc. (Japan)
8.1.3. DuPont (United States)
8.1.4. Suez (France)
8.1.5. Koch Membrane Systems (United States)
8.1.6. Pentair plc (United States)
8.1.7. Toyoba Corporation (Japan)
8.1.8. Hydranautics (United States)
8.1.9. Pall Corporation (United States)
8.1.10. Seccua GmbH (Germany)
8.1.11. Aquatech (United States)
8.1.12. Synder Filtration (United States)
8.1.13. The Merck Group (Germany)
8.1.14. 3M (United States)
8.1.15. Others
8.2. Key Findings
8.3. Recommendations


