Solid Oxide Fuel Cell Market Global Industry Analysis and Forecast (2026-2032) by Type, Tool, Mode of Operation, Application, and Region
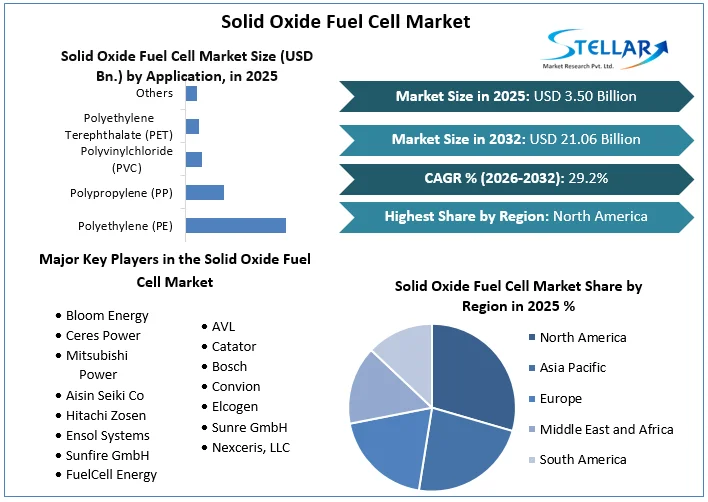
Global Solid Oxide Fuel Cell Market size was valued at US$ 3.50 Billion. in 2025. Solid Oxide Fuel Cell Market is estimated to grow at a CAGR of 29.2% over the forecast period.
Solid Oxide Fuel Cell Market Overview:
A Solid Oxide Fuel Cell (SOFC) is an energy converter that uses electrochemical reactions to generate power. Biogas, natural gas, propane hydrogen, and other oxidized hydrocarbons are among the energy sources used. Solid oxide fuel cell come in a variety of shapes and sizes, including planar and tubular models that are either stationary or portable. They are made up of a ceramic membrane that conducts ions and flows currents at high temperatures, along with non-porous and metal oxide electrolytes that convert chemical energy into thermal and electrical energy without the use of combustion. In comparison to other energy sources, solid oxide fuel cell are both cost-effective and environmentally friendly. Global solid oxide fuel cell market report is prepared on the basis segment analysis as type, application, end-use and region along with the market size forecast.
To get more Insights: Request Free Sample Report
Solid Oxide Fuel Cell Market Dynamics:
The Growing Uses of Solid Oxide Fuel Cell across various Industries:
Noteworthy growth in the power and energy industries across the globe is primarily driving the solid oxide fuel cell market growth. The growing clean energy demands, particularly in developing nations, such as India and China are propelling the market growth. SOFCs are integrated into power systems to provide continuous energy for a variety of commercial and industrial uses. They're also commonly used to run energy-intensive data centers, allowing for better operational performance and data backup in real-time. Other growth-inducing elements include numerous product developments, such as the creation of noiseless and portable SOFCs for military purposes.
Subsidies from the Government and Extended R&D on Fuel Cell Programmes:
The government policies and incentives for fuel cells are driving the solid oxide fuel cell market growth across the globe. For example, Fuel cell programs in California, Delaware, and Connecticut are leading the way, with incentives and subsidies for fuel cell installations, resulting in SOFC and other fuel installations throughout the United States. Prior to December 31, 2016, fuel cells deployed in the United States were eligible for a tax rebate of USD 3000/kW, or 30% of the project cost. California's Self-Generation Incentive Program (SGIP) provides subsidies to generators to stimulate existing, new, and emergent distributed electricity generation. California has set aside USD 566 million for SGIP until 2019, but the program has been extended even longer, with the most recent development being a workshop hosted by the Energy Division on SGIP Renewable Generation.
China, Japan, and South Korea are the leading countries in the Asia Pacific that are promoting the use of fuel cells for a variety of purposes, including utility-scale power generation. The Ministry of Finance, the Ministry of Industry and Information Technology (MIIT), the Ministry of Science and Technology, and the National Development and Reform Commission all announced new energy vehicle subsidies in 2019. In addition, companies like Bloom Energy and its subsidiaries have been collaborating with the South Korean government to build utility-scale SOFC power facilities. Two utility-scale power plants with capacities of 19.8 MW and 8.1 MW will be built in two cities during the forecast period.
Growing Adoption by End Users in Data Centres and Military Sector
Data centers are the fastest-growing end consumers of power generation applications. A data center requires a lot of energy and uses a lot of it. In addition, data centers require continuous electricity 24 hours a day, seven days a week to avoid data loss. Data centers are opting for cost savings by using distributed power production, notably fuel cells, due to high power usage. The adoption of SOFCs for data centers by Google, IBM, and Equinix has sped up growth in the solid oxide fuel cell market. Data center SOFC adoption is currently minuscule in comparison to the total number of data centers across the globe, making it one of the most attractive end-use segments for SOFC.
SOFC-based fixed and portable power production is becoming more popular in the military. In addition, the demand for inaudible and proficient power production in military applications opens up a market for SOFC in this industry. With additional chances for the market's growth, innovations in SOFC portable applications for military applications are expected to accelerate.
|
Solid Oxide Fuel Cell Key Technologies |
|
|
Cell Development
|
R&D on individual cell component
|
|
Core Technology
|
R&D on individual Cell Component
|
|
System Development
|
System Integration
|
High Investment Costs required for Solid Oxide Fuel Cell:
SOFCs are a complicated combination of chemical ingredients used to create electricity by electro-catalytically oxidizing methane, LP gas, and other natural gas-based fuels. SOFCs typically run at very high temperatures, ranging from 700°C to 1,200°C, as the main chemical process involves an exothermic reaction. At such temperatures, conventional ceramic electrolytes are ineffective, necessitating the use of yttria-stabilized zirconia (YSZ) as an electrolyte. As a result, these factors increase fuel cell manufacturing and installation costs, which is expected to hamper the solid oxide fuel cell market growth throughout the forecast period.
Solid Oxide Fuel Cell Market Segment Analysis:
By Type, the Solid Oxide Fuel Cell Market is segmented into Planar, Tubular, and Others. The Planar segment has dominated the market with a 46% share in 2025. The basic geometry and relatively simple fabrication procedure drive the market for planar segments. The electrolyte is introduced between the electrodes in planar solid oxide fuel cells. Ceramic fuel cell modules are layered one above the other in a sandwich-type construction with the electrolyte inserted between the electrodes. It is the most often used solid oxide fuel cell type due to its comparatively easy manufacturing.

By End-Use, the Solid Oxide Fuel Cell Market is segmented into Data Centers, Commercial & Retail, and APU. Data Power has dominated the market with a 40.8% share in 2025. Because of their high efficiency, large capacity, and continuous power generation capability, solid oxide fuel cells are the most recommended solution for power backup and voltage variations. The market is also expected to be driven by increased demand for continuous power supply.
Solid Oxide Fuel Cell Market Regional Insights:
The North American dominated the solid oxide fuel cell market with a 42.1% share in 2025. The region's product demand is being driven by strong demand for fuel cell power generation, as well as increased research and development for hydrogen generation. The market in the United States has developed at a rapid rate and is expanding significantly faster than the rest of the world, thanks to strong government support and strategic market emphasis. For example, the
US Department of Energy (DOE) stated in September 2020 that it will provide the US $ 34 million to design and build small-scale SOFC systems.
The Asia Pacific solid oxide fuel cell market is expected to witness significant growth at a CAGR of 8.96% during the forecast period. Governments across the region are largely focused on utilizing renewable energy, and as a result, utility-scale SOFC power facilities are being used. The key countries in the Asia Pacific encouraging the use of fuel cells for a variety of uses, including utility-scale power generation, are China, Japan, India, and South Korea.
The objective of the report is to present a comprehensive analysis of the Global Solid Oxide Fuel Cell Market to the stakeholders in the industry. The report provides trends that are most dominant in the Global Solid Oxide Fuel Cell Market and how these trends will influence new business investments and market development throughout the forecast period. The report also aids in the comprehension of the Global Solid Oxide Fuel Cell Market dynamics and competitive structure of the market by analyzing market leaders, market followers, and regional players.
The qualitative and quantitative data provided in the Global Solid Oxide Fuel Cell Market report is to help understand which market segments, regions are expected to grow at higher rates, factors affecting the market, and key opportunity areas, which will drive the industry and market growth through the forecast period. The report also includes the competitive landscape of key players in the industry along with their recent developments in the Global Solid Oxide Fuel Cell Market. The report studies factors such as company size, market share, market growth, revenue, production volume, and profits of the key players in the global market.
The report provides Porter's Five Force Model, which helps in designing the business strategies in the market. The report helps in identifying how many rivals are existing, who they are, and how their product quality is in the Global Solid Oxide Fuel Cell Market. The report also analyses if the Global Solid Oxide Fuel Cell Market is easy for a new player to gain a foothold in the market, do they enter or exit the market regularly if the market is dominated by a few players, etc.
The report also includes a PESTEL Analysis, which aids in the development of company strategies. Political variables help in figuring out how much a government can influence the Global Solid Oxide Fuel Cell Market. Economic variables aid in the analysis of economic performance drivers that have an impact on the global market. Understanding the impact of the surrounding environment and the influence of environmental concerns on the Global Solid Oxide Fuel Cell Market is aided by legal factors.
Solid Oxide Fuel Cell Market Scope:
|
Solid Oxide Fuel Cell Market |
|
|
Market Size in 2025 |
USD 3.50 Billion |
|
Market Size in 2032 |
USD 21.06 Billion |
|
CAGR (2025-2032) |
29.2% |
|
Historic Data |
2020-2025 |
|
Base Year |
2025 |
|
Forecast Period |
2026-2032 |
|
Segment Scope |
by Type
|
|
by Application
|
|
|
by End-Use
|
|
|
Regional Scope |
North America- United States, Canada, and Mexico Europe – UK, France, Germany, Italy, Spain, Sweden, Austria, and Rest of Europe Asia Pacific – China, India, Japan, South Korea, Australia, ASEAN, Rest of APAC Middle East and Africa - South Africa, GCC, Egypt, Nigeria, Rest of the Middle East and Africa South America – Brazil, Argentina, Rest of South America |
Solid Oxide Fuel Cell Market Key Players:
- Bloom Energy
- Ceres Power
- Mitsubishi Power
- Aisin Seiki Co
- Hitachi Zosen
- Ensol Systems
- Sunfire GmbH
- FuelCell Energy
- AVL
- Catator
- Bosch
- Convion
- Elcogen
- Sunre GmbH
- Nexceris, LLC
Frequently Asked Questions
The North America is expected to hold the highest share in the Solid Oxide Fuel Cell Market.
The market size of the Solid Oxide Fuel Cell Market by 2032 is expected to reach at US$ 21.06 Billion
The forecast period for the Solid Oxide Fuel Cell Market is 2026-2032.
The market size of the Solid Oxide Fuel Cell Market in 2025 was valued at US$ 3.50 Billion
1. Solid Oxide Fuel Cell Market Introduction
1.1. Study Assumption and Market Definition
1.2. Scope of the Study
1.3. Executive Summary
2. Global Solid Oxide Fuel Cell Market: Competitive Landscape
2.1. SMR Competition Matrix
2.2. Competitive Landscape
2.3. Key Players Benchmarking
2.3.1. Company Name
2.3.2. Product Segment
2.3.3. End-user Segment
2.3.4. Revenue (2025)
2.3.5. Company Locations
2.4. Market Structure
2.4.1. Market Leaders
2.4.2. Market Followers
2.4.3. Emerging Players
2.5. Mergers and Acquisitions Details
3. Solid Oxide Fuel Cell Market: Dynamics
3.1. Solid Oxide Fuel Cell Market Trends by Region
3.1.1. North America
3.1.2. Europe
3.1.3. Asia Pacific
3.1.4. Middle East and Africa
3.1.5. South America
3.2. Solid Oxide Fuel Cell Market Dynamics
3.2.1. Solid Oxide Fuel Cell Market Drivers
3.2.2. Solid Oxide Fuel Cell Market Restraints
3.2.3. Solid Oxide Fuel Cell Market Opportunities
3.2.4. Solid Oxide Fuel Cell Market Challenges
3.3. PORTER’s Five Forces Analysis
3.4. PESTLE Analysis
3.5. Technological Roadmap
3.6. Value Chain Analysis and Supply Chain Analysis
3.7. Regulatory Landscape
3.8. Key Opinion Leaders Analysis for the Solid Oxide Fuel Cell Industry
4. Solid Oxide Fuel Cell Market: Global Market Size and Forecast by Segmentation (by Value in USD Mn and Volume Units) (2025-2032)
4.1. Solid Oxide Fuel Cell Market Size and Forecast, by Type (2025-2032)
4.1.1. Planar
4.1.2. Tubular
4.1.3. Others
4.2. Solid Oxide Fuel Cell Market Size and Forecast, by Application (2025-2032)
4.2.1. Polyethylene (PE)
4.2.2. Polypropylene (PP)
4.2.3. Polyvinylchloride (PVC)
4.2.4. Polyethylene Terephthalate (PET)
4.2.5. Others
4.3. Solid Oxide Fuel Cell Market Size and Forecast, by End-Use (2025-2032)
4.3.1. Data Centers
4.3.2. Commercial & Retail
4.3.3. APU
4.4. Solid Oxide Fuel Cell Market Size and Forecast, by Region (2025-2032)
4.4.1. North America
4.4.2. Europe
4.4.3. Asia Pacific
4.4.4. Middle East and Africa
4.4.5. South America
5. North America Solid Oxide Fuel Cell Market Size and Forecast by Segmentation (by Value in USD Mn and Volume Units) (2025-2032)
5.1. North America Solid Oxide Fuel Cell Market Size and Forecast, by Type (2025-2032)
5.1.1. Planar
5.1.2. Tubular
5.1.3. Others
5.2. North America Solid Oxide Fuel Cell Market Size and Forecast, by Application (2025-2032)
5.2.1. Polyethylene (PE)
5.2.2. Polypropylene (PP)
5.2.3. Polyvinylchloride (PVC)
5.2.4. Polyethylene Terephthalate (PET)
5.2.5. Others
5.3. North America Solid Oxide Fuel Cell Market Size and Forecast, by End-Use (2025-2032)
5.3.1. Data Centers
5.3.2. Commercial & Retail
5.3.3. APU
5.4. North America Solid Oxide Fuel Cell Market Size and Forecast, by Country (2025-2032)
5.4.1. United States
5.4.2. Canada
5.4.3. Mexico
6. Europe Solid Oxide Fuel Cell Market Size and Forecast by Segmentation (by Value in USD Mn and Volume Units) (2025-2032)
6.1. Europe Solid Oxide Fuel Cell Market Size and Forecast, by Type (2025-2032)
6.2. Europe Solid Oxide Fuel Cell Market Size and Forecast, by Application (2025-2032)
6.3. Europe Solid Oxide Fuel Cell Market Size and Forecast, by End-Use (2025-2032)
6.4. Europe Solid Oxide Fuel Cell Market Size and Forecast, by Country (2025-2032)
6.4.1. United Kingdom
6.4.2. France
6.4.3. Germany
6.4.4. Italy
6.4.5. Spain
6.4.6. Sweden
6.4.7. Austria
6.4.8. Rest of Europe
7. Asia Pacific Solid Oxide Fuel Cell Market Size and Forecast by Segmentation (by Value in USD Mn and Volume Units) (2025-2032)
7.1. Asia Pacific Solid Oxide Fuel Cell Market Size and Forecast, by Type (2025-2032)
7.2. Asia Pacific Solid Oxide Fuel Cell Market Size and Forecast, by Application (2025-2032)
7.3. Asia Pacific Solid Oxide Fuel Cell Market Size and Forecast, by End-Use (2025-2032)
7.4. Asia Pacific Solid Oxide Fuel Cell Market Size and Forecast, by Country (2025-2032)
7.4.1. China
7.4.2. S Korea
7.4.3. Japan
7.4.4. India
7.4.5. Australia
7.4.6. Indonesia
7.4.7. Malaysia
7.4.8. Vietnam
7.4.9. Taiwan
7.4.10. Rest of Asia Pacific
8. Middle East and Africa Solid Oxide Fuel Cell Market Size and Forecast by Segmentation (by Value in USD Mn and Volume Units) (2025-2032)
8.1. Middle East and Africa Solid Oxide Fuel Cell Market Size and Forecast, by Type (2025-2032)
8.2. Middle East and Africa Solid Oxide Fuel Cell Market Size and Forecast, by Application (2025-2032)
8.3. Middle East and Africa Solid Oxide Fuel Cell Market Size and Forecast, by End-Use (2025-2032)
8.4. Middle East and Africa Solid Oxide Fuel Cell Market Size and Forecast, by Country (2025-2032)
8.4.1. South Africa
8.4.2. GCC
8.4.3. Nigeria
8.4.4. Rest of ME&A
9. South America Solid Oxide Fuel Cell Market Size and Forecast by Segmentation (by Value in USD Mn and Volume Units) (2025-2032)
9.1. South America Solid Oxide Fuel Cell Market Size and Forecast, by Type (2025-2032)
9.2. South America Solid Oxide Fuel Cell Market Size and Forecast, by Application (2025-2032)
9.3. South America Solid Oxide Fuel Cell Market Size and Forecast, by End-Use (2025-2032)
9.4. South America Solid Oxide Fuel Cell Market Size and Forecast, by Country (2025-2032)
9.4.1. Brazil
9.4.2. Argentina
9.4.3. Rest Of South America
10. Company Profile: Key Players
10.1. Bloom Energy
10.1.1. Company Overview
10.1.2. Business Portfolio
10.1.3. Financial Overview
10.1.4. SWOT Analysis
10.1.5. Strategic Analysis
10.1.6. Recent Developments
10.2. Ceres Power
10.3. Mitsubishi Power
10.4. Aisin Seiki Co
10.5. Hitachi Zosen
10.6. Ensol Systems
10.7. Sunfire GmbH
10.8. FuelCell Energy
10.9. AVL
10.10. Catator
10.11. Bosch
10.12. Convion
10.13. Elcogen
10.14. Sunre GmbH
10.15. Nexceris, LLC
11. Key Findings
12. Industry Recommendations
13. Solid Oxide Fuel Cell Market: Research Methodology