Power Electronics Market Global Industry Overview (2026-2032) by Offering, Material, Voltage, Vertical, and, Region
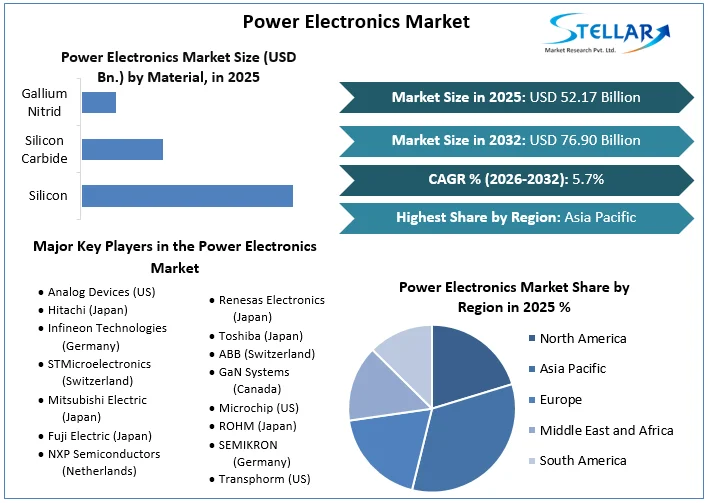
Power Electronics Market size was valued at US$ 52.17 Billion in 2025 and the total Power Electronics revenue is expected to grow at 5.7% through 2026 to 2032, reaching nearly US$ 76.90 Billion.
Power Electronics Market Overview:
Power electronics is a discipline of electronics engineering concerned with the processing of high voltages and currents to supply power for a range of applications. From domestic electronics to space-related equipment, all of these regions require consistent and dependable electric power that meets the required criteria. Power is converted from one form to another by power switches and regulatory systems, resulting in properly regulated power.
Power electronicsdevices are used in a wide array of applications, including power drive controllers, propellers, and protective assistance systems, fuel monitoring and control, air traffic control, guidance, interior illumination, navigation, and telecommunications. Signal processing for the modern radar system, aircraft, defense systems, unmanned aircraft vehicle systems, and missile controllers, for example, need for computing power that generates a lot of heat. Power electronics that are efficient assist to minimize heat and boost efficiency.
The market's growth drivers, as well as the market's segments (Offering, Material, Voltage, Vertical, and, Region), are analyzed in this research. Market participants, regions, and special requirements have all provided data. This market study provides an in-depth look at all of the important advancements that are currently taking place across all industry sectors. Statistics, infographics, and presentations are used to provide key data analysis. The analysis looks at the market's Drivers, Restraints, Opportunities, and Challenges for the Power Electronics market. The study aids in the evaluation of market growth drivers and the determination of how to employ these drivers as a tool. The research also aids in the correction and resolution of difficulties with the global Power Electronics market.
To get more Insights: Request Free Sample Report
Power Electronics Market Dynamics:
The developments in the electric vehicles industry are one of the major drivers of the power electronics market. Power electronics devices are used in multiple elements of contemporary automobiles, including the starter motor, windscreen wiper controller, adjustable front illumination, luminaires, and power transmission steering. Power electronics devices are predicted to play an important role in energy conservation in electric vehicles as the number of electric vehicles and hybrid electric vehicles grows. Vehicle power systems largely process and manage the energy flow in hybrid and plug-in electric cars, as well as the speed-torque generated by the motor.
The power electronics market key players are working on combining several functionalities in a single chip, resulting in a complicated design. Furthermore, developing and incorporating sophisticated devices necessitates specialized expertise, a solid approach, and a specific toolset, all of which raise the total price of the devices. As a result, the increased cost of the gadgets is projected to stymie the transition to the latest computing equipment. However, because of the many capabilities, mechanisms, and voltages, merging several Integrated circuits into a single device is a challenging operation that is likely to impede the growth of the power electronics market over the forecast period.
Increased demand for tiny and portable gadgets presents a substantial opportunity; yet, one important challenge for producers is meeting clients' forever changing demand for increasingly lightweight devices. Parts and subsystems must be downsized to reduce the cost of production in order to meet the need for tiny, accessible, and multipurpose products. Businesses are continuously spending in research and development to innovate goods and improve their brand choices in order to remain relevant in the industry. Since a result of the unpredictability linked with the life span of existing technologies or goods, constant drive for more compressed devices might be an obstacle, because it does not warrant the ROI.
Power Electronics Market Segment Analysis:
By Vertical, the consumer electronics segment held the largest market share in 2025. It is expected to witness a CAGR of 6.7% in the aforementioned forecast period.
The increasing usage of household gadgets like smartphones, laptops, and wearable electronics, particularly in emerging nations, is likely to fuel the demand for power electronics. The growing use of power electronics in domestic appliances is also predicted to add to the segment's growth in the power electronics market. Original Equipment Manufacturers located in China and South Korea, including e.g. Samsung, and Huawei, are utilizing Gallium Nitride power electronics products for high wattage internal adapters for handsets as well as supplementary fast chargers.

During the projection period, the most significant impact is expected to be seen by the internationally incorporated automobile industry. Facility shutdown, distribution network interruptions, and a lack of user trust have all hampered the efficiency of power electronics in the automobile sector. The consumer electronics business has also been impacted by the downturn in electronics output caused by the automobile industry's breakdown.
The 5G standard, which is now being implemented, offers transformative breakthroughs in connection and communications. However, it places substantially higher strain on the power electronics equipment that powers it. As the number of ground stations built for 5G grows, higher power efficiency will be necessary. The new frequencies may potentially cause issues with battery performance. This is stimulating market demand and necessitating the development of innovative approaches that lower power utilization while increasing performance.
Power Electronics Market Regional Insights:
At the end of the projected period, Asia Pacific is expected to lead the power electronics market. It is expected to witness a CAGR of 6.5% in the same forecast period. The prevalence of electronics products, commercial, and automobile sectors in Japan, and South Korea is linked to the market's success in the Asia Pacific region. The growing necessity of power generation, as well as regulatory measures in many nations to develop sustainable energy architecture, are supporting the market growth.
The booming population in emerging nations e.g. India, which is resulting in the greater implementation of telecommunications infrastructure, is likely to drive advancement in the power electronics industry. The existence of numerous well-known power electronics companies, e.g. Mitsubishi Electric and Toshiba, adds to the growth of the local market. Prominent Chinese businesses e.g. BYD, Huawei, CRRC, are assisting China in growing its indigenous power electronics sector. These aspects are expected to contribute significantly to the progress of the Asia Pacific power electronics industry.
The purpose of this research is to provide stakeholders in the industry with a thorough insight into the Power Electronics Market. The study includes an analysis of difficult data in simple language, as well as the industry's historical and current state, as well as anticipated market size and trends. The market report examines all segments of the industry, with a focus on significant players such as market leaders, followers, and new entrants. The report includes a PORTER, PESTEL analysis as well as the possible influence of microeconomic market determinants. External and internal elements that are expected to have a favorable or negative impact on the firm have been examined, providing decision-makers with a clear future vision of the industry. The research also aids in comprehending the Power Electronics Market dynamics and structure by studying market segments and forecasting market size. The research is an investor's guide since it depicts the competitive analysis of major competitors in the Power Electronics Market by product, price, financial situation, product portfolio, growth plans, and geographical presence.
Power Electronics Market Scope:
|
Power Electronics Market |
|
|
Market Size in 2025 |
USD 52.17 Bn. |
|
Market Size in 2032 |
USD 76.90 Bn. |
|
CAGR (2026-2032) |
5.7% |
|
Historic Data |
2020-2025 |
|
Base Year |
2025 |
|
Forecast Period |
2026-2032 |
|
Segment Scope |
by Offering
|
|
by Material
|
|
|
by Voltage
|
|
|
by Vertical
|
|
|
Regional Scope |
North America- United States, Canada, and Mexico Europe – UK, France, Germany, Italy, Spain, Sweden, Austria, and Rest of Europe Asia Pacific – China, India, Japan, South Korea, Australia, ASEAN, Rest of APAC Middle East and Africa - South Africa, GCC, Egypt, Nigeria, Rest of the Middle East and Africa South America – Brazil, Argentina, Rest of South America |
Power Electronics Market Players:
- Analog Devices (US)
- Hitachi (Japan)
- Infineon Technologies (Germany)
- STMicroelectronics (Switzerland)
- Mitsubishi Electric (Japan)
- Fuji Electric (Japan)
- NXP Semiconductors (Netherlands)
- Renesas Electronics (Japan)
- Toshiba (Japan)
- ABB (Switzerland)
- GaN Systems (Canada)
- Microchip (US)
- ROHM (Japan)
- SEMIKRON (Germany)
- Transphorm (US)
Frequently Asked Questions
The developments in the electric vehicles industry are one of the major drivers of the market.
The key players are ABB, Toshiba, etc.
consumer electronics segment is expected to witness a CAGR of 6.7% in the aforementioned forecast period.
1. Research Methodology
1.1 Research Data
1.1.1. Primary Data
1.1.2. Secondary Data
1.2. Market Size Estimation
1.2.1. Bottom-Up Approach
1.2.2. Top-Up Approach
1.3. Market Breakdown and Data Triangulation
1.4. Research Assumption
2. Power Electronics Market Executive Summary
2.1. Market Overview
2.2. Market Size (2025) and Forecast (2026 – 2032) and Y-O-Y%
2.3. Market Size (USD) and Market Share (%) – By Segments and Regions
3. Global Power Electronics Market: Competitive Landscape
3.1. SMR Competition Matrix
3.2. Key Players Benchmarking
3.2.1. Company Name
3.2.2. Headquarter
3.2.3. Product Segment
3.2.4. End-user Segment
3.2.5. Y-O-Y%
3.2.6. Revenue (2025)
3.2.7. Profit Magin
3.2.8. Market Share
3.2.9. Company Locations
3.3. Market Structure
3.3.1. Market Leaders
3.3.2. Market Followers
3.3.3. Emerging Players
3.4. Consolidation of the Market
3.4.1. Strategic Initiatives and Developments
3.4.2. Mergers and Acquisitions
3.4.3. Collaborations and Partnerships
3.4.4. Product Launches and Innovations
3.5. Power Electronics Industry Ecosystem
3.5.1. Ecosystem Analysis
3.5.2. Role of the Companies in the Ecosystem
4. Power Electronics Market: Dynamics
4.1. Power Electronics Market Trends by Region
4.1.1. North America
4.1.2. Europe
4.1.3. Asia Pacific
4.1.4. Middle East and Africa
4.1.5. South America
4.2. Power Electronics Market Drivers
4.3. Power Electronics Market Restraints
4.4. Power Electronics Market Opportunities
4.5. Power Electronics Market Challenges
4.6. PORTER’s Five Forces Analysis
4.6.1. Intensity of the Rivalry
4.6.2. Threat of New Entrants
4.6.3. Bargaining Power of Suppliers
4.6.4. Bargaining Power of Buyers
4.6.5. Threat of Substitutes
4.7. PESTLE Analysis
4.7.1. Political Factors
4.7.2. Economic Factors
4.7.3. Social Factors
4.7.4. Legal Factors
4.7.5. Environmental Factors
4.8. Technological Analysis
4.8.1. 300 MM Wafers
4.8.2. SIC and GAN Materials
4.8.3. Technological Roadmap
4.9. Value Chain Analysis and Supply Chain Analysis
4.10. Regulatory Landscape
4.10.1. Market Regulation by Region
4.10.1.1. North America
4.10.1.2. Europe
4.10.1.3. Asia Pacific
4.10.1.4. Middle East and Africa
4.10.1.5. South America
4.10.2. Impact of Regulations on Market Dynamics
5. Power Electronics Market: Global Market Size and Forecast by Segmentation (by Value in USD Million) (2025-2032)
5.1. Power Electronics Market Size and Forecast, by Offering (2025-2032)
5.1.1. Power Discrete
5.1.2. Power Module
5.1.3. Power IC
5.2. Power Electronics Market Size and Forecast, by Material (2025-2032)
5.2.1. Silicon
5.2.2. Silicon Carbide
5.2.3. Gallium Nitride
5.3. Power Electronics Market Size and Forecast, by Voltage (2025-2032)
5.3.1. Low Voltage
5.3.2. Medium Voltage
5.3.3. High Voltage
5.4. Power Electronics Market Size and Forecast, by Vertical (2025-2032)
5.4.1. Consumer Electronics
5.4.2. Industrial
5.4.3. Automotive & Transportation
5.4.4. ICT
5.4.5. Aerospace & Defense
5.4.6. Other
5.5. Power Electronics Market Size and Forecast, by Region (2025-2032)
5.5.1. North America
5.5.2. Europe
5.5.3. Asia Pacific
5.5.4. Middle East and Africa
5.5.5. South America
6. North America Power Electronics Market Size and Forecast by Segmentation (by Value in USD Million) (2025-2032)
6.1. North America Power Electronics Market Size and Forecast, by Offering (2025-2032)
6.1.1. Power Discrete
6.1.2. Power Module
6.1.3. Power IC
6.2. North America Power Electronics Market Size and Forecast, by Material (2025-2032)
6.2.1. Silicon
6.2.2. Silicon Carbide
6.2.3. Gallium Nitride
6.3. North America Power Electronics Market Size and Forecast, by Voltage (2025-2032)
6.3.1. Low Voltage
6.3.2. Medium Voltage
6.3.3. High Voltage
6.4. North America Power Electronics Market Size and Forecast, by Vertical (2025-2032)
6.4.1. Consumer Electronics
6.4.2. Industrial
6.4.3. Automotive & Transportation
6.4.4. ICT
6.4.5. Aerospace & Defense
6.4.6. Other
6.5. North America Power Electronics Market Size and Forecast, by Country (2025-2032)
6.5.1. United States
6.5.2. Canada
6.5.3. Mexico
7. Europe Power Electronics Market Size and Forecast by Segmentation (by Value in USD Million) (2025-2032)
7.1. Europe Power Electronics Market Size and Forecast, by Offering (2025-2032)
7.2. Europe Power Electronics Market Size and Forecast, by Material (2025-2032)
7.3. Europe Power Electronics Market Size and Forecast, by Voltage (2025-2032)
7.4. Europe Power Electronics Market Size and Forecast, by Vertical (2025-2032)
7.5. Europe Power Electronics Market Size and Forecast, by Country (2025-2032)
7.5.1. United Kingdom
7.5.2. France
7.5.3. Germany
7.5.4. Italy
7.5.5. Spain
7.5.6. Sweden
7.5.7. Austria
7.5.8. Rest of Europe
8. Asia Pacific Power Electronics Market Size and Forecast by Segmentation (by Value in USD Million) (2025-2032)
8.1. Asia Pacific Power Electronics Market Size and Forecast, by Offering (2025-2032)
8.2. Asia Pacific Power Electronics Market Size and Forecast, by Material (2025-2032)
8.3. Asia Pacific Power Electronics Market Size and Forecast, by Voltage (2025-2032)
8.4. Asia Pacific Power Electronics Market Size and Forecast, by Vertical (2025-2032)
8.5. Asia Pacific Power Electronics Market Size and Forecast, by Country (2025-2032)
8.5.1. China
8.5.2. S Korea
8.5.3. Japan
8.5.4. India
8.5.5. Australia
8.5.6. Indonesia
8.5.7. Malaysia
8.5.8. Vietnam
8.5.9. Taiwan
8.5.10. Rest of Asia Pacific
9. Middle East and Africa Power Electronics Market Size and Forecast by Segmentation (by Value in USD Million) (2025-2032)
9.1. Middle East and Africa Power Electronics Market Size and Forecast, by Offering (2025-2032)
9.2. Middle East and Africa Power Electronics Market Size and Forecast, by Material (2025-2032)
9.3. Middle East and Africa Power Electronics Market Size and Forecast, by Voltage (2025-2032)
9.4. Middle East and Africa Power Electronics Market Size and Forecast, by Vertical (2025-2032)
9.5. Middle East and Africa Power Electronics Market Size and Forecast, by Country (2025-2032)
9.5.1. South Africa
9.5.2. GCC
9.5.3. Nigeria
9.5.4. Rest of ME&A
10. South America Power Electronics Market Size and Forecast by Segmentation (by Value in USD Million) (2025-2032)
10.1. South America Power Electronics Market Size and Forecast, by Offering (2025-2032)
10.2. South America Power Electronics Market Size and Forecast, by Material (2025-2032)
10.3. South America Power Electronics Market Size and Forecast, by Voltage (2025-2032)
10.4. South America Power Electronics Market Size and Forecast, by Vertical (2025-2032)
10.5. South America Power Electronics Market Size and Forecast, by Country (2025-2032)
10.5.1. Brazil
10.5.2. Argentina
10.5.3. Rest Of South America
11. Company Profile: Key Players
11.1. Analog Devices (US)
11.1.1. Company Overview
11.1.2. Business Portfolio
11.1.2.1. Product Name
11.1.2.2. Product Details (Price, Features, etc)
11.1.3. Financial Overview
11.1.3.1. Total Revenue
11.1.3.2. Segment Revenue
11.1.3.3. Regional Revenue
11.1.4. SWOT Analysis
11.1.5. Strategic Analysis
11.1.6. Recent Developments
11.2. Hitachi (Japan)
11.3. Infineon Technologies (Germany)
11.4. STMicroelectronics (Switzerland)
11.5. Mitsubishi Electric (Japan)
11.6. Fuji Electric (Japan)
11.7. NXP Semiconductors (Netherlands)
11.8. Renesas Electronics (Japan)
11.9. Toshiba (Japan)
11.10. ABB (Switzerland)
11.11. GaN Systems (Canada)
11.12. Microchip (US)
11.13. ROHM (Japan)
11.14. SEMIKRON (Germany)
11.15. Transphorm (US)
12. Key Findings
13. Analyst Recommendations
13.1. Strategic Recommendations
13.2. Future Outlook