Surveillance Radars Market Global Industry Analysis, Size, Share, Growth, Trend, and Forecast (2026-2032)
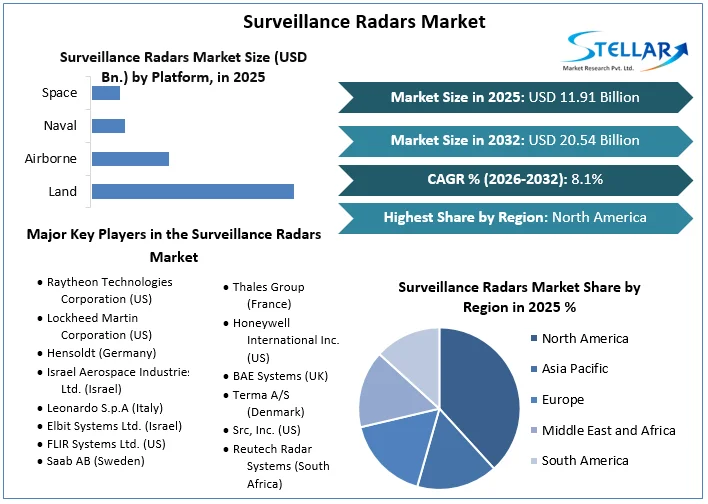
The Surveillance Radars Market size was valued at US$ 11.91 Bn. in 2025. The global Surveillance Radars Market is estimated to grow at a CAGR of 8.1 % over the forecast period.
Surveillance Radars Market Overview:
Surveillance Radars are used to keep an eye on various activities at important infrastructure and facilities like airports, camps, borders, and harbours. For national security purposes, these radars are used to detect and track non-linear and non-cooperative targets, as well as moving targets. It is employed to enhance perimeter security in both the commercial and defense sectors. These radar systems are capable of working on land, sea, air, and space platforms. Surveillance radars are an integral aspect of the defense sector's border security operations. The majority of surveillance radars operate in the S-Band frequency band. These systems are mostly used for searching and targeting purposes. Surveillance radars market report is come up with the PESTLE analysis, PORTER's analysis and segment analysis on the basis of radar type, platform, component, application and region.
Surveillance radars can also be used for airspace and maritime security applications to screen a variety of targets such as planes, ultralights, ramblers, unmanned aerial vehicles (UAV), unmanned aerial systems (UAS), helicopters, boats, and ships. As a result, the surveillance radar is a huge help to military and defense forces while they are on a tactical operation in unknown territory, as it works as their eyes.
To get more Insights: Request Free Sample Report
Surveillance Radars Market Dynamics:
Advanced Technology in Surveillance Radars:
Border surveillance systems have advanced over time and continue to do so, with the deployment of autonomous drones and acoustic radar technologies being two recent examples. Various countries have been able to secure their borders more efficiently because of man-portable ground surveillance radars. To improve detection rates, these monitoring radars are stationed in strategic areas.
Surveillance radars that are state-of-the-art and have low false alarm rates have encouraged countries with border conflicts, drug trafficking issues, and illegal immigration to rely on these modern radars to help safeguard their borders. For example, the US government has spent US$ 0.100 billion in 2019, to fund the installation of border surveillance systems on its northern border, such as permanent towers, remote video surveillance systems, and mobile surveillance systems.
Growing Investments in Advanced Surveillance Radars Technologies:
Defense forces are increasingly demanding technologically superior fighting equipment. Governments across the globe are concentrating their efforts on the development of stealth aircraft while also investing considerably in improved surveillance systems to counter stealth technology. Many developing countries are concentrating their efforts on improving their defense capabilities. For example, India said in 2019 that it would invest US$ 130 billion over the next 5-7 years to upgrade its armed forces and improve combat capabilities. Radar systems, air defense systems, drones, warships, submarines, missiles, and other items are all part of the plan, which is expected to boost the surveillance radars market growth.
Growing Demand for Radar-based Systems in Defence Industry:
Next-generation combat aircraft's capacity to provide high tactical capabilities during wartime has spurred demand from countries like the United States, China, and India. Concerns about the border and shoreline security have fueled the demand for UAVs outfitted with surveillance radars.
Increased demand for military aircraft fleet modernization initiatives has resulted in a surge in new aircraft orders, which is expected to fuel market growth. Similarly, rising military spending on fighter jets equipped with advanced radar technology in order to improve defence capabilities is expected to propel the surveillance radars market forward over the forecast period.
Modernization of Conventional Military Equipment:
As warfare and battlefield management have changed, there has been a greater necessity for conventional military equipment to be modernised. To keep up with technological improvements in fighting, modernization is essential. As a result, demand for upgrades is expected to propel the surveillance radars market forward. Modernization also attempts to improve technology and create dependable, cost-effective solutions.
The number of contracts between major defense corporations and the US government to upgrade military systems like tactical radar systems, moveable tactics, light weapons, modern military antennas, and other systems has increased. Furthermore, the use of modern surveillance radars technology by armed forces has increased. As a result, the surveillance radars market is expected to rise rapidly over the forecast period.
Surveillance Radars Market Segment Analysis:
By Component, the Surveillance Radars Market is segmented into Antennas, Transmitters, Duplexers, Digital Signal Processor, Power Amplifiers, Receivers, Signal Processors, Cameras, and Others. The Digital Signal Processor segment dominated the market with a 29% share in 2025. By doing signal processing, the digital signal processor works like a computer that performs all command and control operations. Previously, systems relied on analog signal processing. High-end processors, such as Field Programmable Gate Array (FPGA), Graphics Processing Unit (GPU), and general-purpose processors, are used in the latest digital signal processing.
By Radar Type, the Surveillance Radars Market is segmented into Short Range Surveillance Radar, Medium-Range Surveillance Radar, and Long-Range Surveillance Radar. The Short Range Surveillance segment dominated the market with a 41% share in 2025. The growing use of short range surveillance radar in commercial and military ground-based applications is primarily driving the segment growth. The Long Range Surveillance segment is expected to witness a significant growth rate at a CAGR of 53.8% during the forecast period. The segment growth is attributed to the growing demand for over-the-horizon (OTH) radars that are used to detect targets from a long distance.
Surveillance Radars Market Regional Insights:
The North American region has dominated the surveillance radars market with a 38 % share in 2025. The presence of significant military firms like Raytheon Technologies, Northrop Grumman Corporation, and Lockheed Martin Corporation in the region, is expected to dominate the market over the forecast period. Leading military aircraft manufacturers, like the Boeing Company and Bombardier Inc., are also contributing to the market's growth in the region.
The Asia Pacific surveillance radars market is expected to witness a significant growth rate at a CAGR of 7.6% during the forecast period. Due to increased defense spending on military land and naval-based systems, Asia-Pacific is likely to be the fastest-growing region. In addition, increased passenger traffic from emerging economies such as China and India is expected to drive market growth, as surveillance radars play a significant role in air traffic control. To acquire better surveillance capabilities, countries are investing in the development and procurement of indigenous radar systems. For example, China has produced a sophisticated small-size marine surveillance radar with a long-range in 2019. The new radar has allowed surveillance and monitoring of the whole country's maritime region, compared to only 20% with traditional radars, increasing the country's information-gathering capabilities in the South China Sea, Indian Ocean, and the Pacific Ocean.
The objective of the report is to present a comprehensive analysis of the Global Surveillance Radars Market to the stakeholders in the industry. The report provides trends that are most dominant in the Global Surveillance Radars Market and how these trends will influence new business investments and market development throughout the forecast period. The report also aids in the comprehension of the global market dynamics and competitive structure of the market by analyzing market leaders, market followers, and regional players.
The qualitative and quantitative data provided in the Global Surveillance Radars Market report is to help understand which market segments, regions are expected to grow at higher rates, factors affecting the market, and key opportunity areas, which will drive the industry and market growth through the forecast period. The report also includes the competitive landscape of key players in the industry along with their recent developments in the Global Surveillance Radars Market. The report studies factors such as company size, market share, market growth, revenue, production volume, and profits of the key players in the global market.
The report provides Porter's Five Force Model, which helps in designing the business strategies in the market. The report helps in identifying how many rivals are existing, who they are, and how their product quality is in the Global Surveillance Radars Market. The report also analyses if the Global Surveillance Radars Market is easy for a new player to gain a foothold in the market, do they enter or exit the market regularly if the market is dominated by a few players, etc.
The report also includes a PESTEL Analysis, which aids in the development of company strategies. Political variables help in figuring out how much a government can influence the Global Surveillance Radars Market. Economic variables aid in the analysis of economic performance drivers that have an impact on the Global Surveillance Radars Market. Understanding the impact of the surrounding environment and the influence of environmental concerns on the global market is aided by legal factors.
Surveillance Radars Market Scope:
|
Surveillance Radars Market |
|
|
Market Size in 2025 |
USD 11.91 Bn. |
|
Market Size in 2032 |
USD 20.54 Bn. |
|
CAGR (2026-2032) |
8.1% |
|
Historic Data |
2020-2025 |
|
Base Year |
2025 |
|
Forecast Period |
2026-2032 |
|
Segment Scope |
by Radar Type
|
|
by Platform
|
|
|
by Component
|
|
|
By Application
|
|
|
Regional Scope |
North America- United States, Canada, and Mexico Europe – UK, France, Germany, Italy, Spain, Sweden, Austria, and Rest of Europe Asia Pacific – China, India, Japan, South Korea, Australia, ASEAN, Rest of APAC Middle East and Africa - South Africa, GCC, Egypt, Nigeria, Rest of the Middle East and Africa South America – Brazil, Argentina, Rest of South America |
Surveillance Radars Market Key Players:
- Raytheon Technologies Corporation (US)
- Lockheed Martin Corporation (US)
- Hensoldt (Germany)
- Israel Aerospace Industries Ltd. (Israel)
- Leonardo S.p.A (Italy)
- Elbit Systems Ltd. (Israel)
- FLIR Systems Ltd. (US)
- Saab AB (Sweden)
- Thales Group (France)
- Honeywell International Inc. (US)
- BAE Systems (UK)
- Terma A/S (Denmark)
- Src, Inc. (US)
- Reutech Radar Systems (South Africa)
- Indra Company (Spain)s
- Japan Radio Co. Ltd. (Japan)
Frequently Asked Questions
The North American region is expected to hold the highest share in the Surveillance Radars Market.
The market size of the Surveillance Radars Market by 2032 is expected to reach at US$ 20.54 Bn.
The forecast period for the Surveillance Radars Market is 2026-2032.
The market size of the Surveillance Radars Market in 2025 was valued at US$ 11.91 Bn.
1. Research Methodology
1.1 Research Data
1.1.1. Primary Data
1.1.2. Secondary Data
1.2. Market Size Estimation
1.2.1. Bottom-Up Approach
1.2.2. Top-Down Approach
1.3. Market Breakdown and Data Triangulation
1.4. Research Assumption
2. Surveillance Radars Market Executive Summary
2.1. Market Overview
2.2. Market Size (2025) and Forecast (2026– 2032) and Y-O-Y%
2.3. Market Size (USD) and Market Share (%) – By Segments and Regions
3. Global Surveillance Radars Market: Competitive Landscape
3.1. SMR Competition Matrix
3.2. Key Players Benchmarking
3.2.1. Company Name
3.2.2. Headquarter
3.2.3. Product Segment
3.2.4. End-user Segment
3.2.5. Y-O-Y%
3.2.6. Revenue (2025)
3.2.7. Profit Margin
3.2.8. Market Share
3.2.9. Company Locations
3.3. Market Structure
3.3.1. Market Leaders
3.3.2. Market Followers
3.3.3. Emerging Players
3.4. Consolidation of the Market
3.4.1. Strategic Initiatives and Developments
3.4.2. Mergers and Acquisitions
3.4.3. Collaborations and Partnerships
3.4.4. Product Launches and Innovations
3.5. Surveillance Radars Industry Ecosystem
3.5.1. Ecosystem Analysis
3.5.2. Role of the Companies in the Ecosystem
4. Surveillance Radars Market: Dynamics
4.1. Surveillance Radars Market Trends by Region
4.1.1. North America
4.1.2. Europe
4.1.3. Asia Pacific
4.1.4. Middle East and Africa
4.1.5. South America
4.2. Surveillance Radars Market Drivers
4.3. Surveillance Radars Market Restraints
4.4. Surveillance Radars Market Opportunities
4.5. Surveillance Radars Market Challenges
4.6. PORTER’s Five Forces Analysis
4.6.1. Intensity of the Rivalry
4.6.2. Threat of New Entrants
4.6.3. Bargaining Power of Suppliers
4.6.4. Bargaining Power of Buyers
4.6.5. Threat of Substitutes
4.7. PESTLE Analysis
4.7.1. Political Factors
4.7.2. Economic Factors
4.7.3. Social Factors
4.7.4. Technological Factors
4.7.5. Legal Factors
4.7.6. Environmental Factors
4.8. Technological Analysis
4.8.1. Broadband Radar And Multifunctional Rf-Systems
4.8.2. Software Defined Radars
4.8.3. Development of 3d Radars
4.8.4. Laser Radar (Lidar) Technology
4.8.5. Technological Roadmap
4.9. Value Chain Analysis
4.10. Regulatory Landscape
4.10.1. Market Regulation by Region
4.10.1.1. North America
4.10.1.2. Europe
4.10.1.3. Asia Pacific
4.10.1.4. Middle East and Africa
4.10.1.5. South America
4.10.2. Impact of Regulations on Market Dynamics
4.10.3. Government Schemes and Initiatives
5. Surveillance Radars Market: Global Market Size and Forecast by Segmentation (by Value in USD Million) (2025-2032)
5.1. Surveillance Radars Market Size and Forecast, by Radar Type (2025-2032)
5.1.1. Short Range Surveillance Radar
5.1.2. Medium Range Surveillance Radar
5.1.3. Long-Range Surveillance Radar
5.2. Surveillance Radars Market Size and Forecast, by Platform (2025-2032)
5.2.1. Land
5.2.2. Airborne
5.2.3. Naval
5.2.4. Space
5.3. Surveillance Radars Market Size and Forecast, by Component (2025-2032)
5.3.1. Antennas
5.3.2. Transmitters
5.3.3. Duplexers
5.3.4. Power Amplifiers
5.3.5. Receivers
5.3.6. Signal Processors
5.3.7. Cameras
5.3.8. Others
5.4. Surveillance Radars Market Size and Forecast, by Application (2025-2032)
5.4.1. Commercial
5.4.2. National Security
5.4.3. Military & Defense
5.4.4. Aerospace
5.4.5. Maritime
5.4.6. Others
5.5. Surveillance Radars Market Size and Forecast, by Region (2025-2032)
5.5.1. North America
5.5.2. Europe
5.5.3. Asia Pacific
5.5.4. Middle East and Africa
5.5.5. South America
6. North America Surveillance Radars Market Size and Forecast by Segmentation (by Value in USD Million) (2025-2032)
6.1. North America Surveillance Radars Market Size and Forecast, by Radar Type (2025-2032)
6.1.1. Short Range Surveillance Radar
6.1.2. Medium Range Surveillance Radar
6.1.3. Long-Range Surveillance Radar
6.2. North America Surveillance Radars Market Size and Forecast, by Platform (2025-2032)
6.2.1. Land
6.2.2. Airborne
6.2.3. Naval
6.2.4. Space
6.3. North America Surveillance Radars Market Size and Forecast, by Component (2025-2032)
6.3.1. Antennas
6.3.2. Transmitters
6.3.3. Duplexers
6.3.4. Power Amplifiers
6.3.5. Receivers
6.3.6. Signal Processors
6.3.7. Cameras
6.3.8. Others
6.4. North America Surveillance Radars Market Size and Forecast, by Application (2025-2032)
6.4.1. Commercial
6.4.2. National Security
6.4.3. Military & Defense
6.4.4. Aerospace
6.4.5. Maritime
6.4.6. Others
6.5. North America Surveillance Radars Market Size and Forecast, by Country (2025-2032)
6.5.1. United States
6.5.2. Canada
6.5.3. Mexico
7. Europe Surveillance Radars Market Size and Forecast by Segmentation (by Value in USD Million) (2025-2032)
7.1. Europe Surveillance Radars Market Size and Forecast, by Radar Type (2025-2032)
7.2. Europe Surveillance Radars Market Size and Forecast, by Platform (2025-2032)
7.3. Europe Surveillance Radars Market Size and Forecast, by Component (2025-2032)
7.4. Europe Surveillance Radars Market Size and Forecast, by Application (2025-2032)
7.5. Europe Surveillance Radars Market Size and Forecast, by Country (2025-2032)
7.5.1. United Kingdom
7.5.2. France
7.5.3. Germany
7.5.4. Italy
7.5.5. Spain
7.5.6. Sweden
7.5.7. Austria
7.5.8. Rest of Europe
8. Asia Pacific Surveillance Radars Market Size and Forecast by Segmentation (by Value in USD Million) (2025-2032)
8.1. Asia Pacific Surveillance Radars Market Size and Forecast, by Radar Type (2025-2032)
8.2. Asia Pacific Surveillance Radars Market Size and Forecast, by Platform (2025-2032)
8.3. Asia Pacific Surveillance Radars Market Size and Forecast, by Component (2025-2032)
8.4. Asia Pacific Surveillance Radars Market Size and Forecast, by Application (2025-2032)
8.5. Asia Pacific Surveillance Radars Market Size and Forecast, by Country (2025-2032)
8.5.1. China
8.5.2. S Korea
8.5.3. Japan
8.5.4. India
8.5.5. Australia
8.5.6. Indonesia
8.5.7. Malaysia
8.5.8. Vietnam
8.5.9. Taiwan
8.5.10. Rest of Asia Pacific
9. Middle East and Africa Surveillance Radars Market Size and Forecast by Segmentation (by Value in USD Million) (2025-2032)
9.1. Middle East and Africa Surveillance Radars Market Size and Forecast, by Radar Type (2025-2032)
9.2. Middle East and Africa Surveillance Radars Market Size and Forecast, by Platform (2025-2032)
9.3. Middle East and Africa Surveillance Radars Market Size and Forecast, by Component (2025-2032)
9.4. Middle East and Africa Surveillance Radars Market Size and Forecast, by Application (2025-2032)
9.5. Middle East and Africa Surveillance Radars Market Size and Forecast, by Country (2025-2032)
9.5.1. South Africa
9.5.2. GCC
9.5.3. Nigeria
9.5.4. Rest of ME&A
10. South America Surveillance Radars Market Size and Forecast by Segmentation (by Value in USD Million) (2025-2032)
10.1. South America Surveillance Radars Market Size and Forecast, by Radar Type (2025-2032)
10.2. South America Surveillance Radars Market Size and Forecast, by Platform (2025-2032)
10.3. South America Surveillance Radars Market Size and Forecast, by Component (2025-2032)
10.4. South America Surveillance Radars Market Size and Forecast, by Application (2025-2032)
10.5. South America Surveillance Radars Market Size and Forecast, by Country (2025-2032)
10.5.1. Brazil
10.5.2. Argentina
10.5.3. Rest Of South America
11. Company Profile: Key Players
11.1. Raytheon Technologies Corporation (US)
11.1.1. Company Overview
11.1.2. Business Portfolio
11.1.2.1. Product Name
11.1.2.2. Product Details (Price, Features, etc)
11.1.3. Financial Overview
11.1.3.1. Total Revenue
11.1.3.2. Segment Revenue
11.1.3.3. Regional Revenue
11.1.4. SWOT Analysis
11.1.5. Strategic Analysis
11.1.6. Recent Developments
11.2. Lockheed Martin Corporation (US)
11.3. Hensoldt (Germany)
11.4. Israel Aerospace Industries Ltd. (Israel)
11.5. Leonardo S.p.A (Italy)
11.6. Elbit Systems Ltd. (Israel)
11.7. FLIR Systems Ltd. (US)
11.8. Saab AB (Sweden)
11.9. Thales Group (France)
11.10. Honeywell International Inc. (US)
11.11. BAE Systems (UK)
11.12. Terma A/S (Denmark)
11.13. Src, Inc. (US)
11.14. Reutech Radar Systems (South Africa)
11.15. Indra Company (Spain)s
11.16. Japan Radio Co. Ltd. (Japan)
12. Key Findings
13. Analyst Recommendations
13.1. Strategic Recommendations
13.2. Future Outlook