Defect Detection Market Industry Overview (2026-2032) by Offering, Application, Vertical, and, Region.
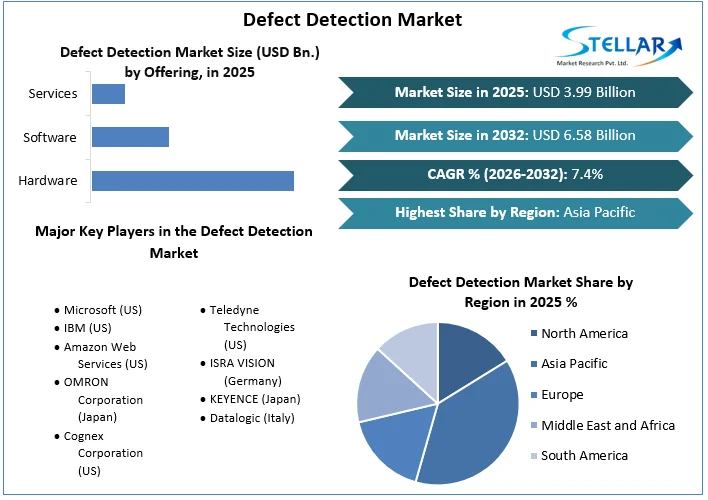
Defect Detection Market size was valued at US$ 3.99 Billion in 2025 and the total Defect Detection revenue is expected to grow at 7.4% through 2026 to 2032, reaching nearly US$ 6.58 Billion.
Defect Detection Market Overview:
Because detecting faults in software product development takes a lot of time and effort, it's critical to adopt the most efficient and profitable approaches available. Software developers can utilize proof-based computer programming to assist them to select which approaches to use and for what objective. One such technology is defect detection, which is used by software developers to evaluate software applications for flaws and defects. Because a software bug causes a difference between intended and true outcomes, it is critical for an inspector to seek them down and eliminate them from the system.
Detecting faults and errors in programming is critical because they can impair service performance, productivity, performance characteristics, and standardization. If these shortcomings or anomalies are ignored, they can lead to a major mishap, later on, further damaging the credibility of the company for which it was created. As a result, analysts with a thorough grasp of the software under test are crucial in finding as many flaws as feasible. They carry out well-planned assessment operations, including Prototype Testing, End-to-End Testing, Integration Tests, Experiential Testing, and other sorts of testing.
The market’s growth drivers, as well as the market’s segments (Offering, Application, Vertical, and, Region), are nalysed in this research. Market participants, regions, and special requirements have all provided data. This market study provides an in-depth look at all of the important advancements that are currently taking place across all industry sectors. Statistics, infographics, and presentations are used to provide key data analysis. The analysis looks at the market’s Drivers, Restraints, Opportunities, and Challenges for the Defect Detection market. The study aids in the evaluation of market growth drivers and the determination of how to employ these drivers as a tool. The research also aids in the correction and resolution of difficulties with the global Defect Detection market.
To get more Insights: Request Free Sample Report
Defect Detection Market Dynamics:
- One of the main drivers of the defect detection market is that Firms are putting a lot of effort into automated quality control and quality validation operations.
In production, a delicate balance must be struck between increasing output and reducing the amount of faulty products, which may be achieved by applying quality control procedures. This equilibrium is difficult to reach and is largely reliant on the industry and production processes used. As a result, industrial firms are facing fierce rivalry, and this trend is projected to continue over the forecast period. Businesses are aggressively concentrating on implementing intelligent automation throughout manufacturing enterprises to better maximize resources, ensure high quality of product, eliminate performance flaws, and decrease capital and operating expenses.
- A scarcity of trained workers in industrial plants is one of the major restraints of the defect detection market.
Human behavior and human instincts are heavily relied on in the industrial sector. However, the scarcity of trained experts has suddenly become a much more pressing issue; as a result, firms must automate production, installation, goods inspection and maintenance, and transit procedures that rely on humans. As a result, companies all over the world are increasingly embracing process robots, such as the rapidly increasing use of fault detection systems, device vision systems, etc to deliver improved efficiency and performance, eliminate waste and conserve biodiversity, and enter new markets and consumers.
- The embrace of AI technology in the industry is the key opportunity in the defect detection market.
One of the most crucial aspects of production is quality assurance. Physically examining each object is time-consuming and labor-intensive, resulting in roadblocks caused by prolonged manufacturing. Anomalies can be readily undetected by the naked eye or even industry professionals in many circumstances, resulting in the lower grade of a single part or a substandard complete solution that must be destroyed. Failure rates frequently rise as production processes get more complicated. Industries have lately concentrated on integrating sophisticated technologies, e.g. Artificial Intelligence and supervised learning, to revolutionize manufacturing processes and speed up quality inspection and fault identification.
Defect Detection Market Segment Analysis:
By Application, the Manufacturing segment dominated the defect detection market in 2025. It is expected to grow at the fastest CAGR of 6.7% in the aforementioned forecast period.
The production sector necessitates the identification of aesthetic flaws on various sorts of materials, which are hard to evaluate using traditional rule-based machine learning algorithms and the eyepiece. Because enterprises have acknowledged the necessity of quality standards in manufacturing operations, fault detection has become widely accepted as an important element of the lengthy automated testing development cycle.
The application of flaw detection across an industrial automation process aids in the identification of intricate faults in a brief span of time. As a result, expenditures are reduced while reaction time and efficiency are improved. Additionally, growing the implementation of a defect detection technique based on machine learning and Artificial Intelligence in production to speed output screening and allow timely identification of faults is boosting product demand.
By Vertical, Electronics, and Telecom segment of defect detection market is expected to grow at a CAGR of 5.8% in the forecast period. Besides superficial defects e.g. smudges, bent rims, palette varieties, spattered tags, and bits of hair, operational faults e.g. bent connectors on terminals and adapters, loose bolts, lost parts, and incorrect barcodes must also be observed in the electronics and telecom vertical to make fewer flawed processes and create production value. The growing requirement to adhere to demanding quality requirements, as well as the escalating need for strong speed production examination where output flow is quick, is enabling the growth of the electronics & telecom sector.
Defect Detection Market Regional Insights:
Asia Pacific countries e.g. China, and South Korea are among the largest manufacturing units, with mechanization being given top attention. Growing urbanization, as well as the existence of famous electronics, culinary and wrapping, and automobile industries, are expected to boost the potential market. Furthermore, several policy interventions e.g. Make in India to promote big and SME firms are stimulating Asia Pacific market growth. This region's industries are heavily investing in research and development and deployment of Industrial Internet of Things and other operational process automation techniques.
The purpose of this research is to provide stakeholders in the industry with a thorough insight into the Defect Detection Market. The study includes an analysis of difficult data in simple language, as well as the industry's historical and current state, as well as anticipated market size and trends. The market report examines all segments of the industry, with a focus on significant players such as market leaders, followers, and new entrants. The report includes a PORTER, PESTEL analysis as well as the possible influence of microeconomic market determinants. External and internal elements that are expected to have a favorable or negative impact on the firm have been examined, providing decision-makers with a clear future vision of the industry. The research also aids in comprehending the Defect Detection Market dynamics and structure by studying market segments and forecasting market size. The research is an investor's guide since it depicts the competitive analysis of major competitors in the Defect Detection Market by product, price, financial situation, product portfolio, growth plans, and geographical presence.
Defect Detection Market Scope:
|
Defect Detection Market |
|
|
Market Size in 2025 |
USD 3.99 Bn. |
|
Market Size in 2032 |
USD 6.58 Bn. |
|
CAGR (2026-2032) |
7.4 % |
|
Historic Data |
2020-2025 |
|
Base Year |
2025 |
|
Forecast Period |
2026-2032 |
|
Segment Scope |
by Offering
|
|
by Application
|
|
|
by Vertical
|
|
|
Regional Scope |
North America- United States, Canada, and Mexico Europe – UK, France, Germany, Italy, Spain, Sweden, Austria, and Rest of Europe Asia Pacific – China, India, Japan, South Korea, Australia, ASEAN, Rest of APAC Middle East and Africa - South Africa, GCC, Egypt, Nigeria, Rest of the Middle East and Africa South America – Brazil, Argentina, Rest of South America |
Defect Detection Market Players:
- Microsoft (US)
- IBM (US)
- Amazon Web Services (US)
- OMRON Corporation (Japan)
- Cognex Corporation (US)
- Teledyne Technologies (US)
- ISRA VISION (Germany)
- KEYENCE (Japan)
- Datalogic (Italy)
Frequently Asked Questions
One of the main drivers of the market is that Firms are putting a lot of effort into automated quality control and quality validation operations.
The key players are Microsoft, IBM, etc.
Electronics, and Telecom segment is expected to grow at a CAGR of 5.8% in the forecast period.
Chapter 1 Scope of the Report
Chapter 2 Research Methodology
2.1.Research Process
2.2.Global Defect Detection Market: Target Audience
2.3.Global Defect Detection Market: Primary Research (As per Client Requirement)
2.4.Global Defect Detection Market: Secondary Research
Chapter 3 Executive Summary
Chapter 4 Competitive Landscape
4.1.Market Share Analysis, By Value, 2025-2032
4.1.1.Market Share Analysis, By Region, By Value, 2025-2032 (In %)
4.1.1.1.North America Market Share Analysis, By Value, 2025-2032 (In %)
4.1.1.2.Europe Market Share Analysis, By Value, 2025-2032 (In %)
4.1.1.3.Asia Pacific Market Share Analysis, By Value, 2025-2032 (In %)
4.1.1.4.South America Market Share Analysis, By Value, 2025-2032 (In %)
4.1.1.5.Middle East and Africa Market Share Analysis, By Value, 2025-2032 (In %)
4.1.2.Market Share Analysis, By Offering, By Value, 2025-2032 (In %)
4.1.2.1.North America Market Share Analysis, By Offering, By Value, 2025-2032 (In %)
4.1.2.1.1.USA Market Share Analysis, By Offering, By Value, 2025-2032 (In %)
4.1.2.1.2.Canada Market Share Analysis, By Offering, By Value, 2025-2032 (In %)
4.1.2.1.3.Mexico Market Share Analysis, By Offering, By Value, 2025-2032 (In %)
4.1.2.2.Europe Market Share Analysis, By Offering, By Value, 2025-2032 (In %)
4.1.2.2.1.UK Market Share Analysis, By Offering, By Value, 2025-2032 (In %)
4.1.2.2.2.France Market Share Analysis, By Offering, By Value, 2025-2032 (In %)
4.1.2.2.3.Germany Market Share Analysis, By Offering, By Value, 2025-2032 (In %)
4.1.2.2.4.Italy Market Share Analysis, By Offering, By Value, 2025-2032 (In %)
4.1.2.2.5.Spain Market Share Analysis, By Offering, By Value, 2025-2032 (In %)
4.1.2.2.6.Sweden Market Share Analysis, By Offering, By Value, 2025-2032 (In %)
4.1.2.2.7.Austria Market Share Analysis, By Offering, By Value, 2025-2032 (In %)
4.1.2.2.8.Rest of Europe Market Share Analysis, By Offering, By Value, 2025-2032 (In %)
4.1.2.3.Asia Pacific Market Share Analysis, By Offering, By Value, 2025-2032 (In %)
4.1.2.3.1.China Market Share Analysis, By Offering, By Value, 2025-2032 (In %)
4.1.2.3.2.India Market Share Analysis, By Offering, By Value, 2025-2032 (In %)
4.1.2.3.3.Japan Market Share Analysis, By Offering, By Value, 2025-2032 (In %)
4.1.2.3.4.South Korea Market Share Analysis, By Offering, By Value, 2025-2032 (In %)
4.1.2.3.5.Australia Market Share Analysis, By Offering, By Value, 2025-2032 (In %)
4.1.2.3.6.ASEAN Market Share Analysis, By Offering, By Value, 2025-2032 (In %)
4.1.2.3.7.Rest of APAC Market Share Analysis, By Offering, By Value, 2025-2032 (In %)
4.1.2.4.South America Market Share Analysis, By Offering, By Value, 2025-2032 (In %)
4.1.2.4.1.Brazil Market Share Analysis, By Offering, By Value, 2025-2032 (In %)
4.1.2.4.2.Argentina Market Share Analysis, By Offering, By Value, 2025-2032 (In %)
4.1.2.4.3.Rest of South America Market Share Analysis, By Offering, By Value, 2025-2032 (In %)
4.1.2.5.Middle East and Africa Market Share Analysis, By Offering, By Value, 2025-2032 (In %)
4.1.2.5.1.South Africa Market Share Analysis, By Offering, By Value, 2025-2032 (In %)
4.1.2.5.2.GCC Market Share Analysis, By Offering, By Value, 2025-2032 (In %)
4.1.2.5.3.Egypt Market Share Analysis, By Offering, By Value, 2025-2032 (In %)
4.1.2.5.4.Nigeria Market Share Analysis, By Offering, By Value, 2025-2032 (In %)
4.1.2.5.5.Rest of Middle East and Africa Market Share Analysis, By Offering, By Value, 2025-2032 (In %)
4.1.3.Market Share Analysis, By Application, By Value, 2025-2032 (In %)
4.1.3.1.North America Market Share Analysis, By Application, By Value, 2025-2032 (In %)
4.1.3.1.1.USA Market Share Analysis, By Application, By Value, 2025-2032 (In %)
4.1.3.1.2.Canada Market Share Analysis, By Application, By Value, 2025-2032 (In %)
4.1.3.1.3.Mexico Market Share Analysis, By Application, By Value, 2025-2032 (In %)
4.1.3.2.Europe Market Share Analysis, By Application, By Value, 2025-2032 (In %)
4.1.3.2.1.UK Market Share Analysis, By Application, By Value, 2025-2032 (In %)
4.1.3.2.2.France Market Share Analysis, By Application, By Value, 2025-2032 (In %)
4.1.3.2.3.Germany Market Share Analysis, By Application, By Value, 2025-2032 (In %)
4.1.3.2.4.Italy Market Share Analysis, By Application, By Value, 2025-2032 (In %)
4.1.3.2.5.Spain Market Share Analysis, By Application, By Value, 2025-2032 (In %)
4.1.3.2.6.Sweden Market Share Analysis, By Application, By Value, 2025-2032 (In %)
4.1.3.2.7.Austria Market Share Analysis, By Application, By Value, 2025-2032 (In %)
4.1.3.2.8.Rest of Europe Market Share Analysis, By Application, By Value, 2025-2032 (In %)
4.1.3.3.Asia Pacific Market Share Analysis, By Application, By Value, 2025-2032 (In %)
4.1.3.3.1.China Market Share Analysis, By Application, By Value, 2025-2032 (In %)
4.1.3.3.2.India Market Share Analysis, By Application, By Value, 2025-2032 (In %)
4.1.3.3.3.Japan Market Share Analysis, By Application, By Value, 2025-2032 (In %)
4.1.3.3.4.South Korea Market Share Analysis, By Application, By Value, 2025-2032 (In %)
4.1.3.3.5.Australia Market Share Analysis, By Application, By Value, 2025-2032 (In %)
4.1.3.3.6.ASEAN Market Share Analysis, By Application, By Value, 2025-2032 (In %)
4.1.3.3.7.Rest of APAC Market Share Analysis, By Application, By Value, 2025-2032 (In %)
4.1.3.4.South America Market Share Analysis, By Application, By Value, 2025-2032 (In %)
4.1.3.4.1.Brazil Market Share Analysis, By Application, By Value, 2025-2032 (In %)
4.1.3.4.2.Argentina Market Share Analysis, By Application, By Value, 2025-2032 (In %)
4.1.3.4.3.Rest of South America Market Share Analysis, By Application, By Value, 2025-2032 (In %)
4.1.3.5.Middle East and Africa Market Share Analysis, By Application, By Value, 2025-2032 (In %)
4.1.3.5.1.South Africa Market Share Analysis, By Application, By Value, 2025-2032 (In %)
4.1.3.5.2.GCC Market Share Analysis, By Application, By Value, 2025-2032 (In %)
4.1.3.5.3.Egypt Market Share Analysis, By Application, By Value, 2025-2032 (In %)
4.1.3.5.4.Nigeria Market Share Analysis, By Application, By Value, 2025-2032 (In %)
4.1.3.5.5.Rest of Middle East and Africa Market Share Analysis, By Application, By Value, 2025-2032 (In %)
4.1.4.Market Share Analysis, By Vertical, By Value, 2025-2032 (In %)
4.1.4.1.North America Market Share Analysis, By Vertical, By Value, 2025-2032 (In %)
4.1.4.1.1.USA Market Share Analysis, By Vertical, By Value, 2025-2032 (In %)
4.1.4.1.2.Canada Market Share Analysis, By Vertical, By Value, 2025-2032 (In %)
4.1.4.1.3.Mexico Market Share Analysis, By Vertical, By Value, 2025-2032 (In %)
4.1.4.2.Europe Market Share Analysis, By Vertical, By Value, 2025-2032 (In %)
4.1.4.2.1.UK Market Share Analysis, By Vertical, By Value, 2025-2032 (In %)
4.1.4.2.2.France Market Share Analysis, By Vertical, By Value, 2025-2032 (In %)
4.1.4.2.3.Germany Market Share Analysis, By Vertical, By Value, 2025-2032 (In %)
4.1.4.2.4.Italy Market Share Analysis, By Vertical, By Value, 2025-2032 (In %)
4.1.4.2.5.Spain Market Share Analysis, By Vertical, By Value, 2025-2032 (In %)
4.1.4.2.6.Sweden Market Share Analysis, By Vertical, By Value, 2025-2032 (In %)
4.1.4.2.7.Austria Market Share Analysis, By Vertical, By Value, 2025-2032 (In %)
4.1.4.2.8.Rest of Europe Market Share Analysis, By Vertical, By Value, 2025-2032 (In %)
4.1.4.3.Asia Pacific Market Share Analysis, By Vertical, By Value, 2025-2032 (In %)
4.1.4.3.1.China Market Share Analysis, By Vertical, By Value, 2025-2032 (In %)
4.1.4.3.2.India Market Share Analysis, By Vertical, By Value, 2025-2032 (In %)
4.1.4.3.3.Japan Market Share Analysis, By Vertical, By Value, 2025-2032 (In %)
4.1.4.3.4.South Korea Market Share Analysis, By Vertical, By Value, 2025-2032 (In %)
4.1.4.3.5.Australia Market Share Analysis, By Vertical, By Value, 2025-2032 (In %)
4.1.4.3.6.ASEAN Market Share Analysis, By Vertical, By Value, 2025-2032 (In %)
4.1.4.3.7.Rest of APAC Market Share Analysis, By Vertical, By Value, 2025-2032 (In %)
4.1.4.4.South America Market Share Analysis, By Vertical, By Value, 2025-2032 (In %)
4.1.4.4.1.Brazil Market Share Analysis, By Vertical, By Value, 2025-2032 (In %)
4.1.4.4.2.Argentina Market Share Analysis, By Vertical, By Value, 2025-2032 (In %)
4.1.4.4.3.Rest of South America Market Share Analysis, By Vertical, By Value, 2025-2032 (In %)
4.1.4.5.Middle East and Africa Market Share Analysis, By Vertical, By Value, 2025-2032 (In %)
4.1.4.5.1.South Africa Market Share Analysis, By Vertical, By Value, 2025-2032 (In %)
4.1.4.5.2.GCC Market Share Analysis, By Vertical, By Value, 2025-2032 (In %)
4.1.4.5.3.Egypt Market Share Analysis, By Vertical, By Value, 2025-2032 (In %)
4.1.4.5.4.Nigeria Market Share Analysis, By Vertical, By Value, 2025-2032 (In %)
4.1.4.5.5.Rest of Middle East and Africa Market Share Analysis, By Vertical, By Value, 2025-2032 (In %)
4.2.Stellar Competition matrix
4.2.1.Global Stellar Competition Matrix
4.2.2.North America Stellar Competition Matrix
4.2.3.Europe Stellar Competition Matrix
4.2.4.Asia Pacific Stellar Competition Matrix
4.2.5.South America Stellar Competition Matrix
4.2.6.Middle East and Africa Stellar Competition Matrix
4.3. Key Players Benchmarking
4.3.1.Key Players Benchmarking By Offering, Pricing, Market Share, Investments, Expansion Plans, Physical Presence and Presence in the Market.
4.4. Mergers and Acquisitions in Industry
4.4.1.M&A by Region, Value and Strategic Intent
4.5.Market Dynamics
4.5.1.Market Drivers
4.5.2.Market Restraints
4.5.3.Market Opportunities
4.5.4.Market Challenges
4.5.5.PESTLE Analysis
4.5.6.PORTERS Five Force Analysis
4.5.7.Value Chain Analysis
Chapter 5 Global Defect Detection Market Segmentation: By Offering
5.1.Global Defect Detection Market, By Offering, Overview/Analysis, 2025-2032
5.2.Global Defect Detection Market, By Offering, By Value, Market Share (%), 2025-2032 (USD Billion)
5.3.Global Defect Detection Market, By Offering, By Value, -
5.3.1.Hardware
5.3.2.Software
5.3.3.Services
Chapter 6 Global Defect Detection Market Segmentation: By Application
6.1.Global Defect Detection Market, By Application, Overview/Analysis, 2025-2032
6.2.Global Defect Detection Market Size, By Application, By Value, Market Share (%), 2025-2032 (USD Billion)
6.3.Global Defect Detection Market, By Application, By Value, -
6.3.1.Manufacturing
6.3.2.Packaging
Chapter 7 Global Defect Detection Market Segmentation: By Vertical
7.1.Global Defect Detection Market, By Vertical, Overview/Analysis, 2025-2032
7.2.Global Defect Detection Market Size, By Vertical, By Value, Market Share (%), 2025-2032 (USD Billion)
7.3.Global Defect Detection Market, By Vertical, By Value, -
7.3.1.Automotive
7.3.2.Electronics & Telecom
7.3.3.Metals & Machinery
7.3.4.Food and Packaging
7.3.5.Pharmaceuticals
Chapter 8 Global Defect Detection Market Segmentation: By Region
8.1.Global Defect Detection Market, By Region – North America
8.1.1.North America Defect Detection Market Size, By Offering, By Value, 2025-2032 (USD Billion)
8.1.2.North America Defect Detection Market Size, By Application, By Value, 2025-2032 (USD Billion)
8.1.3.North America Defect Detection Market Size, By Vertical, By Value, 2025-2032 (USD Billion)
8.1.4.By Country – U.S.
8.1.4.1.U.S.Defect Detection Market Size, By Offering, By Value, 2025-2032 (USD Billion)
8.1.4.2.U.S.Defect Detection Market Size, By Application, By Value, 2025-2032 (USD Billion)
8.1.4.3.U.S.Defect Detection Market Size, By Vertical, By Value, 2025-2032 (USD Billion)
8.1.4.4.Canada Defect Detection Market Size, By Value, 2025-2032 (USD Billion)
8.1.4.5.Mexico Defect Detection Market Size, By Value, 2025-2032 (USD Billion)
8.2.Europe Defect Detection Market Size, By Value, 2025-2032 (USD Billion)
8.2.1.UK
8.2.2.France
8.2.3.Germany
8.2.4.Italy
8.2.5.Spain
8.2.6.Sweden
8.2.7.Austria
8.2.8.Rest of Europe
8.3. Asia Pacific Defect Detection Market Size, By Value, 2025-2032 (USD Billion)
8.3.1.China
8.3.2.India
8.3.3.Japan
8.3.4.South Korea
8.3.5.Australia
8.3.6.ASEAN
8.3.7.Rest of APAC
8.4. Middle East and Africa Defect Detection Market Size, By Value, 2025-2032 (USD Billion)
8.4.1.South Africa
8.4.2.GCC
8.4.3.Egypt
8.4.4.Nigeria
8.4.5.Rest of Middle East and Africa
8.5.South America Defect Detection Market Size, By Value, 2025-2032 (USD Billion)
8.5.1.Brazil
8.5.2.Argentina
8.5.3.Rest of South America
Chapter 9 Company Profiles
9.1.Key Players
9.1.1.Microsoft (US)
9.1.1.1.Company Overview
9.1.1.2.Tube Portfolio
9.1.1.3.Financial Overview
9.1.1.4.Business Strategy
9.1.1.5.Key Developments
9.1.2.IBM (US)
9.1.3.Amazon Web Services (US)
9.1.4.OMRON Corporation (Japan)
9.1.5.Cognex Corporation (US)
9.1.6.Teledyne Technologies (US)
9.1.7.ISRA VISION (Germany)
9.1.8.KEYENCE (Japan)
9.1.9.Datalogic (Italy)
9.2.Key Findings
9.3.Recommendations