Bio-energy Market Global Industry Analysis, Size, Share, Growth, Trend, and Forecast 2026-2032
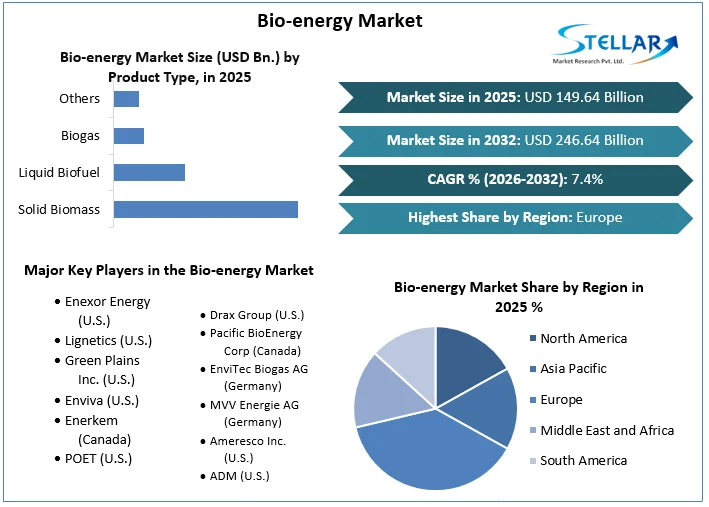
Bio-energy Market size was valued at US$ 149.64 Bn. in 2025. Global Bio-energy Market is estimated to grow at a CAGR of 7.4% over the forecast period.
Bio-energy Market Overview:
Bioenergy is biological and renewable energy, and it refers to the technical systems that produce, gather, convert, and use biomass as an energy source. Modern bioenergy refers to technological advances in biomass conversion combined with substantial changes in energy markets that enable a greater contribution of biomass to our energy needs to be explored. A large range of conversion paths can be identified, each of which produces a different type of energy carrier in solid, liquid, or gaseous form. These energy carriers serve a variety of markets, including heat, electricity generation, and transportation fuels. One key distinction between bioenergy and other renewable energy sources is that in bioenergy, the primary resource must be generated and/or collected, incurring a cost, whereas, in other systems, the "fuel" is free. Bio-energy market report provides you, PESTLE, PORTER analysis, competitive analysis and segment analysis on the basis of product type, feedstock, application and region.
To get more Insights: Request Free Sample Report
Bio-energy Market Dynamics:
The Rapid Depletion of Fossil Fuels across the Globe:
The world is excessively reliant on fossil fuels to meet its energy requirements. For example, in the United States, fossil fuels accounted for 81.5% of total energy consumption. Excessive reliance on finite energy sources is leading the rate of depletion to outpace the rate of replenishment. According to the US Energy Information Administration (EIA), current global crude oil stocks will be sufficient to fulfill global oil demand until 2050. According to research produced by the Millennium Alliance for Humanity and the Biosphere (MAHB), coal will be depleted in 70 years, gas in 40 years, and oil in 30 years. These dire predictions highlight the urgent need for the global community to develop and actively embrace bioenergy sources to lessen reliance on conventional energy. This rapid deplection of fossil fuels is expected to drive the bio-energy market growth through out the forecast period.
Bio-energy Market Insights:
Bioenergy power generation rose 53 TWh (+8%) in 2020, exceeding the 7% yearly rate required in the Net Zero Emissions by 2050 Scenario through 2030. However, to increase bioenergy power generation from 718 TWh in 2020 to more than 1 400 TWh in 2030, as expected in the scenario, an average of 15 GW of new capacity will be required yearly, a significant increase from the 9 GW delivered in 2020.
Policies to encourage the development of bioenergy power are improving around the world, but more effort will be required to guarantee that policy objectives are met and the rate of generation increase is maintained. The status of the Net Zero Emissions by 2050 Scenario has been altered from "on track" to "more efforts needed" because its bioenergy goals are higher than those of the Sustainable Development Scenario.
Growing Environmental Concerns and Energy Shortage across the Globe:
Concerns about energy shortages and the environmental impact of carbon emissions, along with the growing fear of losing energy independence for many nations, are driving the market Bio-energy market growth. Another element contributing to the shift in perception of the bioenergy industry is its potential to promote rural development and create new opportunities for agriculture and forestry.
While progress and advancement are pushing the global bioenergy industry to flourish, there are some obstacles that this market must face in order to become a success story. In terms of technological assistance, finances, and expertise, the bioenergy sector faces hurdles. Burning forest biomass is also condemned by some environmentalists because it produces greenhouse gas emissions. The biggest opportunity for the Bio-energy Market, however, is the rising global need for electricity.
Bio-energy Market Segment Analysis:
By Product Type, the Bio-energy Market is segmented into Solid Biomass, Liquid Biofuel, Biogas, and Others. The Solid Biomass segment dominated the market share with 68% in 2025. Wood fuel, forestry residues, charcoal, pellets, agri-culture crops and residues, municipal and industrial trash, biogas, biofuels, and so on are all sources of biomass. The supply can be divided into three categories: forestry, agriculture, and waste management. In 2025, solid biomass sources, such as wood chips and pellets, accounted for more than 64% of biopower generation in Europe, with municipal trash accounting for roughly 22% and biogas accounting for 14%. Similarly, in the United States, electricity generated from biomass and garbage accounted for around 2% of total electrical generation. In addition, the demand for renewable energy sources across the globe is growing continuously. As a result, biomass-based power generation is expected to rise at a high rate throughout the forecast period.

By Application, the Bio-energy Market is segmented into Power Generation, Heat Generation, Transportation, and Others. The Transportation segment dominated the market share with 41% in 2025. The segment’s growth is attributed to the government rules governing carbon emissions from traditional fuel sources such as diesel, kerosene, gasoline, and others used in transportation. In addition, the worldwide industry is expected to benefit during the forecast period from the fast growth in the transportation sector across the globe.
Bio-energy Market Regional Insights:
The Europe has dominated the bio-energy market with a 34% share in 2025. Bioenergy is expected to be critical during the next decade in order to meet renewable energy targets by 2020, which is why member states of the European Union (EU), which is included in their National Renewable Energy Action Plans (NREAPs). By 2025, bioenergy is expected to account for over half of the European Union's (EU) 20% renewable energy. In addition, the EU Renewable Energy Directive of 2009 established a target for the UK to attain 15% of total gross final energy consumption from renewable sources by 2020. Privilege Finance announced a EUR 90 million investment in June 2019 to support 14 MW of green energy projects in the UK, enough to power almost 28,000 homes. Once completed and operational, these projects are planned to transform 175,000 metric tonnes of food waste, as well as agricultural waste, into green gas for the National Grid. As a result, factors such as increased bioenergy industry investments and new bioenergy facilities in the region are expected to strengthen the region's position in the global bioenergy market over the forecast period.
The Asia Pacific region is expected to witness significant growth at a CAGR of 7.1% during the forecast period. Asia Pacific's booming economies, particularly India and China, which are also two of the world's greatest emitters, are implementing strong policy actions to reduce emissions. Wood as a biofuel is becoming more popular in industrialized economies like Japan, resulting in increased bioenergy usage in the region. As a result of these factors, the Bio-energy market in the Asia Pacific region is expected to grow significantly through the forecast period.
The objective of the report is to present a comprehensive analysis of the Global Bio-energy Market to the stakeholders in the industry. The report provides trends that are most dominant in the Global Bio-energy Market and how these trends will influence new business investments and market development throughout the forecast period. The report also aids in the comprehension of the Global Bio-energy Market dynamics and competitive structure of the market by analyzing market leaders, market followers, and regional players.
The qualitative and quantitative data provided in the Global Bio-energy Market report is to help understand which market segments, regions are expected to grow at higher rates, factors affecting the market, and key opportunity areas, which will drive the industry and market growth through the forecast period. The report also includes the competitive landscape of key players in the industry along with their recent developments in the Global Bio-energy Market. The report studies factors such as company size, market share, market growth, revenue, production volume, and profits of the key players in the global market.
The report provides Porter's Five Force Model, which helps in designing the business strategies in the market. The report helps in identifying how many rivals are existing, who they are, and how their product quality is in the Global Bio-energy Market. The report also analyses if the Global Bio-energy Market is easy for a new player to gain a foothold in the market, do they enter or exit the market regularly if the market is dominated by a few players, etc.
The report also includes a PESTEL Analysis, which aids in the development of company strategies. Political variables help in figuring out how much a government can influence the Global Bio-energy Market. Economic variables aid in the analysis of economic performance drivers that have an impact on the Global Bio-energy Market. Understanding the impact of the surrounding environment and the influence of environmental concerns on the global market is aided by legal factors.
Bio-energy Market Scope:
|
Bio-energy Market |
|
|
Market Size in 2025 |
USD 149.64 Bn. |
|
Market Size in 2032 |
USD 246.64 Bn. |
|
CAGR (2026-2032) |
7.4% |
|
Historic Data |
2020-2025 |
|
Base Year |
2025 |
|
Forecast Period |
2026-2032 |
|
Segment Scope |
By Product Type
|
|
By Feedstock
|
|
|
By Application
|
|
|
Regional Scope |
North America- United States, Canada, and Mexico Europe – UK, France, Germany, Italy, Spain, Sweden, Austria, and Rest of Europe Asia Pacific – China, India, Japan, South Korea, Australia, ASEAN, Rest of APAC Middle East and Africa - South Africa, GCC, Egypt, Nigeria, Rest of the Middle East and Africa South America – Brazil, Argentina, Rest of South America |
Bio-energy Market Key Players:
- Enexor Energy (U.S.)
- Lignetics (U.S.)
- Green Plains Inc. (U.S.)
- Enviva (U.S.)
- Enerkem (Canada)
- POET (U.S.)
- Drax Group (U.S.)
- Pacific BioEnergy Corp (Canada)
- EnviTec Biogas AG (Germany)
- MVV Energie AG (Germany)
- Ameresco Inc. (U.S.)
- ADM (U.S.)
Frequently Asked Questions
The European region is expected to hold the highest share in the Bio-energy Market.
The market size of the Bio-energy Market by 2032 is expected to reach at US$ 246.64 Bn.
The forecast period for the Bio-energy Market is 2026-2032
The market size of the Bio-energy Market in 2025 was valued at US$ 149.64 Bn.
1. Research Methodology
1.1 Research Data
1.1.1. Primary Data
1.1.2. Secondary Data
1.2. Market Size Estimation
1.2.1. Bottom-Up Approach
1.2.2. Top-Up Approach
1.3. Market Breakdown and Data Triangulation
1.4. Research Assumption
2. Bio-energy Market Executive Summary
2.1. Market Overview
2.2. Market Size (2025) and Forecast (2026– 2032) and Y-O-Y%
2.3. Market Size (USD) and Market Share (%) – By Segments and Regions
3. Global Bio-energy Market: Competitive Landscape
3.1. SMR Competition Matrix
3.2. Key Players Benchmarking
3.2.1. Company Name
3.2.2. Headquarter
3.2.3. Business Segment
3.2.4. End-user Segment
3.2.5. Y-O-Y%
3.2.6. Revenue (2025)
3.2.7. Market Share
3.2.8. Company Locations
3.3. Market Structure
3.3.1. Market Leaders
3.3.2. Market Followers
3.3.3. Emerging Players
3.4. Consolidation of the Market
3.4.1. Strategic Initiatives
3.4.2. Mergers and Acquisitions
3.4.3. Collaborations and Partnerships
3.4.4. Developments and Innovations
4. Bio-energy Market: Dynamics
4.1. Bio-energy Market Trends by Region
4.1.1. North America
4.1.2. Europe
4.1.3. Asia Pacific
4.1.4. Middle East and Africa
4.1.5. South America
4.2. Bio-energy Market Drivers
4.3. Bio-energy Market Restraints
4.4. Bio-energy Market Opportunities
4.5. Bio-energy Market Challenges
4.6. PORTER’s Five Forces Analysis
4.6.1. Intensity of the Rivalry
4.6.2. Threat of New Entrants
4.6.3. Bargaining Power of Suppliers
4.6.4. Bargaining Power of Buyers
4.6.5. Threat of Substitutes
4.7. PESTLE Analysis
4.7.1. Political Factors
4.7.2. Economic Factors
4.7.3. Social Factors
4.7.4. Legal Factors
4.7.5. Environmental Factors
4.8. Technological Roadmap
4.9. Regulatory Landscape
4.9.1. Market Regulation by Region
4.9.1.1. North America
4.9.1.2. Europe
4.9.1.3. Asia Pacific
4.9.1.4. Middle East and Africa
4.9.1.5. South America
4.9.2. Impact of Regulations on Market Dynamics
4.9.3. Government Schemes and Initiatives
5. Bio-energy Market: Global Market Size and Forecast by Segmentation (by Value in USD Million) (2025-2032)
5.1. Bio-energy Market Size and Forecast, by Product Type (2025-2032)
5.1.1. Solid Biomass
5.1.2. Liquid Biofuel
5.1.3. Biogas
5.1.4. Others
5.2. Bio-energy Market Size and Forecast, by Feedstock (2025-2032)
5.2.1. Agricultural Waste
5.2.2. Wood Waste
5.2.3. Solid Waste
5.2.4. Others
5.3. Bio-energy Market Size and Forecast, by Application (2025-2032)
5.3.1. Power Generation
5.3.2. Heat Generation
5.3.3. Transportation
5.3.4. Others
5.4. Bio-energy Market Size and Forecast, by Region (2025-2032)
5.4.1. North America
5.4.2. Europe
5.4.3. Asia Pacific
5.4.4. Middle East and Africa
5.4.5. South America
6. North America Bio-energy Market Size and Forecast by Segmentation (by Value in USD Million) (2025-2032)
6.1. North America Bio-energy Market Size and Forecast, by Product Type (2025-2032)
6.1.1. Solid Biomass
6.1.2. Liquid Biofuel
6.1.3. Biogas
6.1.4. Others
6.2. North America Bio-energy Market Size and Forecast, by Feedstock (2025-2032)
6.2.1. Agricultural Waste
6.2.2. Wood Waste
6.2.3. Solid Waste
6.2.4. Others
6.3. Bio-energy Market Size and Forecast, by Application (2025-2032)
6.3.1. Power Generation
6.3.2. Heat Generation
6.3.3. Transportation
6.3.4. Others
6.4. North America Bio-energy Market Size and Forecast, by Country (2025-2032)
6.4.1. United States
6.4.2. Canada
6.4.3. Mexico
7. Europe Bio-energy Market Size and Forecast by Segmentation (by Value in USD Million) (2025-2032)
7.1. Europe Bio-energy Market Size and Forecast, by Product Type (2025-2032)
7.2. Europe Bio-energy Market Size and Forecast, by Feedstock (2025-2032)
7.3. Europe Bio-energy Market Size and Forecast, by Application (2025-2032)
7.4. Europe Bio-energy Market Size and Forecast, by Country (2025-2032)
7.4.1. United Kingdom
7.4.2. France
7.4.3. Germany
7.4.4. Italy
7.4.5. Spain
7.4.6. Sweden
7.4.7. Austria
7.4.8. Rest of Europe
8. Asia Pacific Bio-energy Market Size and Forecast by Segmentation (by Value in USD Million) (2025-2032)
8.1. Asia Pacific Bio-energy Market Size and Forecast, by Product Type (2025-2032)
8.2. Asia Pacific Bio-energy Market Size and Forecast, by Feedstock (2025-2032)
8.3. Asia Pacific Bio-energy Market Size and Forecast, by Application (2025-2032)
8.4. Asia Pacific Bio-energy Market Size and Forecast, by Country (2025-2032)
8.4.1. China
8.4.2. S Korea
8.4.3. Japan
8.4.4. India
8.4.5. Australia
8.4.6. Indonesia
8.4.7. Malaysia
8.4.8. Vietnam
8.4.9. Taiwan
8.4.10. Rest of Asia Pacific
9. Middle East and Africa Bio-energy Market Size and Forecast by Segmentation (by Value in USD Million) (2025-2032)
9.1. Middle East and Africa Bio-energy Market Size and Forecast, by Product Type (2025-2032)
9.2. Middle East and Africa Bio-energy Market Size and Forecast, by Feedstock (2025-2032)
9.3. Middle East and Africa Bio-energy Market Size and Forecast, by Application (2025-2032)
9.4. Middle East and Africa Bio-energy Market Size and Forecast, by Country (2025-2032)
9.4.1. South Africa
9.4.2. GCC
9.4.3. Nigeria
9.4.4. Rest of ME&A
10. South America Bio-energy Market Size and Forecast by Segmentation (by Value in USD Million) (2025-2032)
10.1. South America Bio-energy Market Size and Forecast, by Product Type (2025-2032)
10.2. South America Bio-energy Market Size and Forecast, by Feedstock (2025-2032)
10.3. South America Bio-energy Market Size and Forecast, by Application (2025-2032)
10.4. South America Bio-energy Market Size and Forecast, by Country (2025-2032)
10.4.1. Brazil
10.4.2. Argentina
10.4.3. Rest Of South America
11. Company Profile: Key Players
11.1. Enexor Energy (U.S.)
11.1.1. Company Overview
11.1.2. Business Portfolio
11.1.3. Financial Overview
11.1.3.1. Total Revenue
11.1.3.2. Segment Revenue
11.1.3.3. Regional Revenue
11.1.4. SWOT Analysis
11.1.5. Strategic Analysis
11.1.6. Recent Developments
11.2. Lignetics (U.S.)
11.3. Green Plains Inc. (U.S.)
11.4. Enviva (U.S.)
11.5. Enerkem (Canada)
11.6. POET (U.S.)
11.7. Drax Group (U.S.)
11.8. Pacific BioEnergy Corp (Canada)
11.9. EnviTec Biogas AG (Germany)
11.10. MVV Energie AG (Germany)
11.11. Ameresco Inc. (U.S.)
11.12. ADM (U.S.)
12. Key Findings
13. Analyst Recommendations
13.1. Strategic Recommendations
13.2. Future Outlook