Renewable Energy Market Global Industry Analysis and Forecast (2026-2032) by Type, Tool, Mode of Operation, Application, and Region
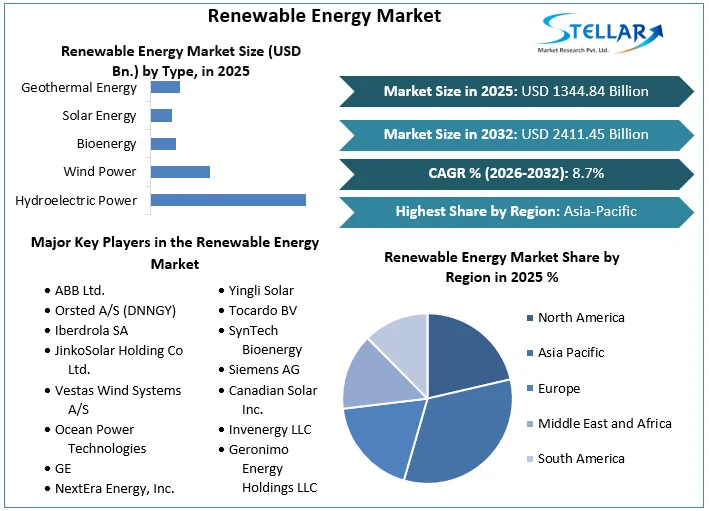
The renewable Energy Market size was valued at USD 1344.84 Bn. in 2025. Global Renewable Energy Market is estimated to grow at a CAGR of 8.7% over the forecast period.
Renewable Energy Market Overview:
Renewable energy is referred to as clean energy, which is usually derived from natural sources that are constantly replenished. The renewable energy sector remained extremely resilient in 2025, driven mainly by solid core fundamentals and a favorable environment policy by governments across the globe. Renewable energy resources have become one of the most competitive energy sources across the globe, thanks to the rapid technological advancements and falling costs, as well as the growing competitiveness of battery storage. The global renewable energy market report segment analysis did on the basis of type, application and region.
Cities, states, governments, NGOs, and utilities continued to take steps to accelerate the transition to renewable energy, with several establishing ambitious clean energy objectives, raising renewable portfolio criteria, and mandating energy storage procurement. The growing concerns about climate change and support for environmental, social, and governance (ESG) factors are increasing, along with increasing demand for cleaner energy sources from most market segments (residential, commercial, and industrial users) are driving the Renewable energy market growth.
To get more Insights: Request Free Sample Report
Renewable Energy Market Dynamics:
Rapid Growth in Adoption of Renewable Energy across the Globe:
In recent years, the rapid rise of solar and wind power has given new hope to global efforts to cut greenhouse gas emissions and mitigate the most serious effects of climate change. Solar and wind combined accounted for barely 1.7% of global electricity generation in 2010. By 2020, it had risen to 8.7%, significantly higher than what conventional energy models had expected. For example, the International Energy Agency expected that global solar energy generation will reach 550 terrawatt-hours by 2030 in 2012, but that number had already been surpassed by 2018. These factors presume that solar and wind power along with other types are expected to grow at a significant rate, which in turn is expected to boost the renewable energy market growth throughout the forecast period.
Sinking Cost for Renewable Energy boosting Market Growth:
The key driver in the growth of renewable energy has been reduced maintenance cost of plants. For instance, solar photovoltaic electricity costs have dropped by 85% since 2010, and the costs of onshore and offshore wind generation have been slashed in half. Both of these renewable energy sources are currently cheaper than fossil fuel electricity. Because of economies of scale and competitive supply chains, among other things, the more renewable energy technologies are deployed, the less expensive they become. As renewables gain in popularity, political influence, and financial backing, it becomes easier to enlist additional policy and financial support. In addition, support from policymakers has also been important and helps in growth of renewable energy market. Renewable energy tax credits and subsidies, feed-in tariffs, and competitive auctions have all assisted in lowering costs and accelerating adoption. In addition, government funding in research and development has been crucial in supporting renewable energy innovation.

Growing Renewable Energy Capacity Addition across the Globe:
Despite the disruptions and changes induced by the coronavirus epidemic, renewable energy sources have shown remarkable resilience. According to the IEA's Renewable Market Update report, the globe has installed more than 169 GW of renewable power capacity in 2020. Yearly renewable energy capacity additions reached 45% to 280 GW in 2020, which is the biggest annual increase since 1999. With annual additions, solar PV development is expected to continue to set new benchmarks. By 2022, it is expected to reach 162 GW, over 50% greater than the pre-pandemic level in 2019. In 2020, global wind capacity installations grew by more than 90% to reach 114 gigawatts. As a result, these factors are expected to boost the renewable energy market growth throughout the forecast period.

Renewable Energy Market key Trends:
- Increasing interest in next-generation clean energy technologies:- Private investment and pilot projects, along with federal research backing, is expected to help to accelerate the commercialization of developing advanced technologies such as green hydrogen, enhanced batteries, and other types of long-duration storage in an industry that has traditionally focused on solar and wind. These technologies can deliver zero-carbon electricity and longer-term seasonal electricity storage, as well as relieve system congestion, reduce renewable curtailment, improve grid dependability, and make solar and wind energy integration easier, all while supporting 100% clean energy targets.
- Solar Energy support new configurations: Solar photovoltaic (PV) systems are one of the most cost-effective energy options available. The solar sector will certainly increase its attempts to explore novel configurations and business models as it exercises its competitive muscle.
- Changing priority towards transmission infrastructure, particularly for offshore wind: Transmission development, which is important for connecting new, remote renewable energy generation to electricity-consuming cities, is expected to be a high priority for the renewable energy industry during the forecast period.
- Supply chain strategies are constantly changing: The earnings have recently fallen due to logistics-related cost constraints and US-China trade concerns, the renewable energy industry is expected to continue to adopt new supply networks. During the forecast period, renewable energy developers across the globe are expected to seek alternative suppliers, including domestic manufacturers when possible, reassess supply demands, and develop replacements to assist alleviate these pressures.
High Initial Investment and lack of skilled workers are restraining the Market Growth:
Developing new resources requires significant upfront infrastructural investments, which increases the cost of producing electricity and power, especially in the early years. To begin, the developers must locate publically acceptable areas with adequate resources and transmission links. Finding a potential solar site necessitates several years of monitoring to see whether it is suitable or not. In addition, workers must also be instructed on how to install, operate, and maintain the new technologies. Before the performance may be optimized, some require operating experience in specific climatic circumstances. These factors are expected to limit the renewable energy market growth during the forecast period.
Renewable Energy Market Segment Analysis:
By Type, the Renewable Energy Market is segmented into Hydroelectric Power, Wind Power, Bioenergy, Solar Energy, and Geothermal Energy. The Hydroelectric Power segment has dominated the market with a 38.2% share in 2025. Hydropower renewable energy operational costs are relatively low when compared to another type, hydropower generates very less greenhouse gas emissions. The market for hydropower plants has grown as a result of an increase in investments for off-grid energy generation and rural electrification in developing nations such as India, China, Brazil, and Vietnam. In addition, initiatives and funding for the hydroelectric project to generate electricity from the governments across the globe are also boosting the segment growth. For example, the Ministry of New and Renewable Energy's Small Hydropower Program and the Government of India's Rajiv Gandhi Grameen Vidyutikaran Yojana to electrify rural areas and promote the use of small hydropower energy for off-grid and mini-grid applications are expected to propel the market forward.
By Application, the Renewable Energy Market is segmented into Residential, Commercial, Industrial, and Others. The Residential segment is expected to grow at a CAGR of 8.6% during the forecast period. People are choosing renewable energy sources over traditional fast-depleting non-renewable energy sources, thanks to growing environmental consciousness and a desire to lessen the global carbon footprint. The segment growth is attributed to the increased use of geothermal heat pumps in home heating applications. The need for geothermal energy is expected to grow dramatically as the demand for electricity rises. In addition, residential geothermal power is offered by a number of organizations in the market.

For example, Enel Green Power owns the power plants at a complex and serves about 2 million households, 8700 residential and commercial users, and 25 acres of greenhouses.
Renewable Energy Market Regional Insights:
The Asia Pacific region dominated the global renewable energy market with a 34.7% share in 2024 and is expected to grow at a CAGR of 9.3% during the forecast period. With increased commerce and population, the region account for more than half of world energy consumption. In countries like China and India, the renewable energy sector has grown significantly.
For instance, in 2017, China overtook the United States as the world's largest producer of bioelectricity, and it is now a major participant in hydropower, onshore wind power, and solar photovoltaic. Although China has been responsible for 40% of global renewable capacity development for several years, it was responsible for 50% for the first time in 2023.

The North American region is expected to witness significant growth at a CAGR of 8.96% during the forecast period. The growing investment from the government in the renewable energy sector is driving the regional market growth. For instance, in December 2020, the US government extended the production and investment tax incentives for onshore wind and solar PV.
The objective of the report is to present a comprehensive analysis of the Global Renewable Energy Market to the stakeholders in the industry. The report provides trends that are most dominant in the Global Renewable Energy Market and how these trends will influence new business investments and market development throughout the forecast period. The report also aids in the comprehension of the global market dynamics and competitive structure of the market by analyzing market leaders, market followers, and regional players.
The qualitative and quantitative data provided in the Global Renewable Energy Market report is to help understand which market segments, regions are expected to grow at higher rates, factors affecting the market, and key opportunity areas, which will drive the industry and market growth through the forecast period. The report also includes the competitive landscape of key players in the industry along with their recent developments in the global market. The report studies factors such as company size, market share, market growth, revenue, production volume, and profits of the key players in the Global Renewable Energy Market.
The report provides Porter's Five Force Model, which helps in designing the business strategies in the market. The report helps in identifying how many rivals are existing, who they are, and how their product quality is in the Global Renewable Energy Market. The report also analyses if the Global Renewable Energy Market is easy for a new player to gain a foothold in the market, do they enter or exit the market regularly if the market is dominated by a few players, etc.
The report also includes a PESTEL Analysis, which aids in the development of company strategies. Political variables help in figuring out how much a government can influence the Global Renewable Energy Market. Economic variables aid in the analysis of economic performance drivers that have an impact on the global market. Understanding the impact of the surrounding environment and the influence of environmental concerns on the global market is aided by legal factors.
Renewable Energy Market Scope:
|
Renewable Energy Market |
|
|
Market Size in 2025 |
USD 1344.84 Bn. |
|
Market Size in 2032 |
USD 2411.45 Bn. |
|
CAGR (2026-2032) |
8.7% |
|
Historic Data |
2020-2025 |
|
Base Year |
2025 |
|
Forecast Period |
2026-2032 |
|
Segment Scope |
by Type Hydroelectric Power |
|
by Application Residential |
|
|
Regional Scope |
North America- United States, Canada, and Mexico Europe – UK, France, Germany, Italy, Spain, Sweden, Austria, and Rest of Europe Asia Pacific – China, India, Japan, South Korea, Australia, ASEAN, Rest of APAC Middle East and Africa - South Africa, GCC, Egypt, Nigeria, Rest of the Middle East and Africa South America – Brazil, Argentina, Rest of South America |
Renewable Energy Market Key Players:
- ABB Ltd.
- Orsted A/S (DNNGY)
- Iberdrola SA
- JinkoSolar Holding Co. Ltd.
- Vestas Wind Systems A/S
- Ocean Power Technologies
- GE
- NextEra Energy, Inc.
- Enel Group
- ONPOWER Business Energy
- Yingli Solar
- Tocardo BV
- SynTech Bioenergy
- Siemens AG
- Canadian Solar Inc.
- Invenergy LLC
- Geronimo Energy Holdings LLC
- EDF
- Xcel Energy
- Innergex
- TATA Power
Regional Breakdown:
Asia Pacific Renewable Energy Market: Industry Analysis and Forecast (2024-2030)
North America Renewable Energy Market: Industry Analysis and Forecast (2024-2030)
Frequently Asked Questions
The Asia Pacific is expected to hold the highest share in the Renewable Energy Market.
The market size of the Renewable Energy Market by 2032 is expected to reach at US$ 2411.45 Bn.
The forecast period for the Renewable Energy Market is 2026-2032.
The market size of the Renewable Energy Market in 2025 was valued at US$ 1344.84 Bn.
Chapter 1 Scope of the Report
Chapter 2 Research Methodology
2.1. Research Process
2.2. Global Renewable Energy Market: Target Audience
2.3. Global Renewable Energy Market: Primary Research (As per Client Requirement)
2.4. Global Renewable Energy Market: Secondary Research
Chapter 3 Executive Summary
Chapter 4 Competitive Landscape
4.1. Market Share Analysis, By Value, 2025-2032
4.1.1. Market Share Analysis, By Region, By Value, 2025-2032 (In %)
4.1.1.1. North America Market Share Analysis, By Value, 2025-2032 (In %)
4.1.1.2. Europe Market Share Analysis, By Value, 2025-2032 (In %)
4.1.1.3. Asia Pacific Market Share Analysis, By Value, 2025-2032 (In %)
4.1.1.4. South America Market Share Analysis, By Value, 2025-2032 (In %)
4.1.1.5. Middle East and Africa Market Share Analysis, By Value, 2025-2032 (In %)
4.1.2. Market Share Analysis, By Type, By Value, 2025-2032 (In %)
4.1.2.1. North America Market Share Analysis, By Type, By Value, 2025-2032 (In %)
4.1.2.1.1. USA Market Share Analysis, By Type, By Value, 2025-2032 (In %)
4.1.2.1.2. Canada Market Share Analysis, By Type, By Value, 2025-2032 (In %)
4.1.2.1.3. Mexico Market Share Analysis, By Type, By Value, 2025-2032 (In %)
4.1.2.2. Europe Market Share Analysis, By Type, By Value, 2025-2032 (In %)
4.1.2.2.1. UK Market Share Analysis, By Type, By Value, 2025-2032 (In %)
4.1.2.2.2. France Market Share Analysis, By Type, By Value, 2025-2032 (In %)
4.1.2.2.3. Germany Market Share Analysis, By Type, By Value, 2025-2032 (In %)
4.1.2.2.4. Italy Market Share Analysis, By Type, By Value, 2025-2032 (In %)
4.1.2.2.5. Spain Market Share Analysis, By Type, By Value, 2025-2032 (In %)
4.1.2.2.6. Sweden Market Share Analysis, By Type, By Value, 2025-2032 (In %)
4.1.2.2.7. Austria Market Share Analysis, By Type, By Value, 2025-2032 (In %)
4.1.2.2.8. Rest of Europe Market Share Analysis, By Type, By Value, 2025-2032 (In %)
4.1.2.3. Asia Pacific Market Share Analysis, By Type, By Value, 2025-2032 (In %)
4.1.2.3.1. China Market Share Analysis, By Type, By Value, 2025-2032 (In %)
4.1.2.3.2. India Market Share Analysis, By Type, By Value, 2025-2032 (In %)
4.1.2.3.3. Japan Market Share Analysis, By Type, By Value, 2025-2032 (In %)
4.1.2.3.4. South Korea Market Share Analysis, By Type, By Value, 2025-2032 (In %)
4.1.2.3.5. Australia Market Share Analysis, By Type, By Value, 2025-2032 (In %)
4.1.2.3.6. ASEAN Market Share Analysis, By Type, By Value, 2025-2032 (In %)
4.1.2.3.7. Rest of APAC Market Share Analysis, By Type, By Value, 2025-2032 (In %)
4.1.2.4. South America Market Share Analysis, By Type, By Value, 2025-2032 (In %)
4.1.2.4.1. Brazil Market Share Analysis, By Type, By Value, 2025-2032 (In %)
4.1.2.4.2. Argentina Market Share Analysis, By Type, By Value, 2025-2032 (In %)
4.1.2.4.3. Rest of South America Market Share Analysis, By Type, By Value, 2025-2032 (In %)
4.1.2.5. Middle East and Africa Market Share Analysis, By Type, By Value, 2025-2032 (In %)
4.1.2.5.1. South Africa Market Share Analysis, By Type, By Value, 2025-2032 (In %)
4.1.2.5.2. GCC Market Share Analysis, By Type, By Value, 2025-2032 (In %)
4.1.2.5.3. Egypt Market Share Analysis, By Type, By Value, 2025-2032 (In %)
4.1.2.5.4. Nigeria Market Share Analysis, By Type, By Value, 2025-2032 (In %)
4.1.2.5.5. Rest of Middle East and Africa Market Share Analysis, By Type, By Value, 2025-2032 (In %)
4.1.3. Market Share Analysis, By Application, By Value, 2025-2032 (In %)
4.1.4. North America Market Share Analysis, By Application, By Value, 2025-2032 (In %)
4.1.4.1.1. USA Market Share Analysis, By Application, By Value, 2025-2032 (In %)
4.1.4.1.2. Canada Market Share Analysis, By Application, By Value, 2025-2032 (In %)
4.1.4.1.3. Mexico Market Share Analysis, By Application, By Value, 2025-2032 (In %)
4.1.4.2. Europe Market Share Analysis, By Application, By Value, 2025-2032 (In %)
4.1.4.2.1. UK Market Share Analysis, By Application, By Value, 2025-2032 (In %)
4.1.4.2.2. France Market Share Analysis, By Application, By Value, 2025-2032 (In %)
4.1.4.2.3. Germany Market Share Analysis, By Application, By Value, 2025-2032 (In %)
4.1.4.2.4. Italy Market Share Analysis, By Application, By Value, 2025-2032 (In %)
4.1.4.2.5. Spain Market Share Analysis, By Application, By Value, 2025-2032 (In %)
4.1.4.2.6. Sweden Market Share Analysis, By Application, By Value, 2025-2032 (In %)
4.1.4.2.7. Austria Market Share Analysis, By Application, By Value, 2025-2032 (In %)
4.1.4.2.8. Rest of Europe Market Share Analysis, By Application, By Value, 2025-2032 (In %)
4.1.4.3. Asia Pacific Market Share Analysis, By Application, By Value, 2025-2032 (In %)
4.1.4.3.1. China Market Share Analysis, By Application, By Value, 2025-2032 (In %)
4.1.4.3.2. India Market Share Analysis, By Application, By Value, 2025-2032 (In %)
4.1.4.3.3. Japan Market Share Analysis, By Application, By Value, 2025-2032 (In %)
4.1.4.3.4. South Korea Market Share Analysis, By Application, By Value, 2025-2032 (In %)
4.1.4.3.5. Australia Market Share Analysis, By Application, By Value, 2025-2032 (In %)
4.1.4.3.6. ASEAN Market Share Analysis, By Application, By Value, 2025-2032 (In %)
4.1.4.3.7. Rest of APAC Market Share Analysis, By Application, By Value, 2025-2032 (In %)
4.1.4.4. South America Market Share Analysis, By Application, By Value, 2025-2032 (In %)
4.1.4.4.1. Brazil Market Share Analysis, By Application, By Value, 2025-2032 (In %)
4.1.4.4.2. Argentina Market Share Analysis, By Application, By Value, 2025-2032 (In %)
4.1.4.4.3. Rest of South America Market Share Analysis, By Application, By Value, 2025-2032 (In %)
4.1.4.5. Middle East and Africa Market Share Analysis, By Application, By Value, 2025-2032 (In %)
4.1.4.5.1. South Africa Market Share Analysis, By Application, By Value, 2025-2032 (In %)
4.1.4.5.2. GCC Market Share Analysis, By Application, By Value, 2025-2032 (In %)
4.1.4.5.3. Egypt Market Share Analysis, By Application, By Value, 2025-2032 (In %)
4.1.4.5.4. Nigeria Market Share Analysis, By Application, By Value, 2025-2032 (In %)
4.1.4.5.5. Rest of Middle East and Africa Market Share Analysis, By Application, By Value, 2025-2032 (In %)
4.2. Stellar Competition matrix
4.2.1. Global Stellar Competition Matrix
4.2.2. North America Stellar Competition Matrix
4.2.3. Europe Stellar Competition Matrix
4.2.4. Asia Pacific Stellar Competition Matrix
4.2.5. South America Stellar Competition Matrix
4.2.6. Middle East and Africa Stellar Competition Matrix
4.3. Key Players Benchmarking
4.3.1. Key Players Benchmarking By Type, Pricing, Market Share, Investments, Expansion Plans, Physical Presence and Presence in the Market.
4.4. Mergers and Acquisitions in Industry
4.4.1. M&A by Region, Value and Strategic Intent
4.5. Market Dynamics
4.5.1. Market Drivers
4.5.2. Market Restraints
4.5.3. Market Opportunities
4.5.4. Market Challenges
4.5.5. PESTLE Analysis
4.5.6. PORTERS Five Force Analysis
4.5.7. Value Chain Analysis
Chapter 5 Global Renewable Energy Market Segmentation: By Type
5.1. Global Renewable Energy Market, By Type, Overview/Analysis, 2025-2032
5.2. Global Renewable Energy Market, By Type, By Value, Market Share (%), 2025-2032 (USD Million)
5.3. Global Renewable Energy Market, By Type, By Value, -
5.3.1. Hydroelectric Power
5.3.2. Wind Power
5.3.3. Bioenergy
5.3.4. Solar Energy
5.3.5. Geothermal Energy
Chapter 6 Global Renewable Energy Market Segmentation: By Application
6.1. Global Renewable Energy Market, By Application, Overview/Analysis, 2025-2032
6.2. Global Renewable Energy Market Size, By Application, By Value, Market Share (%), 2025-2032 (USD Million)
6.3. Global Renewable Energy Market, By Application, By Value, -
6.3.1. Residential
6.3.2. Commercial
6.3.3. Industrial
6.3.4. Others
Chapter 7 Global Renewable Energy Market Segmentation: By Region
7.1. Global Renewable Energy Market, By Region – North America
7.1.1. North America Renewable Energy Market Size, By Type, By Value, 2025-2032 (USD Million)
7.1.2. North America Renewable Energy Market Size, By Application, By Value, 2025-2032 (USD Million)
7.1.3. By Country – U.S.
7.1.3.1. U.S. Renewable Energy Market Size, By Type, By Value, 2025-2032 (USD Million)
7.1.3.2. U.S. Renewable Energy Market Size, By Application, By Value, 2025-2032 (USD Million)
7.1.3.3. Canada Renewable Energy Market Size, By Value, 2025-2032 (USD Million)
7.1.3.4. Mexico Renewable Energy Market Size, By Value, 2025-2032 (USD Million)
7.2. Europe Renewable Energy Market Size, By Value, 2025-2032 (USD Million)
7.2.1. UK
7.2.2. France
7.2.3. Germany
7.2.4. Italy
7.2.5. Spain
7.2.6. Sweden
7.2.7. Austria
7.2.8. Rest of Europe
7.3. Asia Pacific Renewable Energy Market Size, By Value, 2025-2032 (USD Million)
7.3.1. China
7.3.2. India
7.3.3. Japan
7.3.4. South Korea
7.3.5. Australia
7.3.6. ASEAN
7.3.7. Rest of APAC
7.4. Middle East and Africa Renewable Energy Market Size, By Value, 2025-2032 (USD Million)
7.4.1. South Africa
7.4.2. GCC
7.4.3. Egypt
7.4.4. Nigeria
7.4.5. Rest of Middle East and Africa
7.5. South America Renewable Energy Market Size, By Value, 2025-2032 (USD Million)
7.5.1. Brazil
7.5.2. Argentina
7.5.3. Rest of South America
Chapter 8 Company Profiles
8.1. Key Players
8.1.1. ABB Ltd.
8.1.1.1. Company Overview
8.1.1.2. Product Portfolio
8.1.1.3. Financial Overview
8.1.1.4. Business Strategy
8.1.1.5. Key Developments
8.1.2. Orsted A/S (DNNGY)
8.1.3. Iberdrola SA
8.1.4. JinkoSolar Holding Co. Ltd.
8.1.5. Vestas Wind Systems A/S
8.1.6. Ocean Power Technologies
8.1.7. GE
8.1.8. NextEra Energy, Inc.
8.1.9. Enel Group
8.1.10. ONPOWER Business Energy
8.1.11. Yingli Solar
8.1.12. Tocardo BV
8.1.13. SynTech Bioenergy
8.1.14. Siemens AG
8.1.15. Canadian Solar Inc.
8.1.16. Invenergy LLC
8.1.17. Geronimo Energy Holdings LLC
8.1.18. EDF
8.1.19. Xcel Energy
8.1.20. Innergex
8.1.21. TATA Power
8.2. Key Findings
8.3. Recommendations