Mobile IV Hydration Services Market Industry Overview, Size, Share, Growth Trends, Research Insights and Forecast 2026–2034
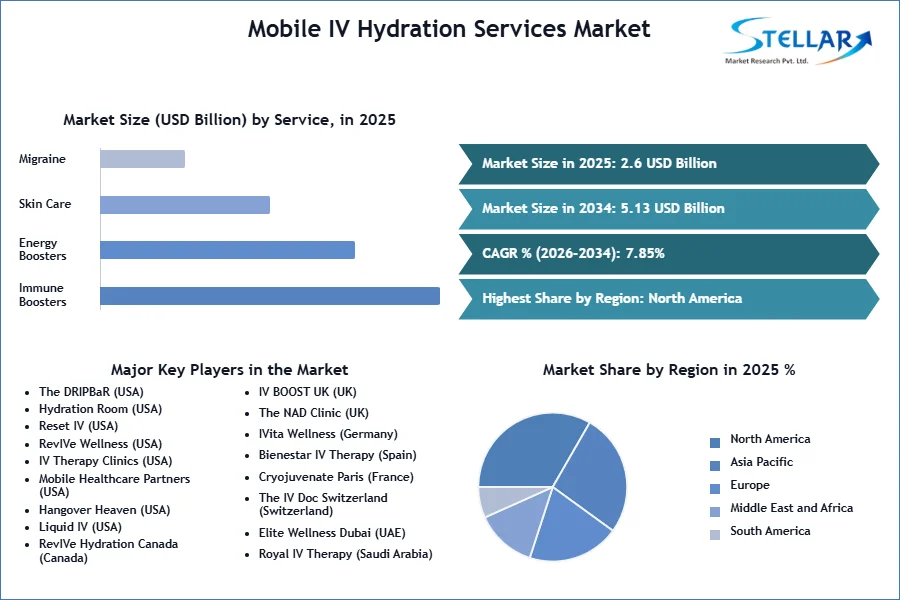
Mobile IV Hydration Services Market was valued at USD 2.6 billion in 2025. Its total industry revenue is expected to grow by 7.85% from 2026 to 2034, reaching nearly USD 5.13 billion in 2034.
Mobile IV Hydration Services Market Overview
Mobile IV Hydration Service is a specialized form of Mobile IV Therapy that focuses primarily on rehydrating body through the intravenous administration of fluids and electrolyte, often enhanced with essential vitamins. It is commonly used for rehydration after illness, intense workouts, travel, or hangover recovery. The service also supports wellness and energy boosts, helping clients recover from jet lag or fatigue. Typical treatments include basic vitamin supplements such as B-complex, vitamin C, and magnesium to promote overall well-being.
The Mobile IV Hydration Services market is rapidly evolving with trends toward hyper-personalized wellness. Providers are increasingly using AI and individual health data to create customized nutrient blends tailored for optimal hydration and recovery. The service is also gaining medical legitimacy, as physicians now prescribe IV hydration for conditions like chronic fatigue, migraines.
The mobile IV hydration services market is growing rapidly due to rising demand for convenient, on-demand wellness solutions like hydration therapy, vitamin infusions, and hangover recovery. Powered by health-conscious consumers, athletes and busy professionals, the market is the strongest in North America but is expanding in Europe and Asia. Prominent players include DRIPBaR and Hydration Room, Franchise and Corporate Partnership. Future trends include individual IV mixture and telemedicine integration. The market is ready for continuous growth as mobile IV Hydration becomes a mainstream welfare service.
To get more Insights: Request Free Sample Report
Mobile IV Hydration Services Market Dynamics
The Rise of On-Demand to Drive the Mobile IV Hydration Services Market Growth
Rise of on-demand mobile IV hydration services is growing by its increasing consumer demand for convenience and immediate wellness solutions. Patients can now access customized IV treatments at their homes, offices, or hotel rooms, eliminating need to visit a clinic or hospital. This flexibility especially appeals to high income urban professionals, fitness enthusiasts, and frequent travelers who seek quick recovery options for dehydration, fatigue, or hangovers. In cities like Mumbai, Delhi, and Bangalore, companies offering app based or WhatsApp enabled bookings have reported over 30% growth in repeat customers. Also, shift toward preventive healthcare and immunity boosting therapies has further increased uptake. The availability of tailored drips like Immunity Boost, Jet Lag Recovery, or Glow Drip has transformed IV therapy into a lifestyle oriented service rather than a clinical necessity.
Staffing Shortages Limit to Restrain the of Mobile IV Hydration Services Market Growth
Staffing shortages represent a significant restraint in the mobile IV hydration services market. According to the U.S. Bureau of Labor Statistics, there will be a projected shortfall of over 200,000 registered nurses by 2025. This shortage affects the availability of licensed professionals needed to administer IV therapies in mobile settings safely. As a result, companies may struggle to meet rising demand due to limited human resources.
Additionally, high competition for skilled nurses could drive up wages, increasing operational costs. These staffing constraints not only impact service expansion but may also lead to inconsistent service availability in certain regions.
India Green Hydrogen Mission and Saudi Vision 2034 to Create Opportunities the Mobile IV Hydration Services Market Growth
The mobile IV hydration services industry supports personalized IV formulations, revolutionizing treatment by shifting from generic drips to customized nutrient mixtures. Also using advanced diagnostics such as blood tests, genetic screening, and AI-driven health assessments, providers now create tailored blends targeting individual deficiencies, fitness goals, or chronic conditions. Athletes might receive recovery-focused IVs with amino acids, however, busy professionals get energy-optimized mixes with B vitamins and magnesium. This precision approach enhances efficacy and justifies premium pricing, setting IV therapy apart from over-the-counter supplements. While scalability challenges and regulatory gray areas around medical claims persist. This trend positions mobile IV services as premium, precision wellness options in an increasingly competitive market.
Mobile IV Hydration Services Market Segment Analysis
Based on service, the mobile IV hydration services market is segmented into immune boosters, energy boosters, skin care, migraine, and others. The immune boosters segment dominated the market in 2025 and is expected to hold the largest market share over the forecast period, leads due to post-pandemic health awareness and year-round demand. Services such as vitamin C, zinc, and glutathione drip, unlike Hangover or Beauty IVs, appeal to widespread audiences, from professionals to seniors. The trends of seasonal flu and corporate welfare programs promote further, while medical support adds reliability. Although energy and skin care IVs are growing, they target specific groups, whereas immune support has broader, recurring demand. This universal relevance strengthens the immune booster as a major service, in which individual IV therapy is running future development.
Based on component, the mobile IV hydration services market is segmented into medicated and non-medicated. Non-medicated segment dominated the market in 2025 and is expected to hold the largest market share over the forecast period, due to its broader appeal for wellness needs like vitamin drips and hydration therapy, fewer regulatory restrictions, and alignment with preventive healthcare trends. Unlike prescription-based medicated IVs, non-medicated services meet a comprehensive consumer base, demanding energy to increase, immune support and lifestyle benefits, making them more commercially viable and accessible.
Mobile IV Hydration Services Market Regional Analysis
North America is dominating the Mobile IV hydration services market due to the high health awareness and strong disposable income. U.S. leads with a widespread adoption of wellness trends and convenient on demand services. A key reason for U.S. leadership is its large base of health-conscious consumers, busy urban populations, and the rising popularity of alternative wellness therapies among millennials and Gen Z. Prominent players such as DRIPBaR and Hydration Room have expanded rapidly in major cities. A busy lifestyle and hangover recovery, promoting immunity and demand for energy medical fuel growth.
Urban residents in the U.S. face higher stress, with studies showing they are 21% more likely to have anxiety disorders and 39% more likely to have mood disorders than rural residents, driving demand for recovery solutions like IV hydration. Also, Supportive healthcare infrastructure and fewer regulatory hurdles further accelerate market penetration. Europe and the Asia-Pacific follow, but North America's established welfare culture and service are lacking. This combination of factors strengthens the top position of North America.
Mobile IV Hydration Services Market Competitive Landscape
The mobile IV hydration services market is highly competitive, with national chains (The DRIPBaR, Hydration Room) dominating through franchising, while tech-driven players (Reset IV, RevIVe) compete via on-demand apps. Companies differentiate through specialized therapies (NAD+, athletic recovery), subscription models, and corporate partnerships. While urban markets face pricing pressures, opportunities exist in underserved regions and premium concierge services. Regulatory hurdles and customer acquisition costs remain key challenges in this rapidly evolving wellness sector.
Recent Development in the Mobile IV Hydration Services Market
- The DRIPBaR (USA)
In Jan 29, 2025, Partnered with Hydreight Technologies to launch DRIPBaR Direct, a nationwide direct-to-consumer platform offering IV therapy services, enhancing accessibility and convenience for clients across the U.S.
- Hydration Room
In April 2025, Hydration Room, a California-based IV therapy chain, launched a new “Glow & Go” drip focused on collagen and biotin, expanding to five new locations.
- Reset IV
March 2025, Introduced a subscription-based model for regular IV therapy sessions, aiming to provide consistent wellness support for clients seeking ongoing hydration and nutrient replenishment.
- Liquid I.V.
May 1, 2025, Unveiled a new brand identity with updated packaging and launched the "Tear. Pour. Live. More." campaign, aiming to enhance consumer engagement and expand market reach
|
Mobile IV Hydration Services Market Scope |
|
|
Market Size in 2025 |
USD 2.6 Bn. |
|
Market Size in 2034 |
USD 5.13 Bn. |
|
CAGR (2026-2034) |
7.85% |
|
Historic Data |
2020-2025 |
|
Base Year |
2025 |
|
Forecast Period |
2026-2034 |
|
Segments
|
By Service Immune Boosters Energy Boosters Skin Care Migraine Others |
|
By Component Medicated Non-Medicated |
|
|
By End-User Hospitals and Clinics Wellness Centers and Spas Home Healthcare Others |
|
|
Regional Scope |
North America- United States, Canada, and Mexico Europe – UK, France, Germany, Italy, Spain, Sweden, Russia, and Rest of Europe Asia Pacific – China, India, Japan, South Korea, Australia, Indonesia, Philippines, Malaysia, Vietnam, Thailand, Rest of APAC Middle East and Africa - South Africa, GCC, Egypt, Nigeria, Rest of the Middle East and Africa South America – Brazil, Argentina, Rest of South America |
Key Players in the Mobile IV Hydration Services Market
North America
- The DRIPBaR (USA)
- Hydration Room (USA)
- Reset IV (USA)
- RevIVe Wellness (USA)
- IV Therapy Clinics (USA)
- Mobile Healthcare Partners (USA)
- Hangover Heaven (USA)
- Liquid IV (USA)
- RevIVe Hydration Canada (Canada)
Europe
- IV BOOST UK (UK)
- The NAD Clinic (UK)
- IVita Wellness (Germany)
- Bienestar IV Therapy (Spain)
- Cryojuvenate Paris (France)
- The IV Doc Switzerland (Switzerland)
Asia-Pacific
- Dubai IV Drip (UAE)
- The IV Clinic Singapore (Singapore)
- RevIVe Hong Kong (Hong Kong)
- The Hydration Room Australia (Australia)
- IV Wellness India (India)
- Bangkok IV Therapy (Thailand)
Middle East & Africa
- Elite Wellness Dubai (UAE)
- Royal IV Therapy (Saudi Arabia)
- Vital IV Drip SA (South Africa)
South America
- Rio Hydration Therapy (Brazil)
- Mexico IV Drip (Mexico)
- Buenos Aires IV Therapy (Argentina)
Frequently Asked Questions
Demand for convenience, post-pandemic wellness trends, and hyper-personalized treatments.
North America (U.S. dominates) due to health awareness, disposable income, and fewer regulations.
Customization using blood tests/AI to tailor drips for athletes, chronic fatigue, or beauty needs.
DRIPBaR, Hydration Room, Reset IV expanding via franchises and apps.
1. Mobile IV Hydration Services Market Introduction
1.1. Study Assumption and Market Definition
1.2. Scope of the Study
1.3. Executive Summary
2. Global Mobile IV Hydration Services Market: Competitive Landscape
2.1. SMR Competition Matrix
2.2. Key Players Benchmarking
2.2.1. Company Name
2.2.2. Service Segment
2.2.3. End-User Segment
2.2.4. Revenue (2025)
2.2.5. Geographical Presence
2.3. Market Structure
2.3.1. Market Leaders
2.3.2. Market Followers
2.3.3. Emerging Players
2.4. Mergers and Acquisitions Details
3. Mobile IV Hydration Services Market: Dynamics
3.1. Mobile IV Hydration Services Market Trends
3.2. Mobile IV Hydration Services Market Dynamics
3.2.1. Drivers
3.2.2. Restraints
3.2.3. Opportunities
3.2.4. Challenges
3.3. PORTER’s Five Forces Analysis
3.4. PESTLE Analysis
3.5. Regulatory Landscape by Region
3.6. Key Opinion Leader Analysis For the Global Industry
3.7. Analysis of Government Schemes and Initiatives for Industry
4. Mobile IV Hydration Services Market: Global Market Size and Forecast by Segmentation (by Value in USD Billion) (2026-2034)
4.1. Mobile IV Hydration Services Market Size and Forecast, By Service (2026-2034)
4.1.1. Immune Boosters
4.1.2. Energy Boosters
4.1.3. Skin Care
4.1.4. Migraine
4.1.5. Others
4.2. Mobile IV Hydration Services Market Size and Forecast, By Component (2026-2034)
4.2.1. Medicated
4.2.2. Non-Medicated
4.3. Mobile IV Hydration Services Market Size and Forecast, By End-User (2026-2034)
4.3.1. Hospitals and Clinics
4.3.2. Wellness Centers and Spas
4.3.3. Home Healthcare
4.3.4. Others
4.4. Mobile IV Hydration Services Market Size and Forecast, By Region (2026-2034)
4.4.1. North America
4.4.2. Europe
4.4.3. Asia Pacific
4.4.4. Middle East and Africa
4.4.5. South America
5. North America Mobile IV Hydration Services Market Size and Forecast by Segmentation (by Value in USD Billion) (2026-2034)
5.1. North America Mobile IV Hydration Services Market Size and Forecast, By Service (2026-2034)
5.1.1. Immune Boosters
5.1.2. Energy Boosters
5.1.3. Skin Care
5.1.4. Migraine
5.1.5. Others
5.2. North America Mobile IV Hydration Services Market Size and Forecast, By Component (2026-2034)
5.2.1. Medicated
5.2.2. Non-Medicated
5.3. North America Mobile IV Hydration Services Market Size and Forecast, By End-User (2026-2034)
5.3.1. Hospitals and Clinics
5.3.2. Wellness Centers and Spas
5.3.3. Home Healthcare
5.3.4. Others
5.4. North America Mobile IV Hydration Services Market Size and Forecast, by Country (2026-2034)
5.4.1. United States
5.4.1.1. United States Mobile IV Hydration Services Market Size and Forecast, By Service (2026-2034)
5.4.1.1.1. Immune Boosters
5.4.1.1.2. Energy Boosters
5.4.1.1.3. Skin Care
5.4.1.1.4. Migraine
5.4.1.1.5. Others
5.4.1.2. United States Mobile IV Hydration Services Market Size and Forecast, By Component (2026-2034)
5.4.1.2.1. Medicated
5.4.1.2.2. Non-Medicated
5.4.1.3. United States Mobile IV Hydration Services Market Size and Forecast, By End-User (2026-2034)
5.4.1.3.1. Hospitals and Clinics
5.4.1.3.2. Wellness Centers and Spas
5.4.1.3.3. Home Healthcare
5.4.1.3.4. Others
5.4.2. Canada
5.4.2.1. Canada Mobile IV Hydration Services Market Size and Forecast, By Service (2026-2034)
5.4.2.1.1. Immune Boosters
5.4.2.1.2. Energy Boosters
5.4.2.1.3. Skin Care
5.4.2.1.4. Migraine
5.4.2.1.5. Others
5.4.2.2. Canada Mobile IV Hydration Services Market Size and Forecast, By Component (2026-2034)
5.4.2.2.1. Medicated
5.4.2.2.2. Non-Medicated
5.4.2.3. Canada Mobile IV Hydration Services Market Size and Forecast, By End-User (2026-2034)
5.4.2.3.1. Hospitals and Clinics
5.4.2.3.2. Wellness Centers and Spas
5.4.2.3.3. Home Healthcare
5.4.2.3.4. Others
5.4.3. Mexico
5.4.3.1. Mexico Mobile IV Hydration Services Market Size and Forecast, By Service (2026-2034)
5.4.3.1.1. Immune Boosters
5.4.3.1.2. Energy Boosters
5.4.3.1.3. Skin Care
5.4.3.1.4. Migraine
5.4.3.1.5. Others
5.4.3.2. Mexico Mobile IV Hydration Services Market Size and Forecast, By Component (2026-2034)
5.4.3.2.1. Medicated
5.4.3.2.2. Non-Medicated
5.4.3.3. Mexico Mobile IV Hydration Services Market Size and Forecast, By End-User (2026-2034)
5.4.3.3.1. Hospitals and Clinics
5.4.3.3.2. Wellness Centers and Spas
5.4.3.3.3. Home Healthcare
5.4.3.3.4. Others
6. Europe Mobile IV Hydration Services Market Size and Forecast by Segmentation (by Value in USD Billion) (2026-2034)
6.1. Europe Mobile IV Hydration Services Market Size and Forecast, By Service (2026-2034)
6.2. Europe Mobile IV Hydration Services Market Size and Forecast, By Component (2026-2034)
6.3. Europe Mobile IV Hydration Services Market Size and Forecast, By End-User (2026-2034)
6.4. Europe Mobile IV Hydration Services Market Size and Forecast, by Country (2026-2034)
6.4.1. United Kingdom
6.4.1.1. United Kingdom Mobile IV Hydration Services Market Size and Forecast, By Service (2026-2034)
6.4.1.2. United Kingdom Mobile IV Hydration Services Market Size and Forecast, By Component (2026-2034)
6.4.1.3. United Kingdom Mobile IV Hydration Services Market Size and Forecast, By End-User (2026-2034)
6.4.2. France
6.4.2.1. France Mobile IV Hydration Services Market Size and Forecast, By Service (2026-2034)
6.4.2.2. France Mobile IV Hydration Services Market Size and Forecast, By Component (2026-2034)
6.4.2.3. France Mobile IV Hydration Services Market Size and Forecast, By End-User (2026-2034)
6.4.3. Germany
6.4.3.1. Germany Mobile IV Hydration Services Market Size and Forecast, By Service (2026-2034)
6.4.3.2. Germany Mobile IV Hydration Services Market Size and Forecast, By Component (2026-2034)
6.4.3.3. Germany Mobile IV Hydration Services Market Size and Forecast, By End-User (2026-2034)
6.4.4. Italy
6.4.4.1. Italy Mobile IV Hydration Services Market Size and Forecast, By Service (2026-2034)
6.4.4.2. Italy Mobile IV Hydration Services Market Size and Forecast, By Component (2026-2034)
6.4.4.3. Italy Mobile IV Hydration Services Market Size and Forecast, By End-User (2026-2034)
6.4.5. Spain
6.4.5.1. Spain Mobile IV Hydration Services Market Size and Forecast, By Service (2026-2034)
6.4.5.2. Spain Mobile IV Hydration Services Market Size and Forecast, By Component (2026-2034)
6.4.5.3. Spain Mobile IV Hydration Services Market Size and Forecast, By End-User (2026-2034)
6.4.6. Sweden
6.4.6.1. Sweden Mobile IV Hydration Services Market Size and Forecast, By Service (2026-2034)
6.4.6.2. Sweden Mobile IV Hydration Services Market Size and Forecast, By Component (2026-2034)
6.4.6.3. Sweden Mobile IV Hydration Services Market Size and Forecast, By End-User (2026-2034)
6.4.7. Russia
6.4.7.1. Russia Mobile IV Hydration Services Market Size and Forecast, By Service (2026-2034)
6.4.7.2. Russia Mobile IV Hydration Services Market Size and Forecast, By Component (2026-2034)
6.4.7.3. Russia Mobile IV Hydration Services Market Size and Forecast, By End-User (2026-2034)
6.4.8. Rest of Europe
6.4.8.1. Rest of Europe Mobile IV Hydration Services Market Size and Forecast, By Service (2026-2034)
6.4.8.2. Rest of Europe Mobile IV Hydration Services Market Size and Forecast, By Component (2026-2034)
6.4.8.3. Rest of Europe Mobile IV Hydration Services Market Size and Forecast, By End-User (2026-2034)
7. Asia Pacific Mobile IV Hydration Services Market Size and Forecast by Segmentation (by Value in USD Billion) (2026-2034)
7.1. Asia Pacific Mobile IV Hydration Services Market Size and Forecast, By Service (2026-2034)
7.2. Asia Pacific Mobile IV Hydration Services Market Size and Forecast, By Component (2026-2034)
7.3. Asia Pacific Mobile IV Hydration Services Market Size and Forecast, By End-User (2026-2034)
7.4. Asia Pacific Mobile IV Hydration Services Market Size and Forecast, by Country (2026-2034)
7.4.1. China
7.4.1.1. China Mobile IV Hydration Services Market Size and Forecast, By Service (2026-2034)
7.4.1.2. China Mobile IV Hydration Services Market Size and Forecast, By Component (2026-2034)
7.4.1.3. China Mobile IV Hydration Services Market Size and Forecast, By End-User (2026-2034)
7.4.2. S Korea
7.4.2.1. S Korea Mobile IV Hydration Services Market Size and Forecast, By Service (2026-2034)
7.4.2.2. S Korea Mobile IV Hydration Services Market Size and Forecast, By Component (2026-2034)
7.4.2.3. S Korea Mobile IV Hydration Services Market Size and Forecast, By End-User (2026-2034)
7.4.3. Japan
7.4.3.1. Japan Mobile IV Hydration Services Market Size and Forecast, By Service (2026-2034)
7.4.3.2. Japan Mobile IV Hydration Services Market Size and Forecast, By Component (2026-2034)
7.4.3.3. Japan Mobile IV Hydration Services Market Size and Forecast, By End-User (2026-2034)
7.4.4. India
7.4.4.1. India Mobile IV Hydration Services Market Size and Forecast, By Service (2026-2034)
7.4.4.2. India Mobile IV Hydration Services Market Size and Forecast, By Component (2026-2034)
7.4.4.3. India Mobile IV Hydration Services Market Size and Forecast, By End-User (2026-2034)
7.4.5. Australia
7.4.5.1. Australia Mobile IV Hydration Services Market Size and Forecast, By Service (2026-2034)
7.4.5.2. Australia Mobile IV Hydration Services Market Size and Forecast, By Component (2026-2034)
7.4.5.3. Australia Mobile IV Hydration Services Market Size and Forecast, By End-User (2026-2034)
7.4.6. Indonesia
7.4.6.1. Indonesia Mobile IV Hydration Services Market Size and Forecast, By Service (2026-2034)
7.4.6.2. Indonesia Mobile IV Hydration Services Market Size and Forecast, By Component (2026-2034)
7.4.6.3. Indonesia Mobile IV Hydration Services Market Size and Forecast, By End-User (2026-2034)
7.4.7. Malaysia
7.4.7.1. Malaysia Mobile IV Hydration Services Market Size and Forecast, By Service (2026-2034)
7.4.7.2. Malaysia Mobile IV Hydration Services Market Size and Forecast, By Component (2026-2034)
7.4.7.3. Malaysia Mobile IV Hydration Services Market Size and Forecast, By End-User (2026-2034)
7.4.8. Philippines
7.4.8.1. Philippines Mobile IV Hydration Services Market Size and Forecast, By Service (2026-2034)
7.4.8.2. Philippines Mobile IV Hydration Services Market Size and Forecast, By Component (2026-2034)
7.4.8.3. Philippines Mobile IV Hydration Services Market Size and Forecast, By End-User (2026-2034)
7.4.9. Thailand
7.4.9.1. Thailand Mobile IV Hydration Services Market Size and Forecast, By Service (2026-2034)
7.4.9.2. Thailand Mobile IV Hydration Services Market Size and Forecast, By Component (2026-2034)
7.4.9.3. Thailand Mobile IV Hydration Services Market Size and Forecast, By End-User (2026-2034)
7.4.10. Vietnam
7.4.10.1. Vietnam Mobile IV Hydration Services Market Size and Forecast, By Service (2026-2034)
7.4.10.2. Vietnam Mobile IV Hydration Services Market Size and Forecast, By Component (2026-2034)
7.4.10.3. Vietnam Mobile IV Hydration Services Market Size and Forecast, By End-User (2026-2034)
7.4.11. Rest of Asia Pacific
7.4.11.1. Rest of Asia Pacific Mobile IV Hydration Services Market Size and Forecast, By Service (2026-2034)
7.4.11.2. Rest of Asia Pacific Mobile IV Hydration Services Market Size and Forecast, By Component (2026-2034)
7.4.11.3. Rest of Asia Pacific Mobile IV Hydration Services Market Size and Forecast, By End-User (2026-2034)
8. Middle East and Africa Mobile IV Hydration Services Market Size and Forecast (by Value in USD Billion) (2026-2034)
8.1. Middle East and Africa Mobile IV Hydration Services Market Size and Forecast, By Service (2026-2034)
8.2. Middle East and Africa Mobile IV Hydration Services Market Size and Forecast, By Component (2026-2034)
8.3. Middle East and Africa Mobile IV Hydration Services Market Size and Forecast, By End-User (2026-2034)
8.4. Middle East and Africa Mobile IV Hydration Services Market Size and Forecast, by Country (2026-2034)
8.4.1. South Africa
8.4.1.1. South Africa Mobile IV Hydration Services Market Size and Forecast, By Service (2026-2034)
8.4.1.2. South Africa Mobile IV Hydration Services Market Size and Forecast, By Component (2026-2034)
8.4.1.3. South Africa Mobile IV Hydration Services Market Size and Forecast, By End-User (2026-2034)
8.4.2. GCC
8.4.2.1. GCC Mobile IV Hydration Services Market Size and Forecast, By Service (2026-2034)
8.4.2.2. GCC Mobile IV Hydration Services Market Size and Forecast, By Component (2026-2034)
8.4.2.3. GCC Mobile IV Hydration Services Market Size and Forecast, By End-User (2026-2034)
8.4.3. Egypt
8.4.3.1. Egypt Mobile IV Hydration Services Market Size and Forecast, By Service (2026-2034)
8.4.3.2. Egypt Mobile IV Hydration Services Market Size and Forecast, By Component (2026-2034)
8.4.3.3. Egypt Mobile IV Hydration Services Market Size and Forecast, By End-User (2026-2034)
8.4.4. Nigeria
8.4.4.1. Nigeria Mobile IV Hydration Services Market Size and Forecast, By Service (2026-2034)
8.4.4.2. Nigeria Mobile IV Hydration Services Market Size and Forecast, By Component (2026-2034)
8.4.4.3. Nigeria Mobile IV Hydration Services Market Size and Forecast, By End-User (2026-2034)
8.4.5. Rest of ME&A
8.4.5.1. Rest of ME&A Mobile IV Hydration Services Market Size and Forecast, By Service (2026-2034)
8.4.5.2. Rest of ME&A Mobile IV Hydration Services Market Size and Forecast, By Component (2026-2034)
8.4.5.3. Rest of ME&A Mobile IV Hydration Services Market Size and Forecast, By End-User (2026-2034)
9. South America Mobile IV Hydration Services Market Size and Forecast by Segmentation (by Value in USD Billion) (2026-2034)
9.1. South America Mobile IV Hydration Services Market Size and Forecast, By Service (2026-2034)
9.2. South America Mobile IV Hydration Services Market Size and Forecast, By Component (2026-2034)
9.3. South America Mobile IV Hydration Services Market Size and Forecast, By End-User (2026-2034)
9.4. South America Mobile IV Hydration Services Market Size and Forecast, by Country (2026-2034)
9.4.1. Brazil
9.4.1.1. Brazil Mobile IV Hydration Services Market Size and Forecast, By Service (2026-2034)
9.4.1.2. Brazil Mobile IV Hydration Services Market Size and Forecast, By Component (2026-2034)
9.4.1.3. Brazil Mobile IV Hydration Services Market Size and Forecast, By End-User (2026-2034)
9.4.2. Argentina
9.4.2.1. Argentina Mobile IV Hydration Services Market Size and Forecast, By Service (2026-2034)
9.4.2.2. Argentina Mobile IV Hydration Services Market Size and Forecast, By Component (2026-2034)
9.4.2.3. Argentina Mobile IV Hydration Services Market Size and Forecast, By End-User (2026-2034)
9.4.3. Colombia
9.4.3.1. Colombia Mobile IV Hydration Services Market Size and Forecast, By Service (2026-2034)
9.4.3.2. Colombia Mobile IV Hydration Services Market Size and Forecast, By Component (2026-2034)
9.4.3.3. Colombia Mobile IV Hydration Services Market Size and Forecast, By End-User (2026-2034)
9.4.4. Chile
9.4.4.1. Chile Mobile IV Hydration Services Market Size and Forecast, By Service (2026-2034)
9.4.4.2. Chile Mobile IV Hydration Services Market Size and Forecast, By Component (2026-2034)
9.4.4.3. Chile Mobile IV Hydration Services Market Size and Forecast, By End-User (2026-2034)
9.4.5. Rest Of South America
9.4.5.1. Rest Of South America Mobile IV Hydration Services Market Size and Forecast, By Service (2026-2034)
9.4.5.2. Rest Of South America Mobile IV Hydration Services Market Size and Forecast, By Component (2026-2034)
9.4.5.3. Rest Of South America Mobile IV Hydration Services Market Size and Forecast, By End-User (2026-2034)
10. Company Profile: Key Players
10.1. The DRIPBaR (USA)
10.1.1. Company Overview
10.1.2. Business Portfolio
10.1.3. Financial Overview
10.1.4. SWOT Analysis
10.1.5. Strategic Analysis
10.1.6. Recent Developments
10.2. The DRIPBaR (USA)
10.3. Hydration Room (USA)
10.4. Reset IV (USA)
10.5. RevIVe Wellness (USA)
10.6. IV Therapy Clinics (USA)
10.7. Mobile Healthcare Partners (USA)
10.8. Hangover Heaven (USA)
10.9. Liquid IV (USA)
10.10. RevIVe Hydration Canada (Canada)
10.11. IV BOOST UK (UK)
10.12. The NAD Clinic (UK)
10.13. IVita Wellness (Germany)
10.14. Bienestar IV Therapy (Spain)
10.15. Cryojuvenate Paris (France)
10.16. The IV Doc Switzerland (Switzerland)
10.17. Dubai IV Drip (UAE)
10.18. The IV Clinic Singapore (Singapore)
10.19. RevIVe Hong Kong (Hong Kong)
10.20. The Hydration Room Australia (Australia)
10.21. IV Wellness India (India)
10.22. Bangkok IV Therapy (Thailand)
10.23. Elite Wellness Dubai (UAE)
10.24. Royal IV Therapy (Saudi Arabia)
10.25. Vital IV Drip SA (South Africa)
10.26. Rio Hydration Therapy (Brazil)
10.27. Mexico IV Drip (Mexico)
10.28. Buenos Aires IV Therapy (Argentina)
11. Key Findings
12. Industry Recommendations
13. Mobile IV Hydration Services Market: Research Methodology


