Specialty Vehicle Market Global Industry Analysis and Forecast (2026-2032) by Vehicle Type, Application, and Region
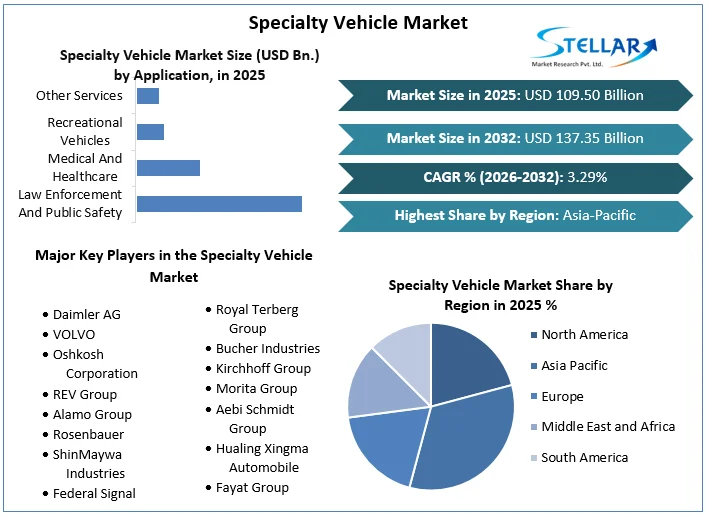
Specialty Vehicle Market size was valued at US$ 109.50 Billion in 2025 and the total Specialty Vehicle Market revenue is expected to grow at 3.29% through 2026 to 2032, reaching nearly US$ 137.35 Billion.
Specialty Vehicle Market Overview:
In the automotive industry, special purpose vehicles are primarily manufactured to perform specific tasks. Consequently, these vehicles are equipped with special equipment to be driven by own engine or separately mounted engine. Most times, special purpose vehicles are heavy duty vehicles, such as dump trucks and tank trucks. However, special purpose vehicles also consist of dump trucks, concrete pumps, along with pneumatic bulk carriers, and tank trailers. These vehicles are utilized in various industries including chemical, petroleum, and construction. The global report on specialty vehicle market is studied and analysed on the basis of vehicle type, application and region.
To get more Insights: Request Free Sample Report
Specialized vehicles mainly used in the construction and logistics sectors as well as garbage collection vehicles. The expansion of the construction industry in countries like China and India, with the active participation of the private sector, is expected to drive the specialized vehicle market during the forecast period. The expansion of the logistics sector is expected to drive the demand for special pneumatically powered bulk carriers and tank truck trailers, which in turn is expected to drive the market for the bulk carriers. Specialty Vehicle market is expected to register CAGR of 3.29% during the forecast period.
Specialty Vehicle Market Dynamics:
Global tourism has seen a significant increase. According to the United Nations World Tourism Organization (UNWTO), the United States recorded a total of 1,862.2 million domestic trips in 2019. This number is increasing gradually from 2009 and is estimated at 1,827.5 million rides in 2018, indicating an increase in demand for rides and, therefore, recreational vehicles used for these trips. The Bureau of Labor Statistics also estimates annual household spending at $336.02, which is expected to boost the domestic tourism market indirectly helps in the specialty vehicle market growth.
Increasing demand for risk mitigation on job sites:
Specialized vehicles have many potential risks of injury and death to employees. When working in an environment where hundreds of actions are taking place concurrently, security is a top priority. Tens of thousands of construction workers are injured on the job each year, with many incidents occurring while the worker is actually driving a specialized vehicle of some kind. According to the U.S. Occupational Safety and Health Administration (OSHA), there have been more than 200 registered professional vehicle-related deaths since 2017.
On construction sites, specialized vehicles need to be able to predict and detect dangerous situations in order to prevent them. There are no road signs, lane markings or established infrastructure to help guide vehicles on the right path. Fortunately, Image Radar can capture details of the surrounding work site, such as other vehicles and workers, as well as stationary objects including crates, materials, columns, and more. Not only can sensor solutions be used for object detection, but object location data can also be collected for real-time warning (or even stopping a vehicle in motion) if it accidentally getting too close to a person or detecting a dangerous situation. This ensures the safety of the operator and all others. Additional applications include forward collision warning, gap warning, automatic braking, adaptive cruise control, and all these are responsible in the growth of specialty vehicle market.
Recent developments in radar technology have become increasingly beneficial to the automotive industry. For specialized vehicles, in particular, self-driving car technology opens up possibilities that weren't available a decade ago. Today, commercial imaging radar sensors are being used with trucks, tractors, bulldozers and other emerging autonomous vehicle applications to support the development of smart buildings.
Growing Economic Compatibility:
The growing compatibility of the economy has led to global diversification and the birth of many businesses, such as mobile clinics, airport terminal expansion and transportation. E-commerce transfer, requires specialized facilities. In August 2019, Los Angeles Airport began purchasing 36 new low-rise specialty vehicles from Specialty Vehicle Inc. These vehicles are used as shuttles from the baggage claim area to the parking area. The aforementioned factors and circumstances are driving the growth of the global specialty vehicle market.

Specialty Vehicle Market Segmentation:
Healthcare and Enforcement Sector is driving the Market Growth:
The rise of epidemics and pandemics, road accidents, home and work injuries, and government-funded healthcare programs are driving the growth of the medical vehicle market and specialized healthcare. The rise of diseases such as blood cancer, which develops one every 3 minutes in the United States, has led to an increase in the demand for blood, driving the growth of the motorcycle market. Recent epidemics and pandemics, such as Ebola and COVID19, have increased the need for ambulances, mobile pharmacies, and mobile intensive care units. In many countries, increased demand for ambulances has outstripped population growth. In New Zealand, mobile operator room service has restarted after COVID19 lockdown restrictions were lifted. With the proliferation and development of autonomous vehicle technology, emergency vehicles are expected to soon be equipped with semi-autonomous driver assistance technology. Demand from all these and COVID-19 positve impact were help to the specialty vehicle market market during past 3 years.
Increased global government spending on law enforcement and healthcare facilities is driving demand for specialized vehicles. For example, in the 2019-20 financial year, the UK spent around £153 billion, up 2% year-on-year. According to the 2019 Statistical Analysis of Public Expenditure, public spending on law enforcement services in the UK during 2016-17 was £16.37 billion, increasing to 3.2%. In 2018-19, it reached £17.99 billion.
Construction Industry: Dark Horse of Specialty Vehicles Market:
The construction industry is likely to play an important role in the specialty vehicle market. The growth of the construction industry, due to rapid urbanization, government investment in construction projects and extensive private sector participation in construction, is expected to boost the specialty vehicle market. However, the logistics industry is also growing significantly due to the expansion of the e-commerce industry globally. The increased use of pneumatic bulk carriers and tanker trailers in the logistics industry is expected to drive the specialized vehicle market during the forecast period. Oil and chemical companies also use specialized tankers to transport flammable liquids and gasoline.
Radar Technology: Key Market Trend:
Job sites are anticipated to keep running smoothly, rain or shine, no matter the season. If a creation venture is delayed, numerous entities devour the cost. Because of this, there was an pressing marketplace want for sensors that offer LiDAR-like images, however which can characteristic successfully wherein LiDAR is compromised, together with extraordinarily bright, extraordinarily dim, dusty, and comparable situations.
While different answers are threatened with the aid of using non-top-quality climate and the diverse environmental situations stated above, radar gives extraordinarily dependable performance. Additionally, they create an exceptional expertise of the real-time running surroundings for self-sustaining distinctiveness motors in tough and difficult situations.Often complete of dirt and different particles flying around, radar sensors are best or even extra essential for secure operation on activity sites. Specialty motors could have the capacity to penetrate dirt, rain, and snow, and provide the identical dependable protection capability in awful climate and no mild situations.
APAC Region is dominating the Specialty Vehicle Market:
APAC is dominating the specialty vehicle market with market share of 35% and YOY rate of 6.18%. The construction industry in China is growing rapidly and was valued at USD 816.6 billion in 2017. The expansion of construction companies and active participation of the private sector are driving the construction industry. This country is developed. Similarly, in India, the construction industry includes the real estate and urban development segments. Government agencies and the private sector are expected to spend $454.8 billion on construction projects between 2015 and 2020, with 70% of the capital expected to be invested in electricity, roads, and roads, and urban infrastructure. In addition, the expansion of the logistics and logistics industries due to the presence of large automotive and e-commerce sectors is expected to drive the demand for specialized vehicles during the forecast period.
The objective of the report is to present a comprehensive analysis of the Specialty Vehicle Market to the stakeholders in the industry. The report provides trends that are most dominant in the Specialty Vehicle Market and how these trends will influence new business investments and market development throughout the forecast period. The report also aids in the comprehension of the global market dynamics and competitive structure of the market by analyzing market leaders, market followers, and regional players.
The qualitative and quantitative data provided in the Specialty Vehicle Market report is to help understand which market segments, regions are expected to grow at higher rates, factors affecting the market, and key opportunity areas, which will drive the industry and market growth through the forecast period. The report also includes the competitive landscape of key players in the industry along with their recent developments in the global market. The report studies factors such as company size, market share, market growth, revenue, production volume, and profits of the key players in the Specialty Vehicle Market.
The report provides Porter's Five Force Model, which helps in designing the business strategies in the market. The report helps in identifying how many rivals are existing, who they are, and how their product quality is in the Market. The report also analyses if the Specialty Vehicle Market is easy for a new player to gain a foothold in the market, do they enter or exit the market regularly if the market is dominated by a few players, etc.
The report also includes a PESTEL Analysis, which aids in the development of company strategies. Political variables help in figuring out how much a government can influence the Market. Economic variables aid in the analysis of economic performance drivers that have an impact on the Market. Understanding the impact of the surrounding environment and the influence of environmental concerns on the Specialty Vehicle Market is aided by legal factors.
Specialty Vehicle Market Scope:
|
Specialty Vehicle Market |
|
|
Market Size in 2025 |
USD 109.50 Bn. |
|
Market Size in 2032 |
USD 137.35 Bn. |
|
CAGR (2026-2032) |
3.29% |
|
Historic Data |
2020-2025 |
|
Base Year |
2025 |
|
Forecast Period |
2026-2032 |
|
Segment Scope |
By Vehicle Type
|
|
By Application
|
|
|
Regional Scope |
North America- United States, Canada, and Mexico Europe – UK, France, Germany, Italy, Spain, Sweden, Austria, and Rest of Europe Asia Pacific – China, India, Japan, South Korea, Australia, ASEAN, Rest of APAC Middle East and Africa - South Africa, GCC, Egypt, Nigeria, Rest of the Middle East and Africa South America – Brazil, Argentina, Rest of South America |
Specialty Vehicle Market Players
- Daimler AG
- VOLVO
- Oshkosh Corporation
- REV Group
- Alamo Group
- Rosenbauer
- ShinMaywa Industries
- Federal Signal
- XCMG
- Royal Terberg Group
- Bucher Industries
- Kirchhoff Group
- Morita Group
- Aebi Schmidt Group
- Hualing Xingma Automobile
- Fayat Group
- Labrie Enviroquip Group
- DIMA
Frequently Asked Questions
APAC region have the highest growth rate of 6.18% in the Specialty Vehicle market.
Daimler AG, VOLVO, Oshkosh Corporation, REV Group, Alamo Group, Rosenbauer, ShinMaywa Industries, Federal Signal, XCMG, Royal Terberg Group, Bucher Industries, Kirchhoff Group, Morita Group, Aebi Schmidt Group, Hualing Xingma Automobile, Fayat Group, Labrie Enviroquip Group, DIMA are the key players in the Specialty Vehicle market.
Healthcare segment is dominating the market with market share of approximately 53% with YOY growth rate of 5% owing to the rise of epidemics and pandemics, road accidents, home and work injuries, and government-funded healthcare programs.
1. Specialty Vehicle Market: Research Methodology
1.1. Research Data
1.1.1. Secondary Data
1.1.2. Primary Data
1.2. Market Size Estimation
1.2.1. Bottom-Up Approach
1.2.2. Top-Up Approach
1.3. Market Breakdown and Data Triangulation
1.4. Research Assumption
2. Specialty Vehicle Market: Executive Summary
3. Specialty Vehicle Market: Competitive Landscape
3.1. Stellar Competition Matrix
3.2. Key Players Benchmarking
3.3. Market Structure
3.3.1. Market Leaders
3.3.2. Market Followers
3.3.3. Emerging Players
3.4. Consolidation of the Market
4. Specialty Vehicle Market: Dynamics
4.1. Market Trends
4.2. Market Driver
4.3. Market Restraints
4.4. Market Opportunities
4.5. Market Challenges
4.6. Value Chain Analysis
4.7. Technology Roadmap
4.8. Supply Chain Analysis
4.9. Trade Analysis
4.10. PORTER’s Five Forces Analysis
4.11. PESTLE Analysis
4.12. Regulatory Landscape by Region
4.12.1. North America
4.12.2. Europe
4.12.3. Asia Pacific
4.12.4. Middle East and Africa
4.12.5. South America
5. Specialty Vehicle Market Size and Forecast by Segments (by Value in USD Mn)
5.1. Specialty Vehicle Market Size and Forecast, by Vehicle Type (2025-2032)
5.1.1. Concrete Mixer Truck
5.1.2. Refuse Collection Truck
5.1.3. Street Sweeper
5.1.4. Winter Maintenance Vehicle
5.1.5. Fuel Tankers
5.1.6. Ambulances
5.1.7. Other
5.2. Specialty Vehicle Market Size and Forecast, By Application (2025-2032)
5.2.1. Law Enforcement And Public Safety
5.2.2. Medical And Healthcare
5.2.3. Recreational Vehicles
5.2.4. Other Services
5.3. Specialty Vehicle Market Size and Forecast, by Region (2025-2032)
5.3.1. North America
5.3.2. Europe
5.3.3. Asia Pacific
5.3.4. Middle East and Africa
5.3.5. South America
6. North America Specialty Vehicle Market Size and Forecast (by Value in USD Mn)
6.1. North America Specialty Vehicle Market Size and Forecast, by Vehicle Type (2025-2032)
6.2. North America Specialty Vehicle Market Size and Forecast, By Application (2025-2032)
6.3. North America Specialty Vehicle Market Size and Forecast, by Country (2025-2032)
6.3.1. United States
6.3.2. Canada
6.3.3. Mexico
7. Europe Specialty Vehicle Market Size and Forecast (by Value in USD Mn)
7.1. Europe Specialty Vehicle Market Size and Forecast, by Vehicle Type (2025-2032)
7.2. Europe Specialty Vehicle Market Size and Forecast, By Application (2025-2032)
7.3. Europe Specialty Vehicle Market Size and Forecast, by Country (2025-2032)
7.3.1. UK
7.3.2. France
7.3.3. Germany
7.3.4. Italy
7.3.5. Spain
7.3.6. Sweden
7.3.7. Austria
7.3.8. Rest of Europe
8. Asia Pacific Specialty Vehicle Market Size and Forecast (by Value in USD Mn)
8.1. Asia Pacific Specialty Vehicle Market Size and Forecast, by Vehicle Type (2025-2032)
8.2. Asia Pacific Specialty Vehicle Market Size and Forecast, By Application (2025-2032)
8.3. Asia Pacific Specialty Vehicle Market Size and Forecast, by Country (2025-2032)
8.3.1. China
8.3.2. S Korea
8.3.3. Japan
8.3.4. India
8.3.5. Australia
8.3.6. Indonesia
8.3.7. Malaysia
8.3.8. Vietnam
8.3.9. Taiwan
8.3.10. Bangladesh
8.3.11. Pakistan
8.3.12. Rest of Asia Pacific
9. Middle East and Africa Specialty Vehicle Market Size and Forecast (by Value in USD Mn)
9.1. Middle East and Africa Specialty Vehicle Market Size and Forecast, by Vehicle Type (2025-2032)
9.2. Middle East and Africa Specialty Vehicle Market Size and Forecast, By Application (2025-2032)
9.3. Middle East and Africa Single-Use Filtration Assembly Market Size and Forecast, by Country (2025-2032)
9.3.1. South Africa
9.3.2. GCC
9.3.3. Egypt
9.3.4. Nigeria
9.3.5. Rest of ME&A
10. South America Specialty Vehicle Market Size and Forecast (by Value in USD Mn)
10.1. South America Specialty Vehicle Market Size and Forecast, by Vehicle Type (2025-2032)
10.2. South America Specialty Vehicle Market Size and Forecast, By Application (2025-2032)
10.3. South America Specialty Vehicle Market Size and Forecast, by Country (2025-2032)
10.3.1. Brazil
10.3.2. Argentina
10.3.3. Rest of South America
11. Company Profiles: Key Players
11.1. Daimler AG
11.1.1. Company Overview
11.1.2. Source Portfolio
11.1.3. Financial Overview
11.1.4. Business Strategy
11.1.5. Recent Developments
11.2. VOLVO
11.3. Oshkosh Corporation
11.4. REV Group
11.5. Alamo Group
11.6. Rosenbauer
11.7. ShinMaywa Industries
11.8. Federal Signal
11.9. XCMG
11.10. Royal Terberg Group
11.11. Bucher Industries
11.12. Kirchhoff Group
11.13. Morita Group
11.14. Aebi Schmidt Group
11.15. Hualing Xingma Automobile
11.16. Fayat Group
11.17. Labrie Enviroquip Group
11.18. DIMA
11.19.
12. Key Findings
13. Analyst Recommendations