Electric Vehicle Charging Station Market Driving the Growth of EV Infrastructure
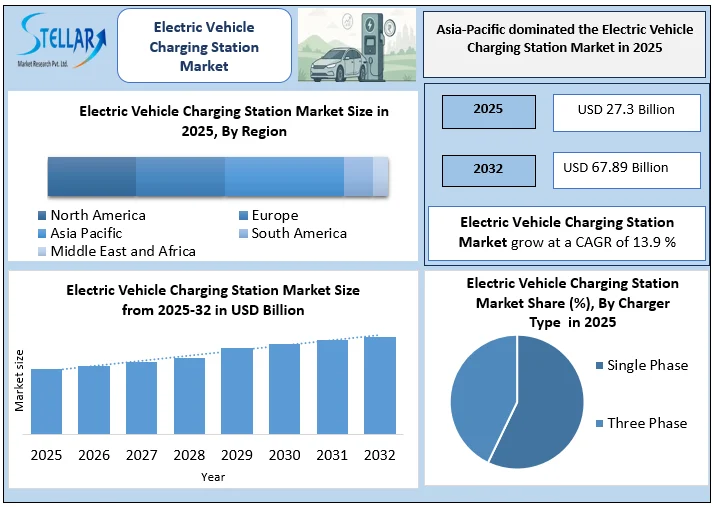
The global Electric Vehicle Charging Station Market is expected to reach approximately USD 67.89 Bn by 2032 from USD 27.3 Bn in 2025, growing at a CAGR of 13.9% during the forecast period. Increasing electric vehicle adoption, supportive government policies, expansion of fast-charging networks, and investments in public and private EV charging infrastructure are key factors driving this growth.
Electric Vehicle Charging Station Market: Overview
The EV charging station market is expecting accelerated growth, closely aligned with the surge in global EV adoption. By 2025, the global EV parc exceeded 45 million vehicles, intensifying demand for public, private, residential, and fleet-based EV charging solutions. Public charging infrastructure crossed 5 million installed units globally, with over 1.3 million new chargers deployed in 2025, reflecting strong policy support and private investment.
China dominated the market in 2025, hosting nearly 65% of global public charging points and accounting for around 60% of electric light-duty vehicles, supported by large-scale urban deployment and high EV sales volumes. Europe surpassed 1 million public chargers, recording growth above 35% in 2025, led by the Netherlands, approximately 180,000 units, Germany 160,000, France 155,000, and the UK, where EV penetration in new car sales ranges between 20% and over 90%. The United States operates close to 200,000 public charging points, driven by nationwide highway and corridor electrification programs.
India is emerging rapidly, adding nearly 40,000 public chargers in 2024, supported by the USD 240 million PM e-Drive scheme, targeting 72,300 stations. The global charging capacity is projected to expand nearly nine-fold by 2030, supported by faster charging technologies and optimized charger-to-vehicle ratios.
Key Market Highlights
- Scale of Infrastructure: Public chargers exceeded 5 million globally in 2025, nearly 1.3 million added in one year.
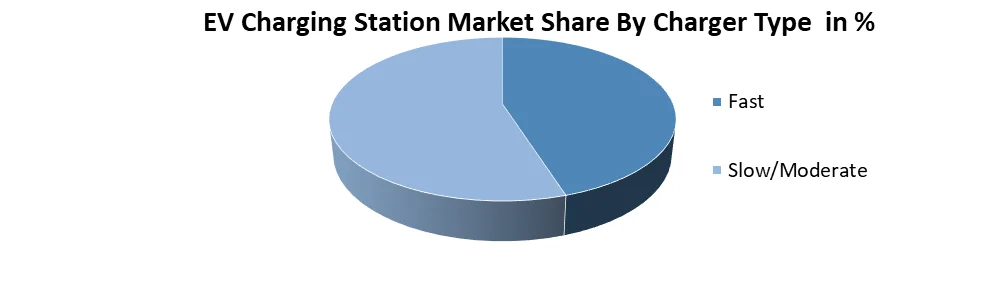
- Dominance of DC Fast Charging: DC chargers held approximately 78% of revenue share and are expected to continue rapid growth.
- Charger Adoption Gap: China leads with <10 EVs per charger; Europe averages 13 EVs per charger; Norway has the highest coverage with nearly 32 EVs per charger.
- Policy Momentum: EU mandates high-power fast chargers every 60 km on core road networks; U.S. NEVI programs target major corridor build-outs.
To get more Insights: Request Free Sample Report
EV Charging Station Market: Market Dynamics
Government Regulatory Support & Funding
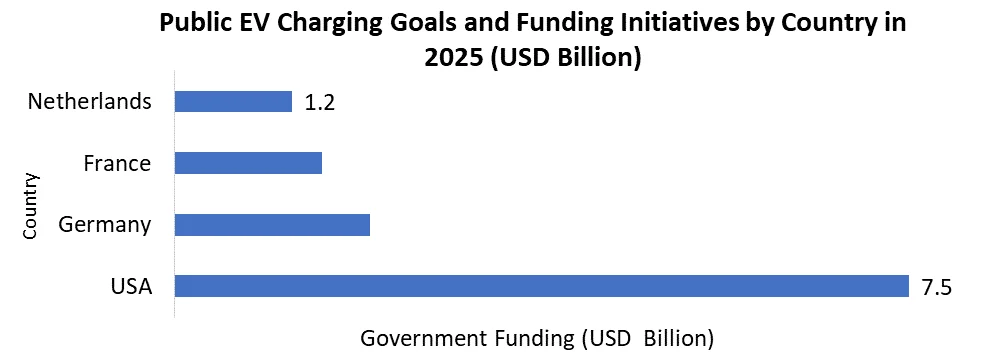
Government policies strongly support EV charging growth. In the United States, USD 7.5 billion in federal funding targets the installation of 500,000 public chargers by 2030, prioritising highways and underserved regions. In Europe, regulations mandate widespread deployment of high-power DC fast chargers, with networks required to support 400 kW+ output by 2027 along major corridors. Countries such as Germany, France, and the Netherlands provide subsidies and grid incentives, accelerating private investment and nationwide charging coverage.
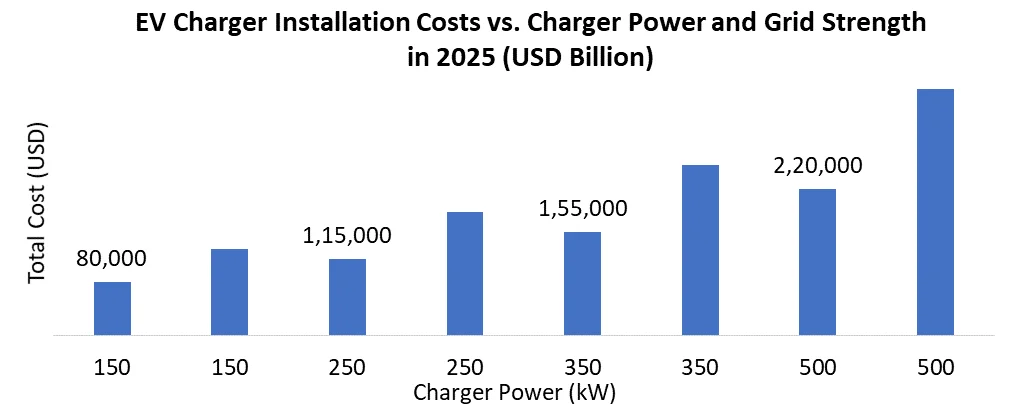
High Capital Expenditure & Grid Load Costs
Ultra-fast DC chargers, delivering 150–500 kW per unit, place substantial demand on local grids, often equivalent to a small industrial facility. Installing these chargers typically requires feeder and transformer upgrades costing USD 50,000–150,000 per site, in addition to hardware expenses of USD 30,000–70,000 per charger. In regions with weak or outdated distribution networks, these costs can double, slowing deployment timelines and increasing the payback period for operators, particularly for clusters exceeding 10–20 chargers.
Software-Driven Monetization
Advanced software solutions including dynamic pricing, reservation management, energy optimization, and predictive maintenance unlock additional revenue streams beyond hardware. Operators can monetize charging sessions more effectively, reduce downtime, and optimize grid interactions, enhancing overall profitability while improving user experience and operational efficiency.
Electric Vehicle Charging Station Market Segment Analysis:
By Charger Type : Slow/moderate chargers dominated the EV charging station market in 2025 due to lower installation costs, widespread residential and workplace use, easier grid integration, and strong government support. Fast chargers held a smaller share but are growing rapidly, driven by highway charging needs, fleet electrification, and demand for reduced charging time.
Electric Vehicle Charging Station Market Regional Analysis
The Asia-Pacific region accounted for xx % of the global EV charging station market in 2025, led by China’s scale with millions of chargers and aggressive government targets. India’s rapid build-out under PM eDrive and ASEAN’s combined 24,000 chargers reflect robust growth across emerging Asia.
Europe’s market exceeds 1 million public charging points, with robust growth in fast and ultra-fast segments. Policy frameworks like AFIR support expansion. Countries such as the Netherlands, Germany, and France are trailblazers, while Scandinavian regions show high EV cluster density.
North America is scaling rapidly. The U.S. charging network benefits from bipartisan funding, while Canada’s market tripled the number of public ports in recent years. South American markets, led by strategic acquisitions
Recent Country Developments
- China: Leader in installations with greater than 7.2M chargers and ambitious expansion of public and ultra-fast networks.
- India: PM eDrive aims for 72,300 charging stations nationwide with uniform standards and simplified approvals.
- Europe: AFIR mandates high-power chargers every 60 km, bolstering cross-border corridors.
- United States: NEVI funds accelerate highway fast chargers; GM and ChargePoint partnership will add up to 500 DC fast ports by end of 2025.
- Brazil: Weg acquires EV charging software firm Tupi Mob, with 370,000 users and 1.3M sessions, expanding regional connectivity.
Competitive Landscape
The global EV charging infrastructure market remains moderately consolidated, with a limited number of large players controlling a significant share while continuously investing in network expansion, power upgrades, and digital platforms.
- Tesla, Inc.: Operates one of the world’s largest fast-charging ecosystems, with 50,000–60,000 Superchargers by 2025, increasingly open to non-Tesla EVs. V3 and V4 chargers deliver up to 350 kW+. Five-year strategy focuses on global NACS standard adoption and increased ultra-fast charging density.
- ChargePoint, Inc.: Manages 225,000+ charging points across 14+ countries, emphasizing cloud-based software, smart energy management, and fleet charging. Plans include international expansion and vehicle-to-grid (V2G) integration.
- Shell Recharge: Operates approximately 700,000 charging points in 33 countries, leveraging fuel-retail footprint to deploy 350 kW ultra-fast corridors and transform stations into energy hubs.
- Electrify America: Manages 4,000+ DC fast chargers across 46 U.S. states, focusing on high-power charging and premium user experience.
- BP Pulse: Operates 8,000+ fast chargers, targeting 100,000 chargers by 2030 through large-scale commercial and mobility partnerships.
Global Electric Vehicle Charging Station Market Scope
|
Electric Vehicle Charging Station Market Scope |
|
|
Market Size in 2025 |
USD 27.3 Bn. |
|
Market Size in 2032 |
USD 67.89 Bn. |
|
CAGR (2026-2032) |
13.9% |
|
Historic Data |
2020-2025 |
|
Base Year |
2025 |
|
Forecast Period |
2026-2032 |
|
Segments Analysis |
By Charger Type Fast Slow/Moderate |
|
By Connection Phase Single Phase Three Phase |
|
|
By Connector J1772 Mennekes GB/T CCS1 CHAdeMO CCS2 Others |
|
|
By Level of Charging Level 1 Level 2 Level 3 |
|
|
By Vehicle Type Passenger Cars Commercial Vehicles |
|
|
By Propulsion BEV PHEV |
|
|
By Charging Service Type EV Charging Services Battery Swapping Services |
|
|
By Installation Type Portable Chargers Fixed Chargers |
|
|
By Operation Modes Mode 1 Mode 2 Mode 3 Mode 4 |
|
|
By Application Commercial Residential |
|
Global Electric Vehicle Charging Station Market
North America (United States, Canada, and Mexico)
Europe (UK, France, Germany, Italy, Spain, Sweden, Russia, and the Rest of Europe)
Asia Pacific (China, South Korea, Japan, India, Australia, Indonesia, Malaysia, Thailand, Vietnam, Philippines, and Rest of APAC)
Middle East and Africa (South Africa, GCC, Nigeria, Egypt, Turkey, and Rest of ME&A)
South America (Brazil, Argentina, Colombia, Chile, Peru, and the Rest of South America)
Electric Vehicle Charging Station Market Key Players
- Tesla, Inc.
- ChargePoint Holdings, Inc.
- Electrify America
- BP Pulse
- Shell Recharge
- ABB Ltd.
- Siemens AG
- Schneider Electric SE
- EVBox Group
- Blink Charging Co.
- Eaton Corporation
- Webasto Group
- Tritium Pty Ltd
- Kempower Oyj
- Wallbox Chargers
- Alfen N.V.
- Delta Electronics, Inc.
- SK Signet
- EVgo Services LLC
- IONITY
- Bosch (Robert Bosch GmbH)
- Leviton Manufacturing Co., Inc.
- NIO Power
- BYD Company Ltd.
- Hyundai Motor Company (Charging Solutions)
- Tata Power EZ Charge
- Exicom Tele-Systems Ltd.
- Ather Energy (Ather Grid)
- ChargeZone
- Statiq
Frequently Asked Questions
1. Global EV Charging Station Market: Research Methodology
2. Global EV Charging Station Market Introduction
2.1. Market Size (2025) & Forecast (2026-2032)
2.2. Market Size (USD) and Market Share (%) - By Segments, Regions and Country
2.3. Executive Summary
3. Global EV Charging Station Market: Competitive Landscape
3.1. SMR Competition Matrix
3.2. Competitive Landscape
3.3. Key Players Benchmarking
3.3.1. Company Name
3.3.2. Headquarter
3.3.3. Product Portfolio
3.3.4. Innovation
3.3.5. Sustainability & Certifications
3.3.6. Technology Adoption
3.3.7. Marketing & Promotional Activities
3.3.8. Distribution & Channel Strategy
3.3.9. Regulatory Compliance & Quality Standards
3.3.10. R&D Investment (%)
3.3.11. Pricing Strategy
3.3.12. Market Share (%)
3.3.13. Market Revenue (2025)
3.3.14. Global Presence
3.4. Market Structure
3.4.1. Market Leaders
3.4.2. Market Followers
3.4.3. Emerging Players
3.5. Mergers and Acquisitions Details
3.6. Recent Developments
3.7. Market Positioning & Share Analysis
3.7.1. Company Revenue, EV Charging Station Revenue, and Market Share (%)
3.7.2. SMR Competitive Positioning
3.8. Strategic Developments & Partnerships
4. EV Charging Station Market: Dynamics
4.1. EV Charging Station Market Trends
4.2. EV Charging Station Market Dynamics
4.2.1. North America
4.2.2. Europe
4.2.3. Asia Pacific
4.2.4. Middle East and Africa
4.2.5. South America
4.3. PORTER’s Five Forces Analysis
4.4. PESTLE Analysis
5. Global EV Charging Station Market Volume Analysis
5.1. Installed base of charging stations globally
5.2. Annual charging station deployment volume
5.3. Region-wise charger installation statistics
5.4. Public versus private charger volume comparison
5.5. Fast charger installation volume trends
5.6. Forecasted charging station installation volume
6. EV Charging Station Market Pricing Analysis
6.1. Average charging station installation cost
6.2. Hardware and software pricing breakdown
6.3. Regional pricing variations and cost drivers
6.4. Operational cost analysis for charging networks
6.5. Price trends across charger power ratings
7. Future pricing outlook and cost reductions
7.1. Demand and Supply Analysis
7.2. Global demand for EV charging infrastructure
7.3. Regional demand patterns by major economies
7.4. Supply capacity of charging equipment manufacturers
7.5. Demand-supply gap analysis by region
7.6. Country-level demand analysis for chargers
7.7. Future demand and supply balance outlook
8. Organized and Unorganized Market Analysis
8.1. Organized charging network operator presence
8.2. Unorganized local charging infrastructure providers
8.3. Pricing and service quality comparison
8.4. Challenges faced by unorganized market players
8.5. Market consolidation trends in organized sector
8.6. Transition from unorganized to organized networks
9. Global EV Charging Station Market: Size and Forecast by Segmentation (By Value USD Billion) (2025-2032)
9.1. Global EV Charging Station Market Size and Forecast, By Charger Type
9.1.1. Fast
9.1.2. Slow/Moderate
9.2. Global EV Charging Station Market Size and Forecast, By Connection Phase
9.2.1. Single Phase
9.2.2. Three Phase
9.3. Global EV Charging Station Market Size and Forecast, By Connector
9.3.1. J1772
9.3.2. Mennekes
9.3.3. GB/T
9.3.4. CCS1
9.3.5. CHAdeMO
9.3.6. CCS2
9.3.7. Tesla
9.4. Global EV Charging Station Market Size and Forecast, By Level of Charging
9.4.1. Level 1
9.4.2. Level 2
9.4.3. Level 3
9.5. Global EV Charging Station Market Size and Forecast, By Vehicle Type
9.5.1. Passenger Cars
9.5.2. Commercial Vehicles
9.6. Global EV Charging Station Market Size and Forecast, By Propulsion
9.6.1. BEV
9.6.2. PHEV
9.7. Global EV Charging Station Market Size and Forecast, By Charging Service Type
9.7.1. EV Charging Services
9.7.2. Battery Swapping Services
9.8. Global EV Charging Station Market Size and Forecast, By Installation Type
9.8.1. Portable Chargers
9.8.2. Fixed Chargers
9.9. Global EV Charging Station Market Size and Forecast, By Operation Modes
9.9.1. Mode 1
9.9.2. Mode 2
9.9.3. Mode 3
9.9.4. Mode 4
9.10. Global EV Charging Station Market Size and Forecast, By Application
9.10.1. Commercial
9.10.2. Residential
9.11. Global EV Charging Station Market Size and Forecast, By Region
9.11.1. North America
9.11.2. Europe
9.11.3. Asia Pacific
9.11.4. Middle East and Africa
9.11.5. South America
10. North America EV Charging Station Market Size and Forecast By Segmentation (By Value USD Billion) (2025-2032)
10.1. North America Market Size and Forecast, By Charger Type
10.2. North America Market Size and Forecast, By Connection Phase
10.3. North America Market Size and Forecast, By Connector
10.4. North America Market Size and Forecast, By Level of Charging
10.5. North America Market Size and Forecast, By Vehicle Type
10.6. North America Market Size and Forecast, By Propulsion
10.7. North America Market Size and Forecast, By Charging Service Type
10.8. North America Market Size and Forecast, By Installation Type
10.9. North America Market Size and Forecast, By Operation Modes
10.10. North America Market Size and Forecast, By Application
10.11. North America Market Size and Forecast, By Country
10.11.1. United States
10.11.2. Canada
10.11.3. Mexico
11. Europe EV Charging Station Market Size and Forecast By Segmentation (By Value USD Billion) (2025-2032)
11.1. Europe Market Size and Forecast, By Charger Type
11.2. Europe Market Size and Forecast, By Connection Phase
11.3. Europe Market Size and Forecast, By Connector
11.4. Europe Market Size and Forecast, By Level of Charging
11.5. Europe Market Size and Forecast, By Vehicle Type
11.6. Europe Market Size and Forecast, By Propulsion
11.7. Europe Market Size and Forecast, By Charging Service Type
11.8. Europe Market Size and Forecast, By Installation Type
11.9. Europe Market Size and Forecast, By Operation Modes
11.10. Europe Market Size and Forecast, By Application
11.11. Europe Market Size and Forecast, By Country
11.11.1. United Kingdom
11.11.2. France
11.11.3. Germany
11.11.4. Italy
11.11.5. Spain
11.11.6. Sweden
11.11.7. Russia
11.11.8. Rest of Europe
12. Asia Pacific EV Charging Station Market Size and Forecast By Segmentation (By Value USD Billion) (2025-2032)
12.1. Asia Pacific Market Size and Forecast, By Charger Type
12.2. Asia Pacific Market Size and Forecast, By Connection Phase
12.3. Asia Pacific Market Size and Forecast, By Connector
12.4. Asia Pacific Market Size and Forecast, By Level of Charging
12.5. Asia Pacific Market Size and Forecast, By Vehicle Type
12.6. Asia Pacific Market Size and Forecast, By Propulsion
12.7. Asia Pacific Market Size and Forecast, By Charging Service Type
12.8. Asia Pacific Market Size and Forecast, By Installation Type
12.9. Asia Pacific Market Size and Forecast, By Operation Modes
12.10. Asia Pacific Market Size and Forecast, By Application
12.11. Asia Pacific Market Size and Forecast, By Country
12.11.1. China
12.11.2. Japan
12.11.3. South Korea
12.11.4. India
12.11.5. Australia
12.11.6. Malaysia
12.11.7. Thailand
12.11.8. Vietnam
12.11.9. Indonesia
12.11.10. Philippines
12.11.11. Rest of Asia Pacific
13. Middle East and Africa EV Charging Station Market Size and Forecast By Segmentation (By Value USD Billion) (2025-2032)
13.1. Middle East and Africa Market Size and Forecast, By Charger Type
13.2. Middle East and Africa Market Size and Forecast, By Connection Phase
13.3. Middle East and Africa Market Size and Forecast, By Connector
13.4. Middle East and Africa Market Size and Forecast, By Level of Charging
13.5. Middle East and Africa Market Size and Forecast, By Vehicle Type
13.6. Middle East and Africa Market Size and Forecast, By Propulsion
13.7. Middle East and Africa Market Size and Forecast, By Charging Service Type
13.8. Middle East and Africa Market Size and Forecast, By Installation Type
13.9. Middle East and Africa Market Size and Forecast, By Operation Modes
13.10. Middle East and Africa Market Size and Forecast, By Application
13.11. Middle East and Africa Market Size and Forecast, By Country
13.11.1. South Africa
13.11.2. GCC
13.11.3. Nigeria
13.11.4. Egypt
13.11.5. Turkey
13.11.6. Rest of ME&A
14. South America EV Charging Station Market Size and Forecast By Segmentation (By Value USD Billion) (2025-2032)
14.1. South America Market Size and Forecast, By Charger Type
14.2. South America Market Size and Forecast, By Connection Phase
14.3. South America Market Size and Forecast, By Finish
14.4. South America Market Size and Forecast, By Level of Charging
14.5. South America Market Size and Forecast, By Vehicle Type
14.6. South America Market Size and Forecast, By Propulsion
14.7. South America Market Size and Forecast, By Charging Service Type
14.8. South America Market Size and Forecast, By Installation Type
14.9. South America Market Size and Forecast, By Operation Modes
14.10. South America Market Size and Forecast, By Application
14.11. South America Market Size and Forecast, By Country
14.11.1. Brazil
14.11.2. Argentina
14.11.3. Colombia
14.11.4. Chile
14.11.5. Rest Of South America
15. Company Profile: Key Players
15.1. Tesla, Inc.
15.1.1. Company Overview
15.1.2. Business Portfolio
15.1.3. Financial Overview
15.1.4. SWOT Analysis
15.1.5. Strategic Analysis
15.1.6. Recent Developments
15.2. ChargePoint Holdings, Inc.
15.3. Electrify America
15.4. BP Pulse
15.5. Shell Recharge
15.6. ABB Ltd.
15.7. Siemens AG
15.8. Schneider Electric SE
15.9. EVBox Group
15.10. Blink Charging Co.
15.11. Eaton Corporation
15.12. Webasto Group
15.13. Tritium Pty Ltd
15.14. Kempower Oyj
15.15. Wallbox Chargers
15.16. Alfen N.V.
15.17. Delta Electronics, Inc.
15.18. SK Signet
15.19. EVgo Services LLC
15.20. IONITY
15.21. Bosch (Robert Bosch GmbH)
15.22. Leviton Manufacturing Co., Inc.
15.23. NIO Power
15.24. BYD Company Ltd.
15.25. Hyundai Motor Company (Charging Solutions)
15.26. Tata Power EZ Charge
15.27. Exicom Tele-Systems Ltd.
15.28. Ather Energy (Ather Grid)
15.29. ChargeZone
15.30. Statiq
16. Key Findings
17. Industry Recommendations