E-SUV Market Electric SUVs Move to Center Stage in the Global EV Transition
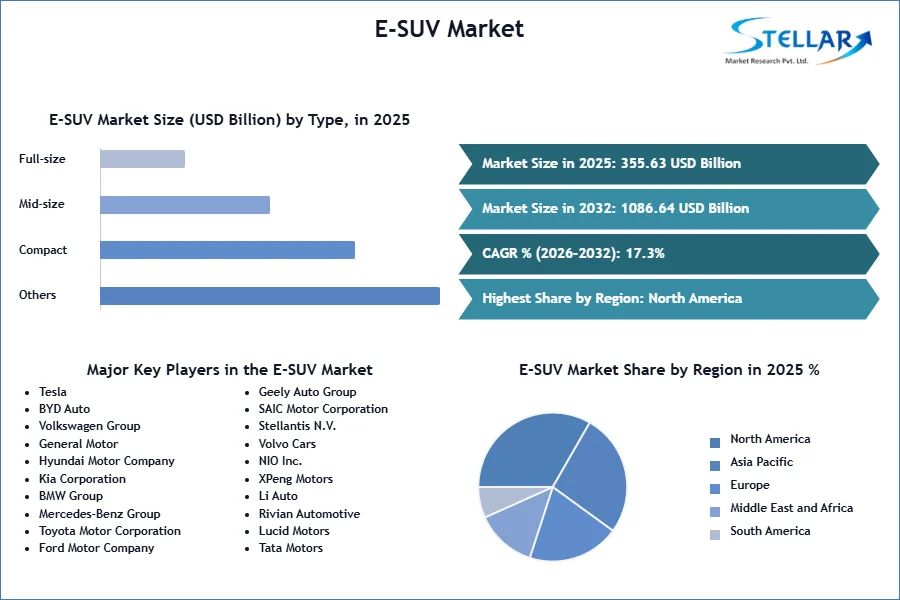
global electric SUV (e-SUV) market size was valued at USD 355.63 Bn. in 2025, and theelectric SUV (e-SUV) market revenue is expected to grow at a CAGR of 17.3% from 2026 to 2032, reaching nearly USD 1086.64 Bn.
E-SUV Market Overview
Electric SUVs have evolved into the most commercially scalable EV body type worldwide. In 2018, electric SUVs accounted for less than 10% of global EV sales, largely concentrated in high-income markets such as Norway, the United States, and Western Europe. By 2024, this segment emerged as the backbone of global EV adoption.
Globally, nearly 60 million electric cars are now on the road, more than doubling from 26 million units in 2022, with SUVs contributing a rapidly rising share of new registrations. China remains the dominant manufacturing hub, accounting for over 70% of global EV production, supported by cost-efficient supply chains and strong domestic demand. The European Union and North America continue to exhibit strong demand but face supply and infrastructure constraints. By 2030, compact and mid-size electric SUVs priced below USD 40,000 are expected to define mass-market adoption across both developed and emerging economies.
Key Market Highlights
- Global EV sales grew at a CAGR of nearly 32% between 2020 and 2025
- China led global EV sales in 2024 with 11.3 million units, accounting for nearly 60% of total demand
- Europe recorded 68% BEV penetration within total EV sales
- The United States EV sales share stagnated at nearly 9% in H1 2025, driven by policy uncertainty
- Emerging markets such as Vietnam (35%) and Thailand (22%) surpassed the U.S. in EV sales share
To get more Insights: Request Free Sample Report
Trend: Surge in Demand for Compact and Affordable Electric SUVs
The surge in compact and affordable electric SUVs represents one of the most defining trends shaping the market in 2024–2026. As battery costs decline and OEMs prioritize volume-driven strategies, affordable e-SUVs are becoming accessible to a wider consumer base.
- In China, nearly 66% of EVs sold in 2024 were priced below USD 30,000, led by models such as BYD Yuan Plus, Tesla Model Y, and Aion Y
- In Europe, compact electric SUVs priced below EUR 40,000 gained traction through subsidy extensions in Germany and Spain (2025)
- In emerging markets, Chinese electric SUVs priced between USD 20,000–25,000 dominated imports across Brazil, Thailand, and Indonesia
This shift highlights a strategic move away from premium positioning toward mass-market scalability.
Top Affordable Electric SUVs
|
Model |
Size Category |
Approx MSRP (Base) |
Luxury Level |
EPA Range (Miles) |
|
2026 Nissan Leaf |
Subcompact |
~$26,000 |
Basic / Value |
259–303 |
|
2026 Volvo EX30 |
Subcompact |
~$40,345 |
Mid-range |
227–261 |
|
2026 Kia Niro EV |
Subcompact |
~$41,000 |
Mid-range |
253–260 |
|
2026 Hyundai Kona Electric |
Subcompact |
~$35,000 |
Basic / Practical |
200-319 |
|
2026 Toyota bZ |
Compact |
~$36,350 |
Basic |
236–314 |
E-SUV Market Dynamics:
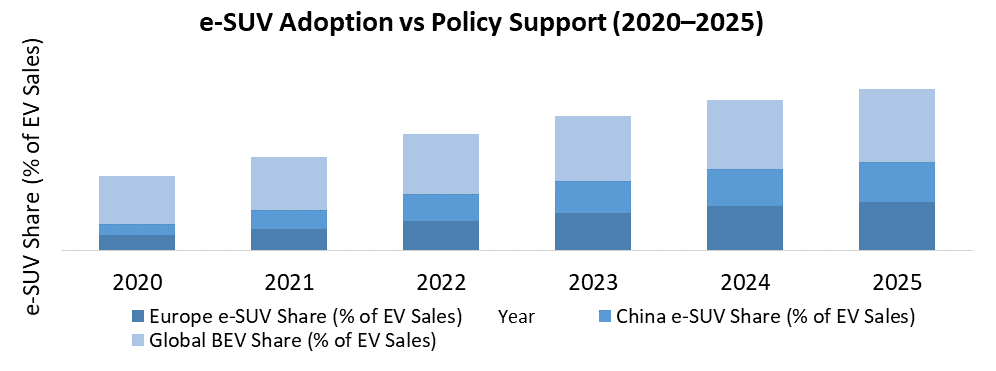
Environmental Awareness and Policy Support: Climate concerns and stricter emission regulations continue to accelerate electric SUV adoption. EU fleet CO2 targets for 2025–2027 compelled OEMs to prioritize electric SUVs in their portfolios. In H1 2025, BEVs accounted for 68% of European EV sales, supported by subsidy extensions in Germany and Spain. China further strengthened demand through purchase tax exemptions and license plate incentives.
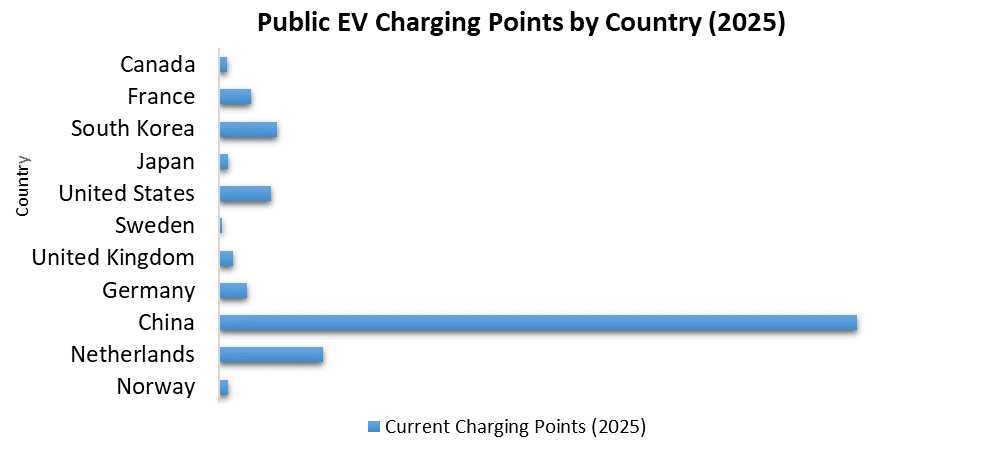
Limited Charging Infrastructure: Despite rapid adoption, charging infrastructure remains a bottleneck in several regions. India has fewer than 3 public chargers per 100 EVs, while Brazil and Indonesia face similar gaps. Globally, charging infrastructure must expand nearly ninefold by 2030 to sustain projected EV growth.
Rapid Electric SUV Adoption Across Emerging Economies: Emerging economies represent long-term growth opportunities. Vietnam recorded 35% electric SUV penetration, Thailand 22%, and India sold over 40,000 electric SUVs in Q1 2025 alone. Competitive pricing, lower operating costs, and government incentives are accelerating middle-class adoption.
E-SUV Market Segment Analysis
Adoption, Penetration, and Utilization Trends by Propulsion Type (2025–2032) – Electric SUV Market
BEVs accounted for approximately XX% of the electric SUV market in 2025 and are expected to grow at a CAGR of XX% from 2026 to 2032. Growth is driven by advances in battery energy density, improved driving ranges, and expanding fast-charging networks. By 2032, BEVs are expected to dominate the electric SUV market due to favorable regulations, declining ownership costs, and zero-emission mandates.

Regional Analysis: Electric SUV Market
The global electric SUV market is influenced by regional policies, infrastructure development, and consumer adoption trends. Europe and China lead in both volume and value in 2025. Due to strong government incentives, advanced EV manufacturing, and high urban EV demand. Emerging markets are showing rapid growth, driven by affordable models and rising environmental awareness, while North America experiences moderate adoption due to regulatory uncertainty and charging gaps.
- Europe leads the global market, with electric SUVs contributing over 45% of EV sales in H1 2025. Strict emission regulations and generous subsidies in Germany and Spain continue to support adoption.
- China & North America: China accounts for 30% of new SUV sales, supported by domestic OEMs such as BYD and NIO. The U.S. lags with Nearly 9% EV penetration, constrained by policy uncertainty and uneven charging infrastructure.
- Emerging Markets: Vietnam (35%), Thailand (22%), and India (4%) are witnessing rapid growth driven by affordable electric SUV imports, fiscal incentives, and rising urban demand.
Competitive Landscape:
Competition in the electric SUV market is intensifying as OEMs shift from premium-focused offerings to volume-led strategies. Automakers are emphasizing affordability, extended range (>500 km), charging partnerships, and fleet-based adoption models. Recent developments include municipal fleet electrification in Europe and corporate mandates driving adoption of models such as the BMW iX and Audi e-tron.
Top Electric SUV Companies and Growth Outlook
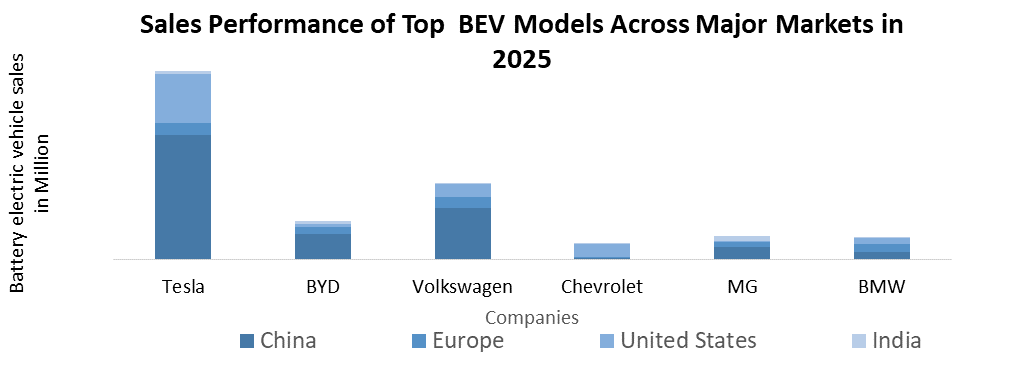
- BYD – Leads the affordable e-SUV segment with a nearly 60% EV sales CAGR; strong presence in China and Southeast Asia
- Tesla – Model Y and Model X remain global leaders despite a U.S. sales slowdown in H1 2025
- SAIC Motor – Dominates Thailand’s EV market with models such as MG ZS EV
- Volkswagen Group – Europe EV share rose to 14% in H1 2025, driven by ID.4 and ID.5
- Stellantis – Compact electric SUVs such as Jeep Avenger and Peugeot e-2008 lead growth
Strengths Assessment of Leading Players in the Electric Vehicle Industry

E- SUV Market Scope
|
E- SUV Market |
|||
|
This Report Covers |
Details |
||
|
Base Year: |
2025 |
Forecast Period: |
2026-2032 |
|
Historical Data: |
2020 to 2025 |
Market Size in 2025: |
USD 355.63 Billion |
|
Forecast Period 2026 to 2032 CAGR: |
17.3% |
Market Size in 2032: |
USD 1086.64 Billion |
|
E- SUV Market Segments Covered: |
By Vehicle Type |
Compact Mid-size Full-size |
|
|
By Propulsion Type |
Battery Electric Vehicle (BEV) Plug-in Hybrid Electric Vehicle (PHEV) Others |
||
|
By Vehicle Range |
Up to 250 Miles 250-500 Mile Above 500 Miles |
||
|
By Drive Type
|
FWD (Front-Wheel Drive) RWD (Rear-Wheel Drive) AWD (All-Wheel Drive) |
||
|
By Components |
Body Chassis Powertrain ICE Motor Up to 20 kW 20 to 100 kW Above 100 kW Battery Upto 10 kWh 10 to 30 KWh 30 to 60 kWh Above 60 KWh Electronics Others |
||
E- SUV Market, by region
North America (United States, Canada and Mexico)
Europe (UK, France, Germany, Italy, Spain, Sweden, Russia and Rest of Europe)
Asia Pacific (China, South Korea, Japan, India, Australia, Indonesia, Malaysia, Vietnam, and Rest of APAC)
South America (Brazil, Argentina, Rest of South America)
Middle East and Africa (South Africa, GCC, Egypt, Nigeria, Rest of MEA)
E- SUV industry key Players
- Tesla
- BYD Auto
- Volkswagen Group
- General Motor
- Hyundai Motor Company
- Kia Corporation
- BMW Group
- Mercedes-Benz Group
- Toyota Motor Corporation
- Ford Motor Company
- Geely Auto Group
- SAIC Motor Corporation
- Stellantis N.V.
- Volvo Cars
- NIO Inc.
- XPeng Motors
- Li Auto
- Rivian Automotive
- Lucid Motors
- Tata Motors
- Mahindra & Mahindra
- Renault Group
- Nissan Motor Corporation
- Honda Motor Company
- Chery Automobile
- Great Wall Motors
- VinFast
- Polestar
- Lotus Technology
- Subaru Corporation
- Others
Frequently Asked Questions
China leads in manufacturing and sales volume, while Europe leads in regulatory-driven adoption.
Yes, OEMs are increasingly prioritizing compact and mid-size electric SUVs under USD 40,000 to drive volume growth.
Battery Electric Vehicles (BEVs) dominate due to zero-emission policies and improving range capabilities.
Charging infrastructure gaps and policy uncertainty in select markets remain key challenges.
1. E- SUV Market Introduction
1.1. Study Assumption and Market Definition
1.2. Scope of the Study
1.3. Executive Summary
2. Global E- SUV Market: Competitive Landscape
2.1. SMR Competition Matrix
2.2. Key Players Benchmarking
2.2.1. Company Name
2.2.2. Headquarter
2.2.3. Product Segment
2.2.4. End-User Segment
2.2.5. Revenue Details in 2025
2.2.6. Market Share (%)
2.2.7. Growth Rate (%)
2.2.8. Return on Investment (%)
2.2.9. Technological Capabilities
2.2.10. Geographical Presence
2.3. Market Structure
2.3.1. Market Leaders
2.3.2. Market Followers
2.3.3. Emerging Players
2.4. Mergers and Acquisitions Details
3. E- SUV Market: Dynamics
3.1. E- SUV Market Trends
3.2. E- SUV Market Dynamics
3.2.1. Drivers
3.2.2. Restraints
3.2.3. Opportunities
3.2.4. Challenges
3.3. PORTER’s Five Forces Analysis
3.4. PESTLE Analysis
3.5. Key Opinion Leader Analysis for the Global Industry
3.6. Analysis of Government Schemes and Initiatives for Industry
4. Pricing & Cost Structure Analysis (2025)
4.1. Average selling price trends
4.2. Battery cost impact
4.3. Manufacturing cost structure
4.4. Regional price variations
4.5. Incentive-driven pricing
4.6. Future pricing outlook
5. Technology Landscape
5.1. Battery chemistry trends
5.2. Powertrain innovations
5.3. Charging technology
5.4. Software & connectivity
5.5. Lightweight materials
5.6. Energy efficiency improvements
6. Battery & Charging Infrastructure Analysis
6.1. Battery capacity trends
6.2. Fast-charging adoption
6.3. Charging network expansion
6.4. Home vs public charging
6.5. Battery lifecycle management
6.6. Recycling & sustainability
7. Range & Performance Benchmarking (2025)
7.1. Driving range comparison
7.2. Acceleration performance
7.3. Energy consumption metrics
7.4. Thermal management systems
7.5. Terrain adaptability
7.6. Real-world performance analysis
8. Regulatory & Policy Framework
8.1. Global EV regulations
8.2. Emission standards impact
8.3. Subsidies & incentives
8.4. Import–export policies
8.5. Safety regulations
8.6. Policy outlook
9. Sustainability & Environmental Impact
9.1. Carbon footprint analysis
9.2. Lifecycle emission assessment
9.3. Sustainable materials usage
9.4. Battery recycling practices
9.5. ESG compliance trends
9.6. Environmental benefits assessment
10. Consumer Behavior & Adoption Trends (2025)
10.1. Purchase decision factors
10.2. Price sensitivity analysis
10.3. Brand perception
10.4. Urban vs rural adoption
10.5. Fleet adoption trends
10.6. Ownership cost analysis
11. Sales & Distribution Channels in (2025)
11.1. OEM direct sales
11.2. Dealer-based sales
11.3. Online sales platforms
11.4. Subscription models
11.5. Fleet sales channels
11.6. After-sales networks
12. E- SUV Market: Global Market Size and Forecast by Segmentation (by Value in USD Billion and Volume in 000’Units) (2026-2032)
12.1. E- SUV Market Size and Forecast, By Vehicle Type (2026-2032)
12.1.1. High Carbon FeMn
12.1.2. Medium Carbon FeMn
12.1.3. Low Carbon FeMn
12.2. E- SUV Market Size and Forecast, By Propulsion Type (2026-2032)
12.2.1. Battery Electric Vehicle (BEV)
12.2.2. Plug-in Hybrid Electric Vehicle (PHEV)
12.2.3. Other
12.3. E- SUV Market Size and Forecast, By Vehicle Range (2026-2032)
12.3.1. Up to 250 Miles
12.3.2. 250-500 Mile
12.3.3. Above 500 Miles
12.4. E- SUV Market Size and Forecast, By Drive Type (2026-2032)
12.4.1. FWD (Front-Wheel Drive)
12.4.2. RWD (Rear-Wheel Drive)
12.4.3. AWD (All-Wheel Drive)
12.5. E- SUV Market Size and Forecast, By Components (2026-2032)
12.5.1. Body
12.5.2. Chassis
12.5.3. Powertrain
12.5.3.1. ICE
12.5.3.2. Motor
12.5.3.2.1. Up to 20 kW
12.5.3.2.2. 20 to 100 kW
12.5.3.2.3. Above 100 kW
12.5.4. Battery
12.5.4.1. Upto 10 kWh
12.5.4.2. 10 to 30 KWh
12.5.4.3. 30 to 60 kWh
12.5.4.4. Above 60 KWh
12.5.5. Electronics
12.5.6. Others
12.6. E- SUV Market Size and Forecast, By Region (2026-2032)
12.6.1. North America
12.6.2. Europe
12.6.3. Asia Pacific
12.6.4. Middle East and Africa
12.6.5. South America
13. North America E- SUV Market Size and Forecast by Segmentation (by Value in USD Billion and Volume in 000’Units) (2026-2032)
13.1. North America E- SUV Market Size and Forecast, By Vehicle Type (2026-2032)
13.2. North America E- SUV Market Size and Forecast, By Propulsion Type (2026-2032)
13.3. North America E- SUV Market Size and Forecast, By Vehicle Range (2026-2032)
13.4. North America E- SUV Market Size and Forecast, By Drive Type (2026-2032)
13.5. North America E- SUV Market Size and Forecast, By Components (2026-2032)
13.6. North America E- SUV Market Size and Forecast, by Country (2026-2032)
13.6.1. United States
13.6.2. Canada
13.6.3. Mexico
14. Europe E- SUV Market Size and Forecast by Segmentation (by Value in USD Billion and Volume in 000’Units) (2026-2032)
14.1. Europe E- SUV Market Size and Forecast, By Vehicle Type (2026-2032)
14.2. Europe E- SUV Market Size and Forecast, By Propulsion Type (2026-2032)
14.3. Europe E- SUV Market Size and Forecast, By Vehicle Range (2026-2032)
14.4. Europe E- SUV Market Size and Forecast, By Drive Type (2026-2032)
14.5. Europe E- SUV Market Size and Forecast, By Components (2026-2032)
14.6. Europe E- SUV Market Size and Forecast, by Country (2026-2032)
14.6.1. United Kingdom
14.6.1.1. United Kingdom E- SUV Market Size and Forecast, By Vehicle Type (2026-2032)
14.6.1.2. United Kingdom E- SUV Market Size and Forecast, By Propulsion Type (2026-2032)
14.6.1.3. United Kingdom E- SUV Market Size and Forecast, By Vehicle Range (2026-2032)
14.6.1.4. United Kingdom E- SUV Market Size and Forecast, By Drive Type (2026-2032)
14.6.1.5. United Kingdom E- SUV Market Size and Forecast, By Components (2026-2032)
14.6.2. France
14.6.3. Germany
14.6.4. Italy
14.6.5. Spain
14.6.6. Sweden
14.6.7. Russia
14.6.8. Rest of Europe
15. Asia Pacific E- SUV Market Size and Forecast by Segmentation (by Value in USD Billion and Volume in 000’Units) (2026-2032)
15.1. Asia Pacific E- SUV Market Size and Forecast, By Vehicle Type (2026-2032)
15.2. Asia Pacific E- SUV Market Size and Forecast, By Propulsion Type (2026-2032)
15.3. Asia Pacific E- SUV Market Size and Forecast, By Vehicle Range (2026-2032)
15.4. Asia Pacific E- SUV Market Size and Forecast, By Drive Type (2026-2032)
15.5. Asia Pacific E- SUV Market Size and Forecast, By Components (2026-2032)
15.6. Asia Pacific E- SUV Market Size and Forecast, by Country (2026-2032)
15.6.1. China
15.6.2. S Korea
15.6.3. Japan
15.6.4. India
15.6.5. Australia
15.6.6. Indonesia
15.6.7. Malaysia
15.6.8. Philippines
15.6.9. Thailand
15.6.10. Vietnam
15.6.11. Rest of Asia Pacific
16. Middle East and Africa E- SUV Market Size and Forecast (by Value in USD Billion and Volume in 000’Units) (2026-2032)
16.1. Middle East and Africa E- SUV Market Size and Forecast, By Vehicle Type (2026-2032)
16.2. Middle East and Africa E- SUV Market Size and Forecast, By Propulsion Type (2026-2032)
16.3. Middle East and Africa E- SUV Market Size and Forecast, By Vehicle Range (2026-2032)
16.4. Middle East and Africa E- SUV Market Size and Forecast, By Drive Type (2026-2032)
16.5. Middle East and Africa E- SUV Market Size and Forecast, By Components (2026-2032)
16.6. Middle East and Africa E- SUV Market Size and Forecast, by Country (2026-2032)
16.6.1. South Africa
16.6.2. GCC
16.6.3. Egypt
16.6.4. Nigeria
16.6.5. Rest of ME&A
17. South America E- SUV Market Size and Forecast by Segmentation (by Value in USD Billion and Volume in 000’Units) (2026-2032)
17.1. South America E- SUV Market Size and Forecast, By Vehicle Type (2026-2032)
17.2. South America E- SUV Market Size and Forecast, By Propulsion Type (2026-2032)
17.3. South America E- SUV Market Size and Forecast, By Vehicle Range (2026-2032)
17.4. South America E- SUV Market Size and Forecast, By Drive Type (2026-2032)
17.5. South America E- SUV Market Size and Forecast, By Components (2026-2032)
17.6. South America E- SUV Market Size and Forecast, by Country (2026-2032)
17.6.1. Brazil
17.6.2. Argentina
17.6.3. Colombia
17.6.4. Chile
17.6.5. Rest Of South America
18. Company Profile: Key Players
18.1. Tesla
18.1.1. Company Overview
18.1.2. Business Portfolio
18.1.3. Financial Overview
18.1.4. SWOT Analysis
18.1.5. Strategic Analysis
18.1.6. Recent Developments
18.1.7. BYD Auto
18.2. Volkswagen Group
18.3. General Motor
18.4. Hyundai Motor Company
18.5. Kia Corporation
18.6. BMW Group
18.7. Mercedes-Benz Group
18.8. Toyota Motor Corporation
18.9. Ford Motor Company
18.10. Geely Auto Group
18.11. SAIC Motor Corporation
18.12. Stellantis N.V.
18.13. Volvo Cars
18.14. NIO Inc.
18.15. XPeng Motors
18.16. Li Auto
18.17. Rivian Automotive
18.18. Lucid Motors
18.19. Tata Motors
18.20. Mahindra & Mahindra
18.21. Renault Group
18.22. Nissan Motor Corporation
18.23. Honda Motor Company
18.24. Chery Automobile
18.25. Great Wall Motors
18.26. VinFast
18.27. Polestar
18.28. Lotus Technology
18.29. Subaru Corporation
18.30. Others
19. Key Findings
20. Analyst Recommendations
21. E- SUV Market: Research Methodology