Predictive Maintenance in Automotive Market Perspective on Upcoming Impacts and Forecast Analysis (2026-2032) by Application, Hardware Type, Vehicle Type, Deployment Type, and Region
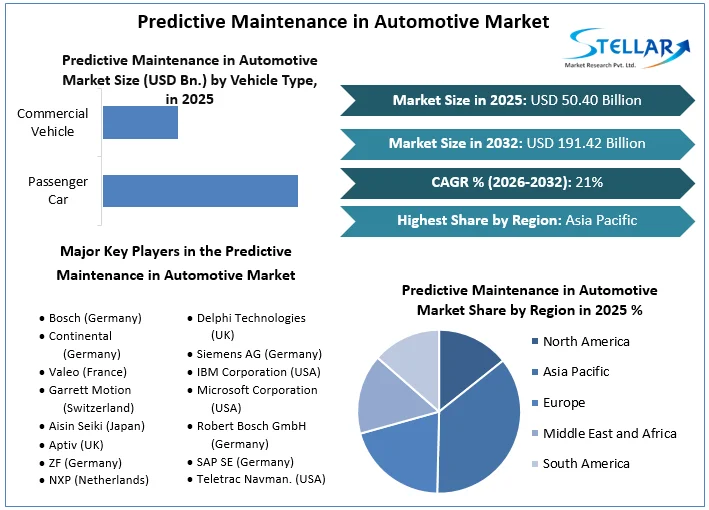
Predictive Maintenance in Automotive Market size was valued at US$ 50.40 Billion in 2025 and the total Predictive Maintenance in Automotive Market revenue is expected to grow at 21% through 2026 to 2032, reaching nearly US$ 191.42 Billion.
Predictive Maintenance in Automotive Market Overview:
Predictive Maintenance is a set of procedures for detecting abnormalities and flaws in the state of in-service equipment and determining when maintenance should be carried out. It is a cost-cutting method since it allows you to correct a problem before it becomes a failure. Predictive maintenance use statistical process control principles to examine equipment and forecast when maintenance operations should be performed. Predictive maintenance in the automotive sector works by first monitoring and analyzing the entire operation. It then collects and saves the information before making a significant prediction. Overall, the procedure goes without a hitch and without major snags. Predictive Maintenance in Automotive market is expected to register CAGR of 21% during the forecast period.
To get more Insights: Request Free Sample Report
Predictive Maintenance in Automotive Market Dynamics:
If there is scheduled or unscheduled downtime in an automotive production setting, the costs associated with it might cause a major setback. It is feasible to continuously monitor the condition of industrial equipment in real time and estimate the likelihood of problems using predictive maintenance. This increases operational efficiency while lowering equipment maintenance costs.
Emergence of Digital Twin (DT) Technology:
On the manufacturing floor, the use of sensors and Industrial IoT has allowed companies to diagnose the health of each piece of gear in great detail. We will discuss Digital Twin technology in this context, which can be used to gain useful insights on industrial equipment.
The use of simulation techniques to create a "digital twin" - an elaborate physical and functional description of a physical system with all of its operating data — is part of Digital Twin technology. In other terms, a digital twin is a digital model of a physical asset that correctly represents the capabilities, operating state, and health of its physical counterpart.
PDM and Vehicle Servicing:
When technical developments like as Over the Air (OTA) updates are connected with automobiles, car owners no longer need to take their vehicles to a service shop for routine maintenance. They should only go to the service centres for critical or emergency maintenance. Predictive maintenance has shown to be quite effective in providing these benefits to vehicle owners. The data acquired by the sensors, for example, could suggest gradual overheating or friction in car components. This can lead to the vehicle or individual part completely breaking down over time. The integrated machine learning algorithm monitors breakdown events in real time and analyses how frequently they occur. The system then forecasts when the next breakdown will occur based on this information.
Vehicle Recalls and Predictive Maintenance:
Vehicle owners benefit greatly from predictive maintenance. However, it should be noted that following the sale of automobiles, automotive OEMs and technology businesses benefit from the use of this technology. As connected car in-vehicle diagnostic systems get more sophisticated, the vehicle will be able to send signals when components or maintenance are required. As a result, there are fewer unforeseen failures and vehicle recalls. Another benefit of PDM is that it only sends out alerts when a servicing action is truly required. It lowers the cost of over-maintenance and no-fault-found occurrences for the owner.
Predictive Maintenance in Automotive Market Segmentation:
By Application: The predictive vehicle technology market is likely to be dominated by the safety and security sector:
Automakers throughout the world are likely to integrate safety and security as an ADAS function in the next years. These features are primarily designed to aid the driver by providing predictive cues. In developed countries, car occupants are expecting similar capabilities in their automobiles. In developing regions, on the other hand, OEMs are including these features in their automobiles. Government mandates are supporting the expansion of the safety & security segment, as traffic congestion is a major concern in every region, propelling the category's growth.

By Vehicle Type: During the forecast period, the commercial vehicle segment is expected to grow at the quickest rate:
During the projected period, the commercial vehicle sector is expected to lead the predictive vehicle technology market. Telematics is becoming more common in commercial vehicles as it contributes to fleet safety. Satellite navigation, GPS location monitoring, and infotainment are the key features. The ability to track a vehicle's location in real time is essential for alerting drivers about impending traffic, car accidents, weather problems, and congested routes. Government rules in developed nations encourage and frequently require the integration of commercial telematics into new vehicles, which benefits the global commercial telematics market. These reasons have propelled the commercial vehicle market's quickest growth.
Predictive Maintenance in Automotive Market Regional Insights:
Asia-Pacific segment is expected to grow at a significant rate:
By 2032, the Asia Pacific region is expected to be the largest market. China and India, two of the world's fastest growing economies, are part of the region. In addition, the Asia Pacific area is the largest market for automobiles, thanks to rising consumer purchasing power, which has fueled demand for automobiles in the region. In addition, the industry is growing due to rising sales of commercial vehicles and passenger cars in the region. The region's countries are encouraging the integration of commercial telematics into new vehicles, which will benefit the worldwide commercial telematics industry. To meet the demand for modern telematics systems in the subcontinent, many European and North American OEMs are entering the market.
The European automotive predictive maintenance market was valued at US$ 76 million in 2020, and is predicted to grow at a value CAGR of 29% over the forecast period. This is due to the region's rapid adoption of pollution control measures, which has influenced how car exhaust systems are maintained. The use of automotive predictive maintenance in exhaust systems is seen as a crucial reason in Europe's emergence as a profitable regional market in the global landscape.
The objective of the report is to present a comprehensive analysis of the Predictive Maintenance in Automotive Market to the stakeholders in the industry. The report provides trends that are most dominant in the Predictive Maintenance in Automotive Market and how these trends will influence new business investments and market development throughout the forecast period. The report also aids in the comprehension of the Predictive Maintenance in Automotive Market dynamics and competitive structure of the market by analyzing market leaders, market followers, and regional players.
The qualitative and quantitative data provided in the Predictive Maintenance in Automotive Market report is to help understand which market segments, regions are expected to grow at higher rates, factors affecting the market, and key opportunity areas, which will drive the industry and market growth through the forecast period. The report also includes the competitive landscape of key players in the industry along with their recent developments in the Predictive Maintenance in Automotive Market. The report studies factors such as company size, market share, market growth, revenue, production volume, and profits of the key players in the Predictive Maintenance in Automotive Market.
The report provides Porter's Five Force Model, which helps in designing the business strategies in the market. The report helps in identifying how many rivals are existing, who they are, and how their product quality is in the Market. The report also analyses if the Predictive Maintenance in Automotive Market is easy for a new player to gain a foothold in the market, do they enter or exit the market regularly if the market is dominated by a few players, etc.
The report also includes a PESTEL Analysis, which aids in the development of company strategies. Political variables help in figuring out how much a government can influence the Market. Economic variables aid in the analysis of economic performance drivers that have an impact on the Market. Understanding the impact of the surrounding environment and the influence of environmental concerns on the Predictive Maintenance in Automotive Market is aided by legal factors.
Predictive Maintenance in Automotive Market Scope:
|
Predictive Maintenance in Automotive Market |
|
|
Market Size in 2025 |
USD 50.40 Bn. |
|
Market Size in 2032 |
USD 191.42 Bn. |
|
CAGR (2026-2032) |
21 % |
|
Historic Data |
2020-2025 |
|
Base Year |
2025 |
|
Forecast Period |
2026-2032 |
|
Segment Scope |
By Vehicle Type
|
|
By Hardware
|
|
|
By Deployment Type
|
|
|
By Application
|
|
|
Regional Scope |
North America- United States, Canada, and Mexico Europe – UK, France, Germany, Italy, Spain, Sweden, Austria, and Rest of Europe Asia Pacific – China, India, Japan, South Korea, Australia, ASEAN, Rest of APAC Middle East and Africa - South Africa, GCC, Egypt, Nigeria, Rest of the Middle East and Africa South America – Brazil, Argentina, Rest of South America |
Predictive Maintenance in Automotive Market Players:
- Bosch (Germany)
- Continental (Germany)
- Valeo (France)
- Garrett Motion (Switzerland)
- Aisin Seiki (Japan)
- Aptiv (UK)
- ZF (Germany)
- NXP (Netherlands)
- Delphi Technologies (UK)
- Siemens AG (Germany)
- IBM Corporation (USA)
- Microsoft Corporation (USA)
- Robert Bosch GmbH (Germany)
- SAP SE (Germany)
- Teletrac Navman. (USA)
Frequently Asked Questions
Asia Pacific region have the highest growth rate in the Predictive Maintenance in Automotive market.
Bosch (Germany), Continental (Germany), Valeo (France), Garrett Motion (Switzerland), Aisin Seiki (Japan), Aptiv (UK), ZF (Germany), NXP (Netherlands), Delphi Technologies (UK), Siemens AG (Germany), IBM Corporation (USA), Microsoft Corporation (USA), Robert Bosch GmbH (Germany), SAP SE (Germany), Teletrac Navman (USA) and others are the key players in the Predictive Maintenance in Automotive market.
Cloud segment is dominating the market owing to high efficiency of online cloud systems and enhanced security provided by the automotive manufacturers.
1. Predictive Maintenance in Automotive Market: Research Methodology
1.1. Research Data
1.1.1. Primary Data
1.1.2. Secondary Data
1.2. Market Size Estimation
1.2.1. Bottom-Up Approach
1.2.2. Top-Down Approach
1.3. Market Breakdown and Data Triangulation
1.4. Research Assumptions
2. Predictive Maintenance in Automotive Market: Executive Summary
2.1. Market Overview
2.2. Market Size (2025) and Forecast (2026- 2032) and Y-O-Y%
2.3. Market Size (USD) and Market Share (%) – By Segments and Regions
3. Predictive Maintenance in Automotive Market: Competitive Landscape
3.1. Stellar Competition Matrix
3.2. Key Players Benchmarking
3.2.1. Company Name
3.2.2. Headquarter
3.2.3. Business Portfolio
3.2.4. End-User Segment
3.2.5. Revenue (2025)
3.3. Market Structure
3.3.1. Market Leaders
3.3.2. Market Followers
3.3.3. Emerging Players
3.4. Consolidation of the Market
3.4.1. Strategic Initiatives
3.4.2. Mergers and Acquisitions
3.4.3. Collaboration and Partnerships
3.4.4. Developments and Innovations
4. Predictive Maintenance in Automotive Market: Dynamics
4.1. Market Trends
4.2. Market Drivers
4.3. Market Restraints
4.4. Market Opportunities
4.5. Market Challenges
4.6. PORTER’s Five Forces Analysis
4.7. PESTLE Analysis
4.8. Technology Roadmap
4.9. Regulatory Landscape by Region
4.9.1. North America
4.9.2. Europe
4.9.3. Asia Pacific
4.9.4. Middle East and Africa
4.9.5. South America
5. Predictive Maintenance in Automotive Market Size and Forecast by Segments (by Value USD Million)
5.1. Predictive Maintenance in Automotive Market Size and Forecast, By Vehicle Type (2025-2032)
5.1.1. Passenger Car
5.1.2. Commercial Vehicle
5.2. Predictive Maintenance in Automotive Market Size and Forecast, By Hardware (2025-2032)
5.2.1. ADAS
5.2.2. Telematics
5.2.3. OBD
5.3. Predictive Maintenance in Automotive Market Size and Forecast, By Deployment Type (2025-2032)
5.3.1. Passenger Vehicle
5.3.2. Hatchback
5.3.3. Sedan
5.3.4. SUV
5.3.5. Commercial Vehicle
5.4. Predictive Maintenance in Automotive Market Size and Forecast, By Application (2025-2032)
5.4.1. Pro-active alerts
5.4.2. Safety and Security
5.5. Predictive Maintenance in Automotive Market Size and Forecast, by Region (2025-2032)
5.5.1. North America
5.5.2. Europe
5.5.3. Asia Pacific
5.5.4. Middle East and Africa
5.5.5. South America
6. North America Predictive Maintenance in Automotive Market Size and Forecast (by Value USD Million)
6.1. North America Predictive Maintenance in Automotive Market Size and Forecast, By Vehicle Type (2025-2032)
6.1.1. Passenger Car
6.1.2. Commercial Vehicle
6.2. North America Predictive Maintenance in Automotive Market Size and Forecast, By Hardware (2025-2032)
6.2.1. ADAS
6.2.2. Telematics
6.2.3. OBD
6.3. North America Predictive Maintenance in Automotive Market Size and Forecast, By Deployment Type (2025-2032)
6.3.1. Passenger Vehicle
6.3.2. Hatchback
6.3.3. Sedan
6.3.4. SUV
6.3.5. Commercial Vehicle
6.4. North America Predictive Maintenance in Automotive Market Size and Forecast, By Application (2025-2032)
6.4.1. Pro-active alerts
6.4.2. Safety and Security
6.5. North America Predictive Maintenance in Automotive Market Size and Forecast, by Country (2025-2032)
6.5.1. United States
6.5.2. Canada
6.5.3. Mexico
7. Europe Predictive Maintenance in Automotive Market Size and Forecast (by Value USD Million)
7.1. Europe Predictive Maintenance in Automotive Market Size and Forecast, By Vehicle Type (2025-2032)
7.2. Europe Predictive Maintenance in Automotive Market Size and Forecast, By Hardware (2025-2032)
7.3. Europe Predictive Maintenance in Automotive Market Size and Forecast, By Deployment Type (2025-2032)
7.4. Europe Predictive Maintenance in Automotive Market Size and Forecast, By Application (2025-2032)
7.5. Europe Predictive Maintenance in Automotive Market Size and Forecast, by Country (2025-2032)
7.5.1. UK
7.5.2. France
7.5.3. Germany
7.5.4. Italy
7.5.5. Spain
7.5.6. Sweden
7.5.7. Austria
7.5.8. Rest of Europe
8. Asia Pacific Predictive Maintenance in Automotive Market Size and Forecast (by Value USD Million)
8.1. Asia Pacific Predictive Maintenance in Automotive Market Size and Forecast, By Vehicle Type (2025-2032)
8.2. Asia Pacific Predictive Maintenance in Automotive Market Size and Forecast, By Hardware (2025-2032)
8.3. Asia Pacific Predictive Maintenance in Automotive Market Size and Forecast, By Deployment Type (2025-2032)
8.4. Asia Pacific Predictive Maintenance in Automotive Market Size and Forecast, By Application (2025-2032)
8.5. Asia Pacific Predictive Maintenance in Automotive Market Size and Forecast, by Country (2025-2032)
8.5.1. China
8.5.2. S Korea
8.5.3. Japan
8.5.4. India
8.5.5. Australia
8.5.6. Indonesia
8.5.7. Malaysia
8.5.8. Vietnam
8.5.9. Taiwan
8.5.10. Bangladesh
8.5.11. Pakistan
8.5.12. Rest of Asia Pacific
9. Middle East and Africa Predictive Maintenance in Automotive Market Size and Forecast (by Value USD Million)
9.1. Middle East and Africa Predictive Maintenance in Automotive Market Size and Forecast, By Vehicle Type (2025-2032)
9.2. Middle East and Africa Predictive Maintenance in Automotive Market Size and Forecast, By Hardware (2025-2032)
9.3. Middle East and Africa Predictive Maintenance in Automotive Market Size and Forecast, By Deployment Type (2025-2032)
9.4. Middle East and Africa Predictive Maintenance in Automotive Market Size and Forecast, By Application (2025-2032)
9.5. Middle East and Africa Predictive Maintenance in Automotive Market Size and Forecast, by Country (2025-2032)
9.5.1. South Africa
9.5.2. GCC
9.5.3. Egypt
9.5.4. Nigeria
9.5.5. Rest of ME&A
10. South America Predictive Maintenance in Automotive Market Size and Forecast (by Value USD Million)
10.1. South America Predictive Maintenance in Automotive Market Size and Forecast, By Vehicle Type (2025-2032)
10.2. South America Predictive Maintenance in Automotive Market Size and Forecast, By Hardware (2025-2032)
10.3. South America Predictive Maintenance in Automotive Market Size and Forecast, By Deployment Type (2025-2032)
10.4. South America Predictive Maintenance in Automotive Market Size and Forecast, By Application (2025-2032)
10.5. South America Predictive Maintenance in Automotive Market Size and Forecast, by Country (2025-2032)
10.5.1. Brazil
10.5.2. Argentina
10.5.3. Rest of South America
11. Company Profile: Key players
11.1. Bosch
11.1.1. Company Overview
11.1.2. Financial Overview
11.1.2.1. Total Revenue
11.1.2.2. Segment Revenue
11.1.2.3. Regional Revenue
11.1.3. Business Portfolio
11.1.4. SWOT Analysis
11.1.5. Business Strategy
11.1.6. Recent Developments
11.2. Continental
11.3. Valeo
11.4. Garrett Motion
11.5. Aisin Seiki
11.6. Aptiv
11.7. Delphi Technologies
11.8. NXP
11.9. Siemens AG
11.10. IBM Corporation
11.11. Teletrac Navman
12. Key Findings
13. Industry Recommendations
13.1. Strategic Recommendations
13.2. Future Outlook