Personal Protective Equipment Market Global Outlook and Forecast by Product, End-Use industries, and Region Forecasts (2026– 2032)
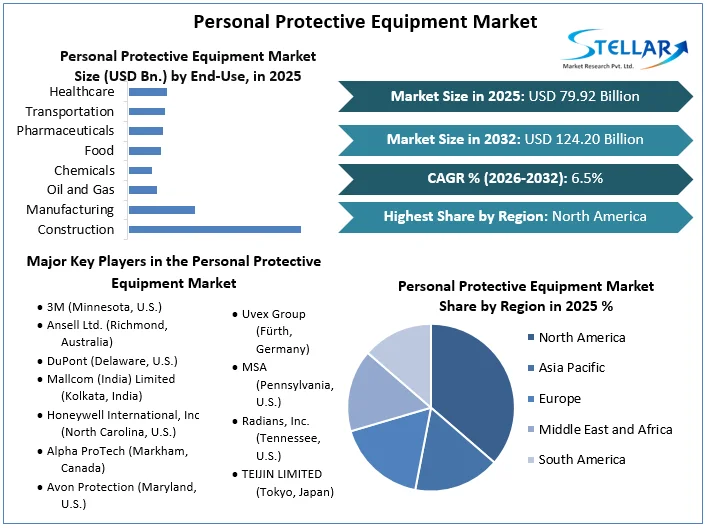
Personal Protective Equipment Market size was valued at US$ 79.92 Billion in 2025 and Personal Protective Equipment service is expected to grow at 6.5% through 2026 to 2032, reaching nearly US$ 124.20 Billion
Personal Protective Equipment Market Overview:
Personal Protective Equipment can save a person from danger. This danger might be a sharp edge, hot surface, dust, toxic gas, fall from height, etc. The use of PPE is an administrative control to reduce hazards at an acceptable level. It is used as a last-line defense. A PPE cannot remove hazards but it acts as a barrier between the danger and the user. For the desired satisfactory performance, PPE must be in a good condition and used in a right way. The increasing number of fatal accidents in the workplace has forced to use PPEs to ensure the safety of individuals. Companies are manufacturing safety helmets from eco-friendly material such as fossil fuels to augment product demand. OHSAS 18001 requires that many categories of PPE meet or be equivalent to standards developed by the American National Standards Institute (ANSI).In potentially dangerous workplace areas, workers are relying on PPEs to protect against the health and safety risks therefore a manufacturing company needs assurance that even under the most stressful or hazardous conditions, PPE will provide sustained protection. Various consulting firms are providing testing and verification of products at the developing stage to ensure the potential of PPEs.
The report analyzes the Personal Protective Equipment market’s Drivers, Restraints, opportunities, challenges, and segments (Product, End-Use industries, and Region) which helps to assess the market growth. As COVID – 19 has spread across the world, the government has issued clear instructions on the use of adequate personal protective equipment (PPE) for health and social care professionals. The report also shows the current situation of the PPE market and region-wise demand of PPEs during the forecast period.
To get more Insights: Request Free Sample Report
Personal Protective Equipment Market Dynamics:
According to OHSAS, 100,000 injuries and 100 to 200 deaths occur each year due to construction activity. The most common cause of death at construction work are fall from height and electrocution. The use of appropriate PPE provides a level of protection from a number of hazards. Thus the Increasing infrastructure projects shall boost the personal protective equipment market in the forecast period.
For increasing safety awareness in the workplace governments in different countries mandate the use of personal protection equipment. Personal protective equipment (PPE) such as goggles, shield glasses, safety shoes, Helmets are designed to protect the user from damage or infection. Sectors such as Pharmaceuticals, Chemicals, transportation, manufacturing, and construction are also boosting the market growth. Due to the implementation of severe laws and policies in factories and other workplaces by governments throughout the globe, this market is expected to grow fast over the forecast period. Nowadays companies are going for OHSAS certification for committed to providing a safe and healthy working environment expected to increase the demand in the personal protective equipment market.
Market growth is being hampered by increased automation in end-use industries and the high cost of the PPEs. The lack of awareness for workplace hazards, threats from duplicate and low-quality products may hamper the growth of the personal protective equipment market.
Personal Protective Equipment Market Segment Analysis:
By Product, Fall protection segment covers a major market share globally in the personal protective equipment market due to the increasing awareness for safety at the workplace and stringent government regulations in end-use industries. The fall protection market is estimated to be USD 3.14 Billion in 2025 and is projected to reach USD 5.85 Billion by 2032, at a CAGR of 8.1% during the forecast period.
The hand protection segment can be segmented as Durable Gloves & Disposable Gloves. Durable gloves are being used in the manufacturing industry to avoid cut and burn injuries. The durable gloves segment dominated the market and held a share of 30% in 2025. Disposable gloves are mainly used in the food and health industries to protect against cross-infections.

The foot protection segment growth is mainly driven by the regulations that mandate the usage of safety in order to reduce workplace fatalities, are expected to surge the product demand for protective footwear over the forecast period. The respiratory Protection segment protects workers from toxic gases, chemicals, radiological, and nuclear hazards. Increasing demand for respiratory equipment in the hospitals & chemical industries is influencing the overall respiratory personal protective equipment market share.
By End-Use Industries, The construction industry has reported extremely high numbers of accidents each year, a lot of these can be minimized by the use of appropriate PPEs. The PPE market in the construction industry is growing at a CAGR of 5.9% during the period 2026-2032.
Below chart showing the Industrial accidents in 2025 according to OHSAS. Out of the total of 90,656 people involved in industrial accidents, (29.3%) were in construction accidents. Of those, falls (32.7%) were the most numerous, followed by slips (15.0%) and being struck with objects (12.7%).
Toxic inhalations, broken bones, back and neck injuries are some of the common cases observed in the Oil and gas industries. It is estimated that the oil and gas industry segment value over US$15billion of the total personal protective equipment market share by 2027. This segment is mainly driven by increased exploration activities and demand for petroleum products globally.
Personal Protective Equipment Market Regional Insights:
North America is the largest share holder in personal protective equipment market. The market is largely driven by increased awareness of safety and regulation which increased the usage of personal protective equipment in various industries. In 2024 market size of PPE stood at 45.21 Billion.
In US, Hand protection is the PPE market’s single largest product segment, accounting for approximately 35 percent of total US PPE sales in 2024. Respiratory protection, protective clothing, and hand protection are expected to help overall US PPE sales increase from $25.29 billion in 2024 to an estimated $ 64.89 billion in 2032, at a CAGR of 12.5%.
In 2024, Asia Pacific was responsible for over 52.5% of PPE revenue. Due to increased construction projects and the oil and gas sector in the region, the region is expected to grow rapidly during the forecast period. China, India, Indonesia, and Vietnam are the fastest-growing nations in the personal protective equipment market.
Personal Protective Equipment Market Scope:
|
Personal Protective Equipment Market |
|
|
Market Size in 2025 |
USD 79.92 Bn. |
|
Market Size in 2032 |
USD 124.20 Bn. |
|
CAGR (2026-2032) |
6.5% |
|
Historic Data |
2020-2025 |
|
Base Year |
2025 |
|
Forecast Period |
2026-2032 |
|
Segment Scope |
by Product
|
|
By End-Use
|
|
|
Regional Scope |
North America- United States, Canada, and Mexico Europe – UK, France, Germany, Italy, Spain, Sweden, Austria, and Rest of Europe Asia Pacific – China, India, Japan, South Korea, Australia, ASEAN, Rest of APAC Middle East and Africa - South Africa, GCC, Egypt, Nigeria, Rest of the Middle East and Africa South America – Brazil, Argentina, Rest of South America |
Personal Protective Equipment Market Key Players:
- 3M (Minnesota, U.S.)
- Ansell Ltd. (Richmond, Australia)
- DuPont (Delaware, U.S.)
- Mallcom (India) Limited (Kolkata, India)
- Honeywell International, Inc. (North Carolina, U.S.)
- Alpha ProTech (Markham, Canada)
- Avon Protection (Maryland, U.S.)
- COFRA S.r.l. (Barletta Andria Trani, Italy)
- Uvex Group (Fürth, Germany)
- MSA (Pennsylvania, U.S.)
- Radians, Inc. (Tennessee, U.S.)
- TEIJIN LIMITED (Tokyo, Japan)
- TenCate Fabrics (Nijverdal, Netherlands)s
- Towa Corporation (Kyoto, Japan)
- Supermax Corporation Berhad (Kuala Lumpur, Malaysia)
- MCR Safety (Tennessee, U.S.)
- Lakeland Inc. (New York, U.S.)
- W. L. Gore & Associates, Inc. (Delaware, U.S.)
- Bullard (Kentucky, U.S.)
- Other Key Players
Frequently Asked Questions
Market growth is being hampered by increased automation in end-use industries and the high cost of the PPEs. The lack of awareness for workplace hazards, threats from duplicate and low-quality products may hamper the growth of the personal protective equipment market.
Personal Protective Equipment service Market size was valued at US$ 79.92 Billion in 2025 and Personal Protective Equipment service is expected to grow at 6.5% through 2026 to 2032, reaching nearly US$ 124.20 Billion
The segments covered are Product, End-Use industries, and Region.
1. Personal Protective Equipment Market Research Methodology
2. Personal Protective Equipment Market Introduction
2.1. Study Assumption and Market Definition
2.2. Scope of the Study
2.3. Executive Summary
3. Global Personal Protective Equipment Market: Competitive Landscape
3.1. SMR Competition Matrix
3.2. Key Players Benchmarking
3.2.1. Company Name
3.2.2. Product Segment
3.2.3. End-user Segment
3.2.4. Revenue (2025)
3.2.5. Company Locations
3.3. Market Structure
3.3.1. Market Leaders
3.3.2. Market Followers
3.3.3. Emerging Players
3.4. Consolidation of the Market
4. Personal Protective Equipment Market: Dynamics
4.1. Personal Protective Equipment Market Trends by Region
4.1.1. North America
4.1.2. Europe
4.1.3. Asia Pacific
4.1.4. Middle East and Africa
4.1.5. South America
4.2. Personal Protective Equipment Market Drivers
4.3. Personal Protective Equipment Market Restraints
4.4. Personal Protective Equipment Market Opportunities
4.5. Personal Protective Equipment Market Challenges
4.6. PORTER’s Five Forces Analysis
4.7. PESTLE Analysis
4.8. Technological Roadmap
4.9. Value Chain Analysis
4.10. Regulatory Landscape by Region
4.10.1. North America
4.10.2. Europe
4.10.3. Asia Pacific
4.10.4. Middle East and Africa
4.10.5. South America
5. Personal Protective Equipment Market: Global Market Size and Forecast by Segmentation (by Value in USD Million and Volume in Units) (2025-2032)
5.1. Personal Protective Equipment Market Size and Forecast, by Product (2025-2032)
5.1.1. Foot protection
5.1.2. Fall Protection
5.1.3. Hand Protection
5.1.4. Respiratory Protection
5.1.5. Eye and Face Protection
5.1.6. Head Protection
5.1.7. Hearing Protection
5.2. Personal Protective Equipment Market Size and Forecast, by End-Use (2025-2032)
5.2.1. Construction
5.2.2. Manufacturing
5.2.3. Oil and Gas
5.2.4. Chemicals
5.2.5. Food
5.2.6. Pharmaceuticals
5.2.7. Transportation
5.2.8. Healthcare
5.2.9. Others (Firefighting, Automotive etc.)
5.3. Personal Protective Equipment Market Size and Forecast, by Region (2025-2032)
5.3.1. North America
5.3.2. Europe
5.3.3. Asia Pacific
5.3.4. Middle East and Africa
5.3.5. South America
6. North America Personal Protective Equipment Market Size and Forecast by Segmentation (by Value in USD Million and Volume in Units) (2025-2032)
6.1. North America Personal Protective Equipment Market Size and Forecast, by Product (2025-2032)
6.1.1. Foot protection
6.1.2. Fall Protection
6.1.3. Hand Protection
6.1.4. Respiratory Protection
6.1.5. Eye and Face Protection
6.1.6. Head Protection
6.1.7. Hearing Protection
6.2. North America Personal Protective Equipment Market Size and Forecast, by End-Use (2025-2032)
6.2.1. Construction
6.2.2. Manufacturing
6.2.3. Oil and Gas
6.2.4. Chemicals
6.2.5. Food
6.2.6. Pharmaceuticals
6.2.7. Transportation
6.2.8. Healthcare
6.2.9. Others (Firefighting, Automotive etc.)
6.3. North America Personal Protective Equipment Market Size and Forecast, by Country (2025-2032)
6.3.1. United States
6.3.2. Canada
6.3.3. Mexico
7. Europe Personal Protective Equipment Market Size and Forecast by Segmentation (by Value in USD Million and Volume in Units) (2025-2032)
7.1. Europe Personal Protective Equipment Market Size and Forecast, by Product (2025-2032)
7.2. Europe Personal Protective Equipment Market Size and Forecast, by End-Use (2025-2032)
7.3. Europe Personal Protective Equipment Market Size and Forecast, by Country (2025-2032)
7.3.1. United Kingdom
7.3.2. France
7.3.3. Germany
7.3.4. Italy
7.3.5. Spain
7.3.6. Sweden
7.3.7. Austria
7.3.8. Rest of Europe
8. Asia Pacific Personal Protective Equipment Market Size and Forecast by Segmentation (by Value in USD Million and Volume in Units) (2025-2032)
8.1. Asia Pacific Personal Protective Equipment Market Size and Forecast, by Product (2025-2032)
8.2. Asia Pacific Personal Protective Equipment Market Size and Forecast, by End-Use (2025-2032)
8.3. Asia Pacific Personal Protective Equipment Market Size and Forecast, by Country (2025-2032)
8.3.1. China
8.3.2. S Korea
8.3.3. Japan
8.3.4. India
8.3.5. Australia
8.3.6. Indonesia
8.3.7. Malaysia
8.3.8. Vietnam
8.3.9. Taiwan
8.3.10. Rest of Asia Pacific
9. Middle East and Africa Personal Protective Equipment Market Size and Forecast by Segmentation (by Value in USD Million and Volume in Units) (2025-2032)
9.1. Middle East and Africa Personal Protective Equipment Market Size and Forecast, by Product (2025-2032)
9.2. Middle East and Africa Personal Protective Equipment Market Size and Forecast, by End-Use (2025-2032)
9.3. Middle East and Africa Personal Protective Equipment Market Size and Forecast, by Country (2025-2032)
9.3.1. South Africa
9.3.2. GCC
9.3.3. Nigeria
9.3.4. Rest of ME&A
10. South America Personal Protective Equipment Market Size and Forecast by Segmentation (by Value in USD Million and Volume in Units) (2025-2032)
10.1. South America Personal Protective Equipment Market Size and Forecast, by Product (2025-2032)
10.2. South America Personal Protective Equipment Market Size and Forecast, by End-Use (2025-2032)
10.3. South America Personal Protective Equipment Market Size and Forecast, by Country (2025-2032)
10.3.1. Brazil
10.3.2. Argentina
10.3.3. Rest Of South America
11. Company Profile: Key Players
11.1. 3M (Minnesota, U.S.)
11.1.1. Company Overview
11.1.2. Business Portfolio
11.1.3. Financial Overview
11.1.4. SWOT Analysis
11.1.5. Strategic Analysis
11.1.6. Recent Developments
11.2. Ansell Ltd. (Richmond, Australia)
11.3. DuPont (Delaware, U.S.)
11.4. Mallcom (India) Limited (Kolkata, India)
11.5. Honeywell International, Inc. (North Carolina, U.S.)
11.6. Alpha ProTech (Markham, Canada)
11.7. Avon Protection (Maryland, U.S.)
11.8. COFRA S.r.l. (Barletta Andria Trani, Italy)
11.9. Uvex Group (Fürth, Germany)
11.10. MSA (Pennsylvania, U.S.)
11.11. Radians, Inc. (Tennessee, U.S.)
11.12. TEIJIN LIMITED (Tokyo, Japan)
11.13. TenCate Fabrics (Nijverdal, Netherlands)s
11.14. Towa Corporation (Kyoto, Japan)
11.15. Supermax Corporation Berhad (Kuala Lumpur, Malaysia)
11.16. MCR Safety (Tennessee, U.S.)
11.17. Lakeland Inc. (New York, U.S.)
11.18. W. L. Gore & Associates, Inc. (Delaware, U.S.)
11.19. Bullard (Kentucky, U.S.)
11.20. Other Key Players
12. Key Findings
13. Industry Recommendations