Parenteral Nutrition Market - Global Research Analysis and Forecast (2026-2032) by Nutrition Type, Consumer Type, End-Use, and Region
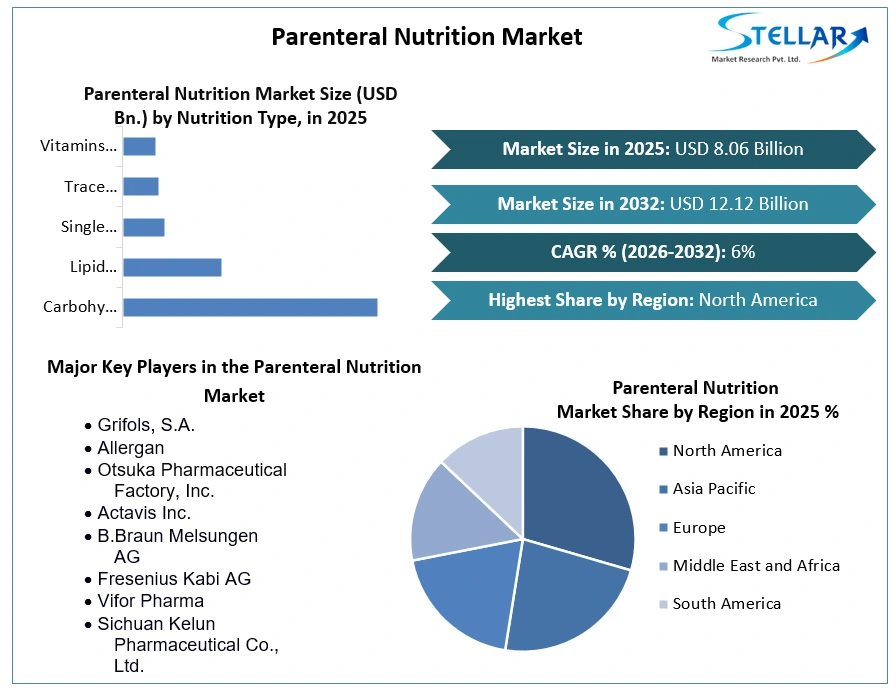
Parenteral Nutrition Market size was valued at USD 8.06 Bn. in 2025 and the total revenue is expected to grow at a CAGR of 6.0% through 2026 to 2032, reaching nearly USD 12.12 Bn
Parenteral Nutrition Market Overview:
Parenteral nutrition delivers sugar, carbohydrates, proteins, fats, electrolytes, and trace elements to the body. Having a high level of energy, hydration, and strength requires these nutrients. It is called parenteral nutrition, sometimes called total parenteral nutrition (intravenously) when a particular form of food is injected into a vein. The treatment is used to treat or prevent malnutrition.
To get more Insights: Request Free Sample Report
Though market forecasting through 2032 is based on real output, demand and supply of 2025, 2025 numbers are also estimated on real numbers published by key players as well all-important players across the world. Market forecasting till 2032 is done based on past data from 2020 to 2025
Parenteral Nutrition Market Dynamics:
Parenteral nutrition (PN) is the intravenous injection of essential nutrients. Protein, fat, carbohydrate, electrolytes, minerals, vitamins, and essential trace elements are among these nutrients. One of the key factors driving market growth is the growing elderly population, which necessitates the administration of critical nutrients to keep patients hydrated, energetic, and strong.
The rising prevalence of chronic diseases such as malignancies causes low energy levels and a loss of appetite, which is expected to increase demand for parenteral nutrition, driving the parenteral nutrition market forward. The rising incidence of preterm births, as well as the scarcity of vital nutrients in premature infants and newborns, are expected to accelerate the adoption of intravenous nutrition delivery, particularly in Asia Pacific and Africa's developing and poor countries. Growing government and non-government activities to raise awareness of diet, such as the National Association of Nutrition Professionals, the American Association, the American Society for Parenteral and Enteral Nutrition, and others, are expected to boost parenteral nutrition market growth during the forecast period.
Appropriate and timely parenteral feeding can help patients recover faster and avoid problems. Patients with diseases or conditions that impede food intake, digestion, or nutrient absorption, such as short bowel syndrome, gastrointestinal fistulas, intestinal obstruction, critically ill patients, and severe acute pancreatitis, are the most common recipients. Besides, because of the convenience of usage, patients can now get parenteral nutrition at home. Approximately 25,000 patients received parenteral feeding at home, according to estimates. These are the factors that are expected to have a substantial impact on parenteral nutrition market growth.
Lack of understanding and potential side effects of parenteral nutrition, such as changes in heart rate, seizures, rapid weight gain or loss, weariness, fever or chills, increased urination, and memory loss, are the factors that are expected to hamper the global parenteral nutrition market's growth during the forecast period.
Parenteral Nutrition Market Segment Analysis:
Based on the Nutrition Type, the market is segmented into Carbohydrates, Parenteral Lipid Emulsion, Single Dose Amino Acid Solution, Trace Elements, and Vitamins & Minerals. Single Dose Amino Acid Solution segment is expected to hold the largest market shares of xx% by 2032. This is due to the people's increased awareness of health and fitness, as well as the high prevalence of chronic diseases around the world. Effective monitoring and assessment are one of the most critical parts of PN service. Routine monitoring should include vital signs, blood glucose, fluid balance, and blood and urine biochemistry. Parenteral nutrition issues can be avoided by following proper care standards during the administration process. These are the factors that are expected to drives the growth of this segment in the Parenteral Nutrition market during the forecast period 2026-2032.

Based on the End-Use, the parenteral nutrition market is segmented into Children and New-born, and Adults. Adults segment is expected to grow rapidly at a CAGR of xx% during the forecast period 2026-2032. Parenteral nutrition is a sustainable alternative for adult and paediatric patients with a functional gastrointestinal tract or illnesses that necessitate total bowel rest, such as certain phases of ulcerative colitis, intestinal obstruction, and post-surgical short bowel syndrome. Malnutrition is a common occurrence among severely unwell persons. Acute and chronic sickness, trauma and inflammation-induced stress-related catabolism, and drug-induced adverse effects, particularly in youngsters, may impair appetite or exacerbate nausea and vomiting. A rigorous nutritional assessment advised by healthcare specialists should be used to determine the prescribed doses of various nutrients for adults receiving parenteral feeding. Nutritional requirements should include disease-specific demands based on patient type, such as adults, children, and new-born babies, with considerations such as medical condition, nutritional status, fluid limits, and organ function all being taken into account.
Parenteral Nutrition Market Regional Insights:
North America region is expected to dominate the Parenteral Nutrition market during the forecast period 2026-2032. North America region is expected to hold the largest market shares of xx% by 2032. This is due to high research expenditures by the government of countries in the region, as well as private organizations operating in the healthcare sector, and collaborations between regulatory authorities, the medical device sector, and universities. These are the key major drivers that are expected to drives the growth of the North America region in the Parenteral Nutrition Market during the forecast period.
Asia Pacific region is expected to grow rapidly at a CAGR of xx% during the forecast period 2026-2032. This is due to the favorable government initiatives related to healthcare infrastructure development and reimbursement policies in countries in the region. Economic development in countries such as China, India, and Japan, and increasing government initiatives for development of healthcare infrastructure and implementation of reimbursement policies are factors supporting parenteral nutrition market growth in Asia Pacific region.
The objective of the report is to present a comprehensive analysis of the Parenteral Nutrition Market to the stakeholders in the industry. The report provides trends that are most dominant in the Parenteral Nutrition Market and how these trends will influence new business investments and market development throughout the forecast period. The report also aids in the comprehension of the market dynamics and competitive structure of the market by analyzing market leaders, market followers, and regional players.
The qualitative and quantitative data provided in the Parenteral Nutrition Market report is to help understand which market segments, regions are expected to grow at higher rates, factors affecting the market, and key opportunity areas, which will drive the industry and market growth through the forecast period. The report also includes the competitive landscape of key players in the industry along with their recent developments in the Parenteral Nutrition Market. The report studies factors such as company size, market share, market growth, revenue, production volume, and profits of the key players in the market.
The report provides Porter's Five Force Model, which helps in designing the business strategies in the market. The report helps in identifying how many rivals are existing, who they are, and how their product quality is in the Market. The report also analyses if the Parenteral Nutrition Market is easy for a new player to gain a foothold in the market, do they enter or exit the market regularly if the market is dominated by a few players, etc.
The report also includes a PESTEL Analysis, which aids in the development of company strategies. Political variables help in figuring out how much a government can influence the Market. Economic variables aid in the analysis of economic performance drivers that have an impact on the Market. Understanding the impact of the surrounding environment and the influence of environmental concerns on the Parenteral Nutrition Market is aided by legal factors.
Parenteral Nutrition Market Scope:
|
Parenteral Nutrition Market |
|
|
Market Size in 2025 |
USD 8.06 Bn. |
|
Market Size in 2032 |
USD 12.12 Bn. |
|
CAGR (2026-2032) |
6% |
|
Historic Data |
2020-2025 |
|
Base Year |
2025 |
|
Forecast Period |
2026-2032 |
|
Segment Scope |
By Nutrition Type
|
|
By Consumer Type
|
|
|
By End-Use
|
|
|
Regional Scope |
North America- United States, Canada, and Mexico Europe – UK, France, Germany, Italy, Spain, Sweden, Austria, and Rest of Europe Asia Pacific – China, India, Japan, South Korea, Australia, ASEAN, Rest of APAC Middle East and Africa - South Africa, GCC, Egypt, Nigeria, Rest of the Middle East and Africa South America – Brazil, Argentina, Rest of South America |
Parenteral Nutrition Market Key Players
- Baxter
- Grifols, S.A.
- Allergan
- Otsuka Pharmaceutical Factory, Inc.
- Actavis Inc.
- B. Braun Melsungen AG
- Fresenius Kabi AG
- Vifor Pharma
- Sichuan Kelun Pharmaceutical Co., Ltd.
- Pfizer Inc. (Hospira Inc.)
- Titus Health Tech
- Health Biologics
- Radius Healthcare Private Limited
- A M Nutratech Private Limited
- Inlife Pharma Private Limited
Frequently Asked Questions
North America is expected to hold the highest share in the Parenteral Nutrition Market
Baxter, Grifols, S.A., Allergan, Otsuka Pharmaceutical Factory, Inc., Actavis Inc., and B. Braun Melsungen AG are the top key players in the Parenteral Nutrition Market
Single Dose Amino Acid Solution segment hold the largest market share in the Parenteral Nutrition market by 2032
The market size of the Parenteral Nutrition market is expected to reach US $ 12.12 Bn. by 2032.
The market size of the Parenteral Nutrition market was worth US $8.06 Bn. in 2025.
1. Parenteral Nutrition Market: Research Methodology
1.1. Research Data
1.1.1. Primary Data
1.1.2. Secondary Data
1.2. Market Size Estimation
1.2.1. Bottom-Up Approach
1.2.2. Top-Down Approach
1.3. Market Breakdown and Data Triangulation
1.4. Research Assumptions
2. Parenteral Nutrition Market: Executive Summary
2.1. Market Overview
2.2. Market Size (2025) and Forecast 2026-2032 and Y-O-Y%
2.3. Market Size (USD) and Market Share (%) – By Segments and Regions
3. Parenteral Nutrition Market: Competitive Landscape
3.1. Stellar Competition Matrix
3.2. Key Players Benchmarking
3.2.1. Company Name
3.2.2. Headquarter
3.2.3. Business Segment
3.2.5. End-user Segment
3.2.6. Y-O-Y%
3.2.7. Revenue (2025)
3.2.8. Profit Margin
3.2.9. Market Share
3.2.10. Company Locations
3.3. Market Structure
3.3.1. Market Leaders
3.3.2. Market Followers
3.3.3. Emerging Players
3.4. Consolidation of the Market
3.4.1. Strategic Initiatives and Developments
3.4.2. Mergers and Acquisitions
3.4.3. Collaborations and Partnerships
4. Parenteral Nutrition Market: Dynamics
4.1. Market Trends by Region
4.1.1. North America
4.1.2. Europe
4.1.3. Asia Pacific
4.1.4. Middle East and Africa
4.1.5. South America
4.2. Market Drivers
4.3. Market Restraints
4.4. Market Opportunities
4.5. Market Challenges
4.6. PORTER’s Five Forces Analysis
4.6.1. Intensity of the Rivalry
4.6.2. Threat of New Entrants
4.6.3. Bargaining Power of Suppliers
4.6.4. Bargaining Power of Buyers
4.6.5. Threat of Substitutes
4.7. PESTLE Analysis
4.7.1. Political Factors
4.7.2. Economic Factors
4.7.3. Social Factors
4.7.4. Technological Factors
4.7.5. Legal Factors
4.7.6. Environmental Factors
4.8. Technological Roadmap
4.9. Regulatory Landscape
4.9.1. Market Regulation by Region
4.9.1.1. North America
4.9.1.2. Europe
4.9.1.3. Asia Pacific
4.9.1.4. Middle East and Africa
4.9.1.5. South America
4.9.2. Impact of Regulations on Market Dynamics
4.9.3. Government Schemes and Initiatives
5. Parenteral Nutrition Market Size and Forecast by Segments (by Value USD Bn)
5.1. Parenteral Nutrition Market Size and Forecast, By Nutrition Type 2025-2032
5.1.1. Carbohydrates
5.1.2. Lipid Emulsion
5.1.3. Single Dose Amino Acid Solution
5.1.4. Trace Elements
5.1.5. Vitamins and Minerals
5.2. Parenteral Nutrition Market Size and Forecast, By Consumer Type 2025-2032
5.2.1. Children and New-born
5.2.2. Adults
5.3. Parenteral Nutrition Market Size and Forecast, By End Use 2025-2032
5.3.1. Hospital
5.3.2. Clinic
5.3.3. Others
5.4. Parenteral Nutrition Market Size and Forecast, by Region 2025-2032
5.4.1. North America
5.4.2. Europe
5.4.3. Asia Pacific
5.4.4. Middle East and Africa
5.4.5. South America
6. North America Parenteral Nutrition Market Size and Forecast (by Value USD Bn)
6.1. North America Parenteral Nutrition Market Size and Forecast, By Nutrition Type 2025-2032
6.1.1. Carbohydrates
6.1.2. Lipid Emulsion
6.1.3. Single Dose Amino Acid Solution
6.1.4. Trace Elements
6.1.5. Vitamins and Minerals
6.2. North America Parenteral Nutrition Market Size and Forecast, By Consumer Type 2025-2032
6.2.1. Children and New-born
6.2.2. Adults
6.3. North America Parenteral Nutrition Market Size and Forecast, By End Use 2025-2032
6.3.1. Hospital
6.3.2. Clinic
6.3.3. Others
6.4. North America Parenteral Nutrition Market Size and Forecast, by Country 2025-2032
6.4.1. United States
6.4.2. Canada
6.4.3. Mexico
7. Europe Parenteral Nutrition Market Size and Forecast (by Value USD Bn)
7.1. Europe Parenteral Nutrition Market Size and Forecast, By Nutrition Type 2025-2032
7.2. Europe Parenteral Nutrition Market Size and Forecast, By Consumer Type 2025-2032
7.3. Europe Parenteral Nutrition Market Size and Forecast, By End Use 2025-2032
7.4. Europe Parenteral Nutrition Market Size and Forecast, by Country 2025-2032
7.4.1. UK
7.4.2. France
7.4.3. Germany
7.4.4. Italy
7.4.5. Spain
7.4.6. Sweden
7.4.7. Austria
7.4.8. Rest of Europe
8. Asia Pacific Parenteral Nutrition Market Size and Forecast (by Value USD Bn)
8.1. Asia Pacific Parenteral Nutrition Market Size and Forecast, By Nutrition Type 2025-2032
8.2. Asia Pacific Parenteral Nutrition Market Size and Forecast, By Consumer Type 2025-2032
8.3. Asia Pacific Parenteral Nutrition Market Size and Forecast, By End Use 2025-2032
8.4. Asia Pacific Parenteral Nutrition Market Size and Forecast, by Country 2025-2032
8.4.1. China
8.4.2. S Korea
8.4.3. Japan
8.4.4. India
8.4.5. Australia
8.4.6. Indonesia
8.4.7. Malaysia
8.4.8. Vietnam
8.4.9. Taiwan
8.4.10. Bangladesh
8.4.11. Pakistan
8.4.12. Rest of Asia Pacific
9. Middle East and Africa Parenteral Nutrition Market Size and Forecast (by Value USD Bn)
9.1. Middle East and Africa Parenteral Nutrition Market Size and Forecast, By Nutrition Type 2025-2032
9.2. Middle East and Africa Parenteral Nutrition Market Size and Forecast, By Consumer Type 2025-2032
9.3. Middle East and Africa Parenteral Nutrition Market Size and Forecast, By End Use 2025-2032
9.4. Middle East and Africa Parenteral Nutrition Market Size and Forecast, by Country 2025-2032
9.4.1. South Africa
9.4.2. GCC
9.4.3. Egypt
9.4.4. Nigeria
9.4.5. Rest of ME&A
10. South America Parenteral Nutrition Market Size and Forecast (by Value USD Bn)
10.1. South America Parenteral Nutrition Market Size and Forecast, By Nutrition Type 2025-2032
10.2. South America Parenteral Nutrition Market Size and Forecast, By Consumer Type 2025-2032
10.3. South America Parenteral Nutrition Market Size and Forecast, By End Use 2025-2032
10.4. South America Parenteral Nutrition Market Size and Forecast, by Country 2025-2032
10.4.1. Brazil
10.4.2. Argentina
10.4.3. Rest of South America
11. Company Profile: Key players
11.1. Baxter
11.1.1. Company Overview
11.1.2. Business Portfolio
11.1.3. Financial Overview
11.1.3.1. Total Revenue
11.1.3.2. Segment Revenue
11.1.3.3. Regional Revenue
11.1.4. SWOT Analysis
11.1.5. Strategic Analysis
11.1.6. Recent Developments
11.2. Grifols, S.A.
11.3. Allergan
11.4. Otsuka Pharmaceutical Factory, Inc.
11.5. Actavis Inc.
11.6. B. Braun Melsungen AG
11.7. Fresenius Kabi AG
11.8. Vifor Pharma
11.9. Sichuan Kelun Pharmaceutical Co., Ltd.
11.10. Pfizer Inc. (Hospira Inc.)
11.11. Titus Health Tech
11.12. Health Biologics
11.13. Radius Healthcare Private Limited
11.14. A M Nutratech Private Limited
11.15. Inlife Pharma Private Limited
12. Key Findings
13. Industry Recommendations
13.1. Strategic Recommendations
13.2. Future Outlook


