Industrial Vending Machine Market Industry Overview (2026-2032) by Offering, Type, End-User and, Region
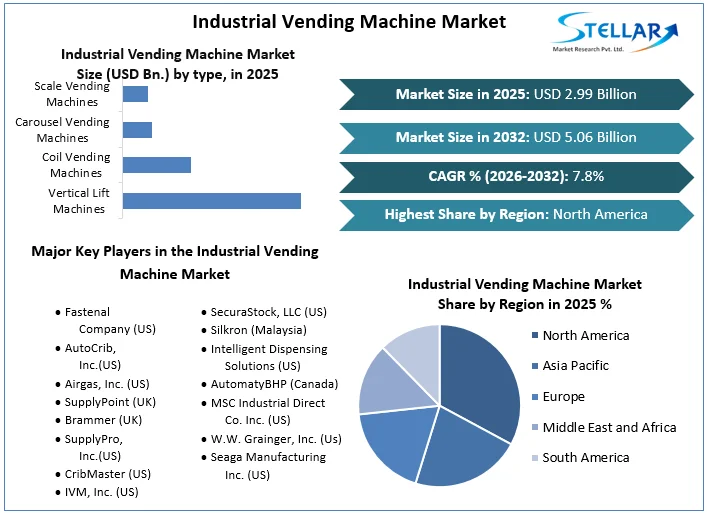
Industrial Vending Machine Market size was valued at US$ 2.99 Billion in 2025 and the total Industrial Vending Machine revenue is expected to grow at 7.8% through 2026 to 2032, reaching nearly US$ 5.06 Billion.
Industrial Vending Machine Market Overview:
The vending industry's continuous technological transformation is predicted to have a beneficial influence on industrial vending machine market growth. The introduction of radio frequency identification and cloud hosting in vending applications has made it possible to control and maintain inventories to avoid malicious activity like abuse and theft. In addition, these technologies give digital records of stock levels as well as analytical tools that provide customers with valuable information for optimal inventory control. Furthermore, the solutions provide real-time stock control transparency, ensuring that items e.g. production machinery are instantly accessible.
Commercial devices keep track of inventory utilization by recording the customer's time and identifying information. Furthermore, they boost the firm's efficiency by minimizing staff stroll time, resulting in higher worker productivity. Industrial vending machines also allow for a decrease in material consumption, which lowers the production finances. In addition, industrial vending machines reduce shipping and supply interruption prices, allowing businesses to avoid proper inventory replenishing and save money on business expenses.
The market's growth drivers, as well as the market's segments (Offering, Type, End-User, and, Region), are analyzed in this research. Market participants, regions, and special requirements have all provided data. This market study provides an in-depth look at all of the important advancements that are currently taking place across all industry sectors. Statistics, infographics, and presentations are used to provide key data analysis. The analysis looks at the market's Drivers, Restraints, Opportunities, and Challenges for the Industrial Vending Machine market. The study aids in the evaluation of market growth drivers and the determination of how to employ these drivers as a tool. The research also aids in the correction and resolution of difficulties with the global industrial vending machine market.
To get more Insights: Request Free Sample Report
Industrial Vending Machine Market Dynamics:
The integration of cloud architecture is one of the main drivers of the industrial vending machine market. With the introduction of new technology, the industrial vending machine industry has flourished. In the forecast period, the industry is likely to benefit from the incorporation of Rfid-enabled tags and cloud connectivity into commercial vending machines to give a linguistic monitor. Smart vending machines can deliver a wide range of commodities without the need for human involvement. The increasing use of commercial vending machines in SME establishments, due in part to their advantages e.g. lower energy usage and less expense, as well as the rising emphasis of manufacturers on limiting business inventory levels, are anticipated to enhance their sales in the forecast period.
The management difficulties for different entities on the manufacturing side is a restraint in the industrial vending machine market growth. Ineffectual stock procurement and classification, lack of consistency or poor forecasting, and big inventories of non-essential and high volume commodities in shops, which somewhat raise inventory expenses but also take up storage space, all add to the industry's expenses. Furthermore, ordering and issuing products necessary during manufacturing processes is a huge difficulty for maintenance employees on shop floors. Packages and other spares are procured from a centralized store, and purchase requests are sent to the modern marketplace, which purchases various things from many vendors, resulting in numerous production records.
The growing endorsement of industrial vending machines by SMEs is a key opportunity in the industrial vending machine market. Vending machine equipment makers serve small and medium-sized businesses in a multitude of sectors, including aviation, automotive, medical, engineering, and petroleum & gas, which all have a wide consumer base. Rotating machines are preferred by rising SMEs in all countries because they are less expensive, need little floor area, and utilize less power. These vending machines assist to monitor stocks and improve their effectiveness, which is driving up demand throughout the world.
Industrial Vending Machine Market Segment Analysis:
By Type, the coil vending machine segment of the industrial vending machine market is expected to grow at a CAGR of 4.2% in the forecast period. Most used industry commodities e.g. safety glasses, screwdrivers, spares and batteries, materials science and slicing discs, construction supplies, and scrub brushes may all be sold using a coil vending machine. However, industry participants have seen a dramatic drop in the purchase of coil vending machines as a result of the COVID-19 outbreak. Vending businesses are recording revenue reduction of up to 85%, as per the European Vending Service Association, since the majority of the global population works from home. Similarly, the loss in business growth caused by workplace layoffs has had an especially detrimental effect on the vending service business.
By End-User, the healthcare segment of the industrial vending machine market is expected to witness a CAGR of 3.8% in the aforementioned forecast period. Large, expensive items are frequently required by essential medical personnel. Oxygen canisters, medical support tools, and urgent care gadgets are all expensive, and storing them improperly can result in significant financial losses. As a result, medical practitioners can maintain track of valuable instruments using commercial vending machines or vault dispense systems. Furthermore, having a commercial vending machine nearby allows medical personnel and physicians to have a centralized access source for all vital medical equipment in the event of a crisis. As a result of the COVID-19 pandemic, producers are putting wellness goods through vending machines and positioning them wherever customers may get them.

Industrial Vending Machine Market Regional Insights:
North America held the highest share in the industrial vending machine market in 2025. North America is expected to continue to dominate the market in 2032 i.e. the end of the forecast period due to the presence of many key players in the region.
The increased usage of Personal Protective Equipment vending machines and raised awareness about labor wellbeing are the primary drivers driving industry growth. Authorities are also investing heavily in vending tech, which is expected to support the growth of the north america industrial vending machine market in the forecast period.
However, because of the negative impacts of the coronavirus outbreak on the food service, infrastructure, and production industries, the value of the American market declined dramatically in 2020. Due to the suspension of several active manufacturing facilities and supply chain interruptions, the acceptance and usage of industrial vending machines were severely hampered in 2020.
The purpose of this research is to provide stakeholders in the industry with a thorough insight into the Industrial Vending Machine Market. The study includes an analysis of difficult data in simple language, as well as the industry's historical and current state, as well as anticipated market size and trends. The market report examines all segments of the industry, with a focus on significant players such as market leaders, followers, and new entrants. The report includes a PORTER, PESTEL analysis as well as the possible influence of microeconomic market determinants. External and internal elements that are expected to have a favorable or negative impact on the firm have been examined, providing decision-makers with a clear future vision of the industry. The research also aids in comprehending the Industrial Vending Machine Market dynamics and structure by studying market segments and forecasting market size. The research is an investor's guide since it depicts the competitive analysis of major competitors in the market by product, price, financial situation, product portfolio, growth plans, and geographical presence.
Breakthroughs in the Industrial Vending Machine industry are discussed, as well as organic and inorganic growth plans. Various companies are focusing on organic growth strategies such as new product releases, product approvals, and other items such as patents and events. Inorganic growth strategies used in the industry included acquisitions, partnerships, and collaborations.
Industrial Vending Machine Market Scope:
|
Industrial Vending Machine Market |
|
|
Market Size in 2025 |
USD 2.99 Bn. |
|
Market Size in 2032 |
USD 5.06 Bn. |
|
CAGR (2026-2032) |
7.8 % |
|
Historic Data |
2020-2025 |
|
Base Year |
2025 |
|
Forecast Period |
2026-2032 |
|
Segment Scope |
by Offering
|
|
by type
|
|
|
by end user
|
|
|
Regional Scope |
North America- United States, Canada, and Mexico Europe – UK, France, Germany, Italy, Spain, Sweden, Austria, and Rest of Europe Asia Pacific – China, India, Japan, South Korea, Australia, ASEAN, Rest of APAC Middle East and Africa - South Africa, GCC, Egypt, Nigeria, Rest of the Middle East and Africa South America – Brazil, Argentina, Rest of South America |
Industrial Vending Machine Market Players:
- Fastenal Company (US)
- AutoCrib, Inc.(US)
- Airgas, Inc. (US)
- SupplyPoint (UK)
- Brammer (UK)
- SupplyPro, Inc.(US)
- CribMaster (US)
- IVM, Inc. (US)
- SecuraStock, LLC (US)
- Silkron (Malaysia)
- Intelligent Dispensing Solutions (US)
- AutomatyBHP (Canada)
- MSC Industrial Direct Co. Inc. (US)
- W.W. Grainger, Inc. (Us)
- Seaga Manufacturing Inc. (US)
Frequently Asked Questions
The management difficulties for different entities on the manufacturing side is a restraint in the market growth.
The key players are IVM, Airgas, etc.
the coil vending machine segment is expected to grow at a CAGR of 4.2% in the forecast period.
Chapter 1 Scope of the Report
Chapter 2 Research Methodology
2.1.Research Process
2.2.Global Industrial Vending Machine Market: Target Audience
2.3.Global Industrial Vending Machine Market: Primary Research (As per Client Requirement)
2.4.Global Industrial Vending Machine Market: Secondary Research
Chapter 3 Executive Summary
Chapter 4 Competitive Landscape
4.1.Market Share Analysis, By Value, 2025-2032
4.1.1.Market Share Analysis, By Region, By Value, 2025-2032 (In %)
4.1.1.1.North America Market Share Analysis, By Value, 2025-2032 (In %)
4.1.1.2.Europe Market Share Analysis, By Value, 2025-2032 (In %)
4.1.1.3.Asia Pacific Market Share Analysis, By Value, 2025-2032 (In %)
4.1.1.4.South America Market Share Analysis, By Value, 2025-2032 (In %)
4.1.1.5.Middle East and Africa Market Share Analysis, By Value, 2025-2032 (In %)
4.1.2.Market Share Analysis, By Type, By Value, 2025-2032 (In %)
4.1.2.1.North America Market Share Analysis, By Type, By Value, 2025-2032 (In %)
4.1.2.1.1.USA Market Share Analysis, By Type, By Value, 2025-2032 (In %)
4.1.2.1.2.Canada Market Share Analysis, By Type, By Value, 2025-2032 (In %)
4.1.2.1.3.Mexico Market Share Analysis, By Type, By Value, 2025-2032 (In %)
4.1.2.2.Europe Market Share Analysis, By Type, By Value, 2025-2032 (In %)
4.1.2.2.1.UK Market Share Analysis, By Type, By Value, 2025-2032 (In %)
4.1.2.2.2.France Market Share Analysis, By Type, By Value, 2025-2032 (In %)
4.1.2.2.3.Germany Market Share Analysis, By Type, By Value, 2025-2032 (In %)
4.1.2.2.4.Italy Market Share Analysis, By Type, By Value, 2025-2032 (In %)
4.1.2.2.5.Spain Market Share Analysis, By Type, By Value, 2025-2032 (In %)
4.1.2.2.6.Sweden Market Share Analysis, By Type, By Value, 2025-2032 (In %)
4.1.2.2.7.Austria Market Share Analysis, By Type, By Value, 2025-2032 (In %)
4.1.2.2.8.Rest of Europe Market Share Analysis, By Type, By Value, 2025-2032 (In %)
4.1.2.3.Asia Pacific Market Share Analysis, By Type, By Value, 2025-2032 (In %)
4.1.2.3.1.China Market Share Analysis, By Type, By Value, 2025-2032 (In %)
4.1.2.3.2.India Market Share Analysis, By Type, By Value, 2025-2032 (In %)
4.1.2.3.3.Japan Market Share Analysis, By Type, By Value, 2025-2032 (In %)
4.1.2.3.4.South Korea Market Share Analysis, By Type, By Value, 2025-2032 (In %)
4.1.2.3.5.Australia Market Share Analysis, By Type, By Value, 2025-2032 (In %)
4.1.2.3.6.ASEAN Market Share Analysis, By Type, By Value, 2025-2032 (In %)
4.1.2.3.7.Rest of APAC Market Share Analysis, By Type, By Value, 2025-2032 (In %)
4.1.2.4.South America Market Share Analysis, By Type, By Value, 2025-2032 (In %)
4.1.2.4.1.Brazil Market Share Analysis, By Type, By Value, 2025-2032 (In %)
4.1.2.4.2.Argentina Market Share Analysis, By Type, By Value, 2025-2032 (In %)
4.1.2.4.3.Rest of South America Market Share Analysis, By Type, By Value, 2025-2032 (In %)
4.1.2.5.Middle East and Africa Market Share Analysis, By Type, By Value, 2025-2032 (In %)
4.1.2.5.1.South Africa Market Share Analysis, By Type, By Value, 2025-2032 (In %)
4.1.2.5.2.GCC Market Share Analysis, By Type, By Value, 2025-2032 (In %)
4.1.2.5.3.Egypt Market Share Analysis, By Type, By Value, 2025-2032 (In %)
4.1.2.5.4.Nigeria Market Share Analysis, By Type, By Value, 2025-2032 (In %)
4.1.2.5.5.Rest of Middle East and Africa Market Share Analysis, By Type, By Value, 2025-2032 (In %)
4.1.3.Market Share Analysis, By Offering, By Value, 2025-2032 (In %)
4.1.3.1.North America Market Share Analysis, By Offering, By Value, 2025-2032 (In %)
4.1.3.1.1.USA Market Share Analysis, By Offering, By Value, 2025-2032 (In %)
4.1.3.1.2.Canada Market Share Analysis, By Offering, By Value, 2025-2032 (In %)
4.1.3.1.3.Mexico Market Share Analysis, By Offering, By Value, 2025-2032 (In %)
4.1.3.2.Europe Market Share Analysis, By Offering, By Value, 2025-2032 (In %)
4.1.3.2.1.UK Market Share Analysis, By Offering, By Value, 2025-2032 (In %)
4.1.3.2.2.France Market Share Analysis, By Offering, By Value, 2025-2032 (In %)
4.1.3.2.3.Germany Market Share Analysis, By Offering, By Value, 2025-2032 (In %)
4.1.3.2.4.Italy Market Share Analysis, By Offering, By Value, 2025-2032 (In %)
4.1.3.2.5.Spain Market Share Analysis, By Offering, By Value, 2025-2032 (In %)
4.1.3.2.6.Sweden Market Share Analysis, By Offering, By Value, 2025-2032 (In %)
4.1.3.2.7.Austria Market Share Analysis, By Offering, By Value, 2025-2032 (In %)
4.1.3.2.8.Rest of Europe Market Share Analysis, By Offering, By Value, 2025-2032 (In %)
4.1.3.3.Asia Pacific Market Share Analysis, By Offering, By Value, 2025-2032 (In %)
4.1.3.3.1.China Market Share Analysis, By Offering, By Value, 2025-2032 (In %)
4.1.3.3.2.India Market Share Analysis, By Offering, By Value, 2025-2032 (In %)
4.1.3.3.3.Japan Market Share Analysis, By Offering, By Value, 2025-2032 (In %)
4.1.3.3.4.South Korea Market Share Analysis, By Offering, By Value, 2025-2032 (In %)
4.1.3.3.5.Australia Market Share Analysis, By Offering, By Value, 2025-2032 (In %)
4.1.3.3.6.ASEAN Market Share Analysis, By Offering, By Value, 2025-2032 (In %)
4.1.3.3.7.Rest of APAC Market Share Analysis, By Offering, By Value, 2025-2032 (In %)
4.1.3.4.South America Market Share Analysis, By Offering, By Value, 2025-2032 (In %)
4.1.3.4.1.Brazil Market Share Analysis, By Offering, By Value, 2025-2032 (In %)
4.1.3.4.2.Argentina Market Share Analysis, By Offering, By Value, 2025-2032 (In %)
4.1.3.4.3.Rest of South America Market Share Analysis, By Offering, By Value, 2025-2032 (In %)
4.1.3.5.Middle East and Africa Market Share Analysis, By Offering, By Value, 2025-2032 (In %)
4.1.3.5.1.South Africa Market Share Analysis, By Offering, By Value, 2025-2032 (In %)
4.1.3.5.2.GCC Market Share Analysis, By Offering, By Value, 2025-2032 (In %)
4.1.3.5.3.Egypt Market Share Analysis, By Offering, By Value, 2025-2032 (In %)
4.1.3.5.4.Nigeria Market Share Analysis, By Offering, By Value, 2025-2032 (In %)
4.1.3.5.5.Rest of Middle East and Africa Market Share Analysis, By Offering, By Value, 2025-2032 (In %)
4.1.4.Market Share Analysis, By End-User, By Value, 2025-2032 (In %)
4.1.4.1.North America Market Share Analysis, By End-User, By Value, 2025-2032 (In %)
4.1.4.1.1.USA Market Share Analysis, By End-User, By Value, 2025-2032 (In %)
4.1.4.1.2.Canada Market Share Analysis, By End-User, By Value, 2025-2032 (In %)
4.1.4.1.3.Mexico Market Share Analysis, By End-User, By Value, 2025-2032 (In %)
4.1.4.2.Europe Market Share Analysis, By End-User, By Value, 2025-2032 (In %)
4.1.4.2.1.UK Market Share Analysis, By End-User, By Value, 2025-2032 (In %)
4.1.4.2.2.France Market Share Analysis, By End-User, By Value, 2025-2032 (In %)
4.1.4.2.3.Germany Market Share Analysis, By End-User, By Value, 2025-2032 (In %)
4.1.4.2.4.Italy Market Share Analysis, By End-User, By Value, 2025-2032 (In %)
4.1.4.2.5.Spain Market Share Analysis, By End-User, By Value, 2025-2032 (In %)
4.1.4.2.6.Sweden Market Share Analysis, By End-User, By Value, 2025-2032 (In %)
4.1.4.2.7.Austria Market Share Analysis, By End-User, By Value, 2025-2032 (In %)
4.1.4.2.8.Rest of Europe Market Share Analysis, By End-User, By Value, 2025-2032 (In %)
4.1.4.3.Asia Pacific Market Share Analysis, By End-User, By Value, 2025-2032 (In %)
4.1.4.3.1.China Market Share Analysis, By End-User, By Value, 2025-2032 (In %)
4.1.4.3.2.India Market Share Analysis, By End-User, By Value, 2025-2032 (In %)
4.1.4.3.3.Japan Market Share Analysis, By End-User, By Value, 2025-2032 (In %)
4.1.4.3.4.South Korea Market Share Analysis, By End-User, By Value, 2025-2032 (In %)
4.1.4.3.5.Australia Market Share Analysis, By End-User, By Value, 2025-2032 (In %)
4.1.4.3.6.ASEAN Market Share Analysis, By End-User, By Value, 2025-2032 (In %)
4.1.4.3.7.Rest of APAC Market Share Analysis, By End-User, By Value, 2025-2032 (In %)
4.1.4.4.South America Market Share Analysis, By End-User, By Value, 2025-2032 (In %)
4.1.4.4.1.Brazil Market Share Analysis, By End-User, By Value, 2025-2032 (In %)
4.1.4.4.2.Argentina Market Share Analysis, By End-User, By Value, 2025-2032 (In %)
4.1.4.4.3.Rest of South America Market Share Analysis, By End-User, By Value, 2025-2032 (In %)
4.1.4.5.Middle East and Africa Market Share Analysis, By End-User, By Value, 2025-2032 (In %)
4.1.4.5.1.South Africa Market Share Analysis, By End-User, By Value, 2025-2032 (In %)
4.1.4.5.2.GCC Market Share Analysis, By End-User, By Value, 2025-2032 (In %)
4.1.4.5.3.Egypt Market Share Analysis, By End-User, By Value, 2025-2032 (In %)
4.1.4.5.4.Nigeria Market Share Analysis, By End-User, By Value, 2025-2032 (In %)
4.1.4.5.5.Rest of Middle East and Africa Market Share Analysis, By End-User, By Value, 2025-2032 (In %)
4.2.Stellar Competition matrix
4.2.1.Global Stellar Competition Matrix
4.2.2.North America Stellar Competition Matrix
4.2.3.Europe Stellar Competition Matrix
4.2.4.Asia Pacific Stellar Competition Matrix
4.2.5.South America Stellar Competition Matrix
4.2.6.Middle East and Africa Stellar Competition Matrix
4.3.Key Players Benchmarking
4.3.1.Key Players Benchmarking By Type, Pricing, Market Share, Investments, Expansion Plans, Physical Presence and Presence in the Market.
4.4. Mergers and Acquisitions in Industry
4.4.1.M&A by Region, Value and Strategic Intent
4.5.Market Dynamics
4.5.1.Market Drivers
4.5.2.Market Restraints
4.5.3.Market Opportunities
4.5.4.Market Challenges
4.5.5.PESTLE Analysis
4.5.6.PORTERS Five Force Analysis
4.5.7.Value Chain Analysis
Chapter 5 Global Industrial Vending Machine Market Segmentation: By Type
5.1.Global Industrial Vending Machine Market, By Type, Overview/Analysis, 2025-2032
5.2.Global Industrial Vending Machine Market, By Type, By Value, Market Share (%), 2025-2032 (USD Billion)
5.3.Global Industrial Vending Machine Market, By Type, By Value, -
5.3.1.Vertical Lift Machines
5.3.2.Coil Vending Machines
5.3.3.Carousel Vending Machines
5.3.4.Scale Vending Machines
5.3.5.Other
Chapter 6 Global Industrial Vending Machine Market Segmentation: By Offering
6.1.Global Industrial Vending Machine Market, By Offering, Overview/Analysis, 2025-2032
6.2.Global Industrial Vending Machine Market Size, By Offering, By Value, Market Share (%), 2025-2032 (USD Billion)
6.3.Global Industrial Vending Machine Market, By Offering, By Value, -
6.3.1.Hardware
6.3.2.Software
Chapter 7 Global Industrial Vending Machine Market Segmentation: By End-User
7.1.Global Industrial Vending Machine Market, By End-User, Overview/Analysis, 2025-2032
7.2.Global Industrial Vending Machine Market Size, By End-User, By Value, Market Share (%), 2025-2032 (USD Billion)
7.3.Global Industrial Vending Machine Market, By End-User, By Value, -
7.3.1.Aerospace
7.3.2.Healthcare
7.3.3.Manufacturing
7.3.4.Oil & Gas
7.3.5.Construction
7.3.6.Other
Chapter 8 Global Industrial Vending Machine Market Segmentation: By Region
8.1.Global Industrial Vending Machine Market, By Region – North America
8.1.1.North America Industrial Vending Machine Market Size, By Type, By Value, 2025-2032 (USD Billion)
8.1.2.North America Industrial Vending Machine Market Size, By Offering, By Value, 2025-2032 (USD Billion)
8.1.3.North America Industrial Vending Machine Market Size, By End-User, By Value, 2025-2032 (USD Billion)
8.1.4.By Country – U.S.
8.1.4.1.U.S.Industrial Vending Machine Market Size, By Type, By Value, 2025-2032 (USD Billion)
8.1.4.2.U.S.Industrial Vending Machine Market Size, By Offering, By Value, 2025-2032 (USD Billion)
8.1.4.3.U.S.Industrial Vending Machine Market Size, By End-User, By Value, 2025-2032 (USD Billion)
8.1.4.4.Canada Industrial Vending Machine Market Size, By Value, 2025-2032 (USD Billion)
8.1.4.5.Mexico Industrial Vending Machine Market Size, By Value, 2025-2032 (USD Billion)
8.2. Europe Industrial Vending Machine Market Size, By Value, 2025-2032 (USD Billion)
8.2.1.UK
8.2.2.France
8.2.3.Germany
8.2.4.Italy
8.2.5.Spain
8.2.6.Sweden
8.2.7.Austria
8.2.8.Rest of Europe
8.3. Asia Pacific Industrial Vending Machine Market Size, By Value, 2025-2032 (USD Billion)
8.3.1.China
8.3.2.India
8.3.3.Japan
8.3.4.South Korea
8.3.5.Australia
8.3.6.ASEAN
8.3.7.Rest of APAC
8.4. Middle East and Africa Industrial Vending Machine Market Size, By Value, 2025-2032 (USD Billion)
8.4.1.South Africa
8.4.2.GCC
8.4.3.Egypt
8.4.4.Nigeria
8.4.5.Rest of Middle East and Africa
8.5. South America Industrial Vending Machine Market Size, By Value, 2025-2032 (USD Billion)
8.5.1.Brazil
8.5.2.Argentina
8.5.3.Rest of South America
Chapter 9 Company Profiles
9.1.Key Players
9.1.1.Fastenal Company (US)
9.1.1.1.Company Overview
9.1.1.2.Tube Portfolio
9.1.1.3.Financial Overview
9.1.1.4.Business Strategy
9.1.1.5.Key Developments
9.1.2.AutoCrib, Inc.(US)
9.1.3.Airgas, Inc. (US)
9.1.4.SupplyPoint (UK)
9.1.5.Brammer (UK)
9.1.6.SupplyPro, Inc.(US)
9.1.7.CribMaster (US)
9.1.8.IVM, Inc. (US)
9.1.9.SecuraStock, LLC (US)
9.1.10.Silkron (Malaysia)
9.1.11.Intelligent Dispensing Solutions (US)
9.1.12.AutomatyBHP (Canada)
9.1.13.MSC Industrial Direct Co. Inc. (US)
9.1.14.W.W. Grainger, Inc. (Us)
9.1.15.Seaga Manufacturing Inc. (US)
9.2. Key Findings
9.3. Recommendations