Formalin Market Global Industry Analysis and Forecast (2026-2032) by Derivatives, End-Use, and Region.
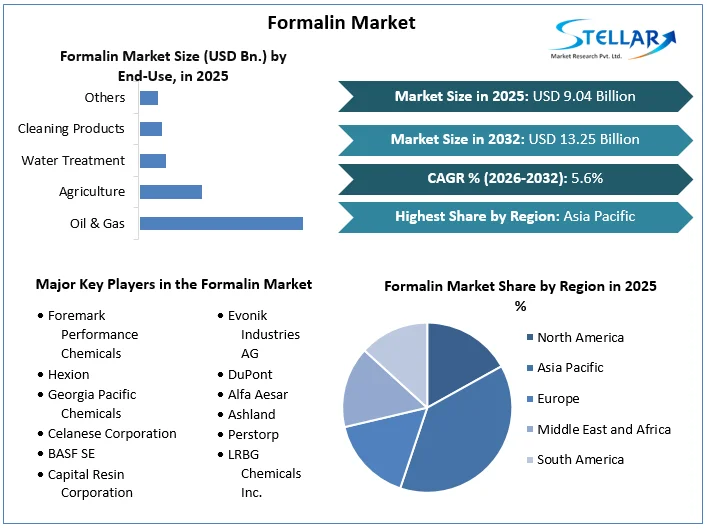
Formalin Market size was valued at US$ 9.04 Billion in 2025 and the Formalin Market revenue is expected to grow at 5.60% through 2026 to 2032, reaching nearly US$ 13.25 Billion.
Formalin Market Overview:
Formaldehyde is an organic molecule with the formula CH2O(HCHO) that occurs naturally. Because the pure chemical is a pungent-smelling colorless gas that spontaneously polymerizes into paraformaldehyde, it is kept as an aqueous solution (formalin). RCHO is the most basic of the aldehydes. This substance's common name derives from its resemblance to and relationship to formic acid.
To get more Insights: Request Free Sample Report
Formalin is a formaldehyde solution in water that has 40% by volume or 37% by mass of formaldehyde. Methanol is also added to Formalin as a stabilizer, which helps to prevent polymerization and oxidation. Methanol content in formalin is usually 10%, however, it can be increased or decreased in small proportions depending on the grade. Formalin is a liquid with various characteristics, including explosiveness, flammability, toxicity, and colorlessness. The explosive chemical is formed when formalin vapor is combined with oxygen molecules in the air. As a result, dealing with Formalin necessitates extreme caution and attention. Formalin is transported mostly in stainless steel and aluminum rail tanks, barrels, and cars, but it can also be transported in polyethylene barrels or cans. This Formalin Market rpeort comes with the segment analysis on the basis of derivatives, end-use and region.
Formalin Market Dynamics:
Thanks to advancements in the paint industry:
In 2023, the formaldehyde market from paints was worth about US $1.02 billion. The demand for high-performance paints and coatings is expected to rise as paint technology advances, allowing for better coatings in architecture, automotive, and electronics applications. Paraformaldehyde and other formaldehyde derivatives are used in the production of paints and coatings. They serve as a long-lasting exterior primer that allows the finished product to be painted with a clear coat, increasing industry demand and helps in growth of Formalin Market.
Manufacturers have been able to produce high-performance and glossy paints for use in automotive to improve vehicle look as a result of the increasing government focus on cheap housing facilities, presenting excellent chances for the formaldehyde market trends.
The agrochemical industry's increased use of paraformaldehyde:
By the end of 2030, the paraformaldehyde derivative market is expected to reach US $275 million. Polyoxymethylene's simplest form is known as paraformaldehyde. These polymerized formaldehyde compounds, with degrees of polymerization ranging from 8 to 100, dissolve quickly in water and chemically react to create methylene hydrate. Because paraformaldehyde is a condensed form of formaldehyde, it has the same properties as formaldehyde but a broader range of applications.

Paraformaldehyde is used in a variety of industries, including paint, chemicals, pharmaceuticals, as well as agrochemicals. Because of its low acid content, it is employed in coating applications to help with gloss control and heat stability. Its low acid content also minimizes the risk of conveying liquid formalin and inhibits the production of acidic by-products. Also, the formaldehyde market share may be driven by the developing agriculture business as a result of rising population and increasing trends to use as much arable land as possible. It is commonly consumed in the production of fertilizers and organic chemical synthesizers.
Adhesives are being used more extensively:
The formalin market is benefiting from an increase in the usage of adhesives thanks to the increased demand for wooden furniture, hardwood floors, and a variety of other items that use adhesives. The widespread use of adhesives to create perfect furniture has driven the consumption of formalin across the globe particularly in the Asia Pacific region because of the continuously growing population demanding better shelter needs.
Fertilizers are becoming more prevalent:
The growth of the fertilizer business has also driven demand Formalin Market as a result of increased food consumption across the globe, which necessitates the consumption of more fertilizers. As the world's population grows, so does the demand for food. The enormous need to drive food production necessitates the widespread use of formalin in fertilizer manufacture.
Stringent rules & regulations:
The European Union has passed a directive stating that formaldehyde and paraformaldehyde should be used in cosmetics at a maximum concentration of 0.2% by weight or volume. Except for nail hardeners and oral hygiene products, these ingredients are allowed in all cosmetic formulations.
Additionally, when the content of either formaldehyde or paraformaldehyde surpasses 0.05%, formaldehyde and paraformaldehyde must be listed as ingredients on cosmetic labels. These regulations are expected to harm the Formalin Market.
Formalin Market Segment Analysis:
Based on Derivatives:
In 2025, the urea-formaldehyde segment dominated the Formalin Market, accounting for more than 35% percent of total revenue. This can be related to the product's increasing use in a variety of end-use industries, such as textiles, foundry sand, paper, electrical appliances, agriculture, and wood glue. High tensile strength, flexural modulus, low water absorption, elongation at break, high thermal distortion temperature, high surface hardness, mold shrinkage, and volume resistance make the goods popular.
UF is also used to improve the wrinkle and shrink resistance of textile fibers. It is also employed as the primary source of nitrogen fertilizers in agriculture. UF is widely utilized as an adhesive and insulating agent in building activities, which is expected to drive the UF market forward over the forecast period.
Detailed analysis of each segment mentioned in the scope table is covered in the SMR’s report.
Formalin Market Regional Insights:
In 2025, the Asia Pacific region dominated the Formalin Market, accounting for more than 50% of total revenue. The rapid rise of the adhesives, vehicle, furniture, and electrical and electronics manufacturing industries is to blame. Because of its low pricing, high reactivity, and high-quality performance, the product is in high demand. Also, the rapidly expanding construction and automobile industries in Asia Pacific countries, particularly China and India, are expected to drive demand for the commodity.
In 2025, Europe was the second-largest formaldehyde market. Over the forecast period, rising formaldehyde demand from the furniture industry in countries such as Russia, Italy, and Germany is likely to drive market growth. Because of the growing need for fiberglass matting in building and construction applications, Germany is Europe's largest consumer of formaldehyde.
Formaldehyde is likely to be insignificant demand in Central and South America (CSA) from a variety of end-use industries, including cosmetics, healthcare, photography, paint, and food. Cosmetics contain the substance as a preservative. The Brazilian Health Regulatory Agency (ANVISA) allows it to be used as a hardening agent in oral hygiene products at a concentration of 0.1% and in nail products at a concentration of 5%.
The report includes a PORTER, PESTEL analysis as well as the possible influence of microeconomic market determinants. External and internal elements that are expected to have a favorable or negative impact on the firm have been examined, providing decision-makers with a clear future vision of the industry. The research also aids in comprehending the Formalin market dynamics and structure by studying market segments and forecasting market size. The research is an investor's guide since it depicts the competitive analysis of major competitors in the Formalin market by product, price, financial situation, product portfolio, growth plans, and geographical presence.
Breakthroughs in the Formalin market are discussed, as well as organic and inorganic growth plans. Various companies are focusing on organic growth strategies such as new product releases, product approvals, and other items such as patents and events. Inorganic growth strategies used in the industry included acquisitions, partnerships, and collaborations.
|
Formalin Market |
|
|
Market Size in 2025 |
USD 9.04 Bn. |
|
Market Size in 2032 |
USD 13.25 Bn. |
|
CAGR (2026-2032) |
5.60 % |
|
Historic Data |
2020-2025 |
|
Base Year |
2025 |
|
Forecast Period |
2026-2032 |
|
Segment Scope |
By Derivatives
|
|
By End-Use
|
|
|
Regional Scope |
North America- United States, Canada, and Mexico Europe – UK, France, Germany, Italy, Spain, Sweden, Austria, and Rest of Europe Asia Pacific – China, India, Japan, South Korea, Australia, ASEAN, Rest of APAC Middle East and Africa - South Africa, GCC, Egypt, Nigeria, Rest of the Middle East and Africa South America – Brazil, Argentina, Rest of South America |
Formalin Market Players
-
Hexion
-
Georgia Pacific Chemicals
-
Celanese Corporation
-
BASF SE
-
Capital Resin Corporation
-
Evonik Industries AG
-
DuPont
-
Alfa Aesar
-
Ashland
-
Perstorp
Frequently Asked Questions
The Asia Pacific region had the highest growth rate in the Formalin market during the year 2025.
Foremark Performance Chemicals, Hexion, Georgia Pacific Chemicals, Celanese Corporation, BASF SE, Capital Resin Corporation, Evonik Industries AG, DuPont, Alfa Aesar, Ashland, Perstorp, LRBG Chemicals Inc., Sumitomo Chemicals, Merck KgaA, and Others.
The global formalin market size was valued at US $ 9.04 Bn. in 2025 and is expected to reach US $ 13.25 Bn. by 2032
1. Formalin Market Introduction
1.1. Study Assumption and Market Definition
1.2. Scope of the Study
1.3. Executive Summary
2. Global Formalin Market: Competitive Landscape
2.1. Stellar Competition Matrix
2.2. Competitive Landscape
2.3. Key Players Benchmarking
2.3.1. Company Name
2.3.2. Product Segment
2.3.3. End-user Segment
2.3.4. Revenue (2025)
2.3.5. Company Locations
2.4. Market Structure
2.4.1. Market Leaders
2.4.2. Market Followers
2.4.3. Emerging Players
2.5. Mergers and Acquisitions Details
3. Formalin Market: Dynamics
3.1. Formalin Market Trends
3.2. Formalin Market Dynamics
3.2.1. Formalin Market Drivers
3.2.2. Formalin Market Restraints
3.2.3. Formalin Market Opportunities
3.2.4. Formalin Market Challenges
3.3. PORTER’s Five Forces Analysis
3.4. PESTLE Analysis
3.5. Value Chain Analysis
3.6. Regulatory Landscape
4. Formalin Market: Global Market Size and Forecast by Segmentation (by Value in USD Million and Volume in Million Square Meters) (2025-2032)
4.1. Formalin Market Size and Forecast, by Derivatives (2025-2032)
4.1.1. Urea Formaldehyde (UF)
4.1.2. Phenol-Formaldehyde (PF)
4.1.3. Melamine Formaldehyde (MF)
4.1.4. Polyacetal Resins
4.1.5. Pentaerythritol
4.1.6. 1,4 Butanediol
4.1.7. Methylenebis
4.1.8. Hexamethylenetetramine (HMTA)
4.1.9. Others
4.2. Formalin Market Size and Forecast, by End-Use (2025-2032)
4.2.1. Building & Construction
4.2.2. Automotive
4.2.3. Furniture
4.2.4. Textile
4.2.5. Healthcare
4.2.6. Oil & Gas
4.2.7. Agriculture
4.2.8. Water Treatment
4.2.9. Cleaning Products
4.2.10. Others
4.3. Formalin Market Size and Forecast, by Region (2025-2032)
4.3.1. North America
4.3.2. Europe
4.3.3. Asia Pacific
4.3.4. Middle East and Africa
4.3.5. South America
5. North America Formalin Market Size and Forecast by Segmentation (by Value in USD Million and Volume in Million Square Meters) (2025-2032)
5.1. North America Formalin Market Size and Forecast, by Derivatives (2025-2032)
5.1.1. Urea Formaldehyde (UF)
5.1.2. Phenol-Formaldehyde (PF)
5.1.3. Melamine Formaldehyde (MF)
5.1.4. Polyacetal Resins
5.1.5. Pentaerythritol
5.1.6. 1,4 Butanediol
5.1.7. Methylenebis
5.1.8. Hexamethylenetetramine (HMTA)
5.1.9. Others
5.2. North America Formalin Market Size and Forecast, by End-Use (2025-2032)
5.2.1. Building & Construction
5.2.2. Automotive
5.2.3. Furniture
5.2.4. Textile
5.2.5. Healthcare
5.2.6. Oil & Gas
5.2.7. Agriculture
5.2.8. Water Treatment
5.2.9. Cleaning Products
5.2.10. Others
5.3. North America Formalin Market Size and Forecast, by Country (2025-2032)
5.3.1. United States
5.3.2. Canada
5.3.3. Mexico
6. Europe Formalin Market Size and Forecast by Segmentation (by Value in USD Million and Volume in Million Square Meters) (2025-2032)
6.1. Europe Formalin Market Size and Forecast, by Derivatives (2025-2032)
6.2. Europe Formalin Market Size and Forecast, by End-Use (2025-2032)
6.3. Europe Formalin Market Size and Forecast, by Country (2025-2032)
6.3.1. United Kingdom
6.3.2. France
6.3.3. Germany
6.3.4. Italy
6.3.5. Spain
6.3.6. Sweden
6.3.7. Austria
6.3.8. Rest of Europe
7. Asia Pacific Formalin Market Size and Forecast by Segmentation (by Value in USD Million and Volume in Million Square Meters) (2025-2032)
7.1. Asia Pacific Formalin Market Size and Forecast, by Derivatives (2025-2032)
7.2. Asia Pacific Formalin Market Size and Forecast, by End-Use (2025-2032)
7.3. Asia Pacific Formalin Market Size and Forecast, by Country (2025-2032)
7.3.1. China
7.3.2. S Korea
7.3.3. Japan
7.3.4. India
7.3.5. Australia
7.3.6. Indonesia
7.3.7. Malaysia
7.3.8. Vietnam
7.3.9. Taiwan
7.3.10. Rest of Asia Pacific
8. Middle East and Africa Formalin Market Size and Forecast by Segmentation (by Value in USD Million and Volume in Million Square Meters) (2025-2032)
8.1. Middle East and Africa Formalin Market Size and Forecast, by Derivatives (2025-2032)
8.2. Middle East and Africa Formalin Market Size and Forecast, by End-Use (2025-2032)
8.3. Middle East and Africa Formalin Market Size and Forecast, by Country (2025-2032)
8.3.1. South Africa
8.3.2. GCC
8.3.3. Nigeria
8.3.4. Rest of ME&A
9. South America Formalin Market Size and Forecast by Segmentation (by Value in USD Million and Volume in Million Square Meters) (2025-2032)
9.1. South America Formalin Market Size and Forecast, by Derivatives (2025-2032)
9.2. South America Formalin Market Size and Forecast, by End-Use (2025-2032)
9.3. South America Formalin Market Size and Forecast, by Country (2025-2032)
9.3.1. Brazil
9.3.2. Argentina
9.3.3. Rest Of South America
10. Company Profile: Key Players
10.1. Foremark Performance Chemicals
10.1.1. Company Overview
10.1.2. Business Portfolio
10.1.3. Financial Overview
10.1.4. SWOT Analysis
10.1.5. Strategic Analysis
10.1.6. Recent Developments
10.2. Hexion
10.3. Georgia Pacific Chemicals
10.4. Celanese Corporation
10.5. BASF SE
10.6. Capital Resin Corporation
10.7. Evonik Industries AG
10.8. DuPont
10.9. Alfa Aesar
10.10. Ashland
10.11. Perstorp
10.12. LRBG Chemicals Inc.
11. Key Findings
12. Industry Recommendations
13. Formalin Market: Research Methodology