Flavoured Water Market- Global Industry Analysis and Forecast (2026-2032) by Distribution Channel, Type, and Region
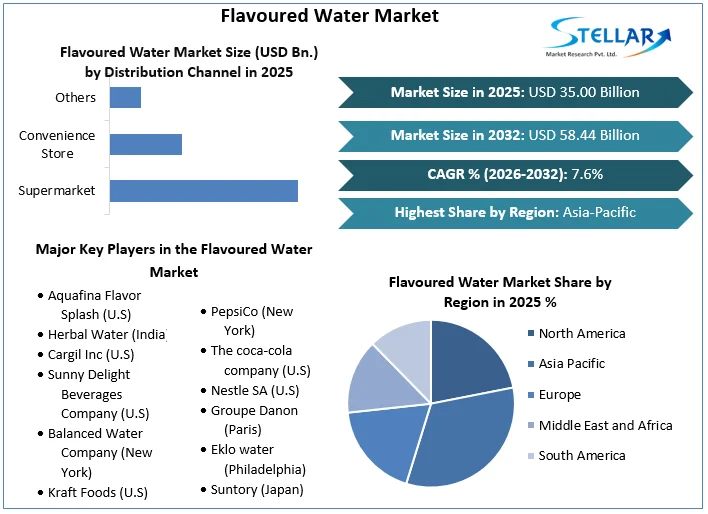
Flavoured Water Market size was valued at US$ 35.00 Bn. in 2025. The Global Flavoured Water Market is estimated to grow at a CAGR of 7.6% over the forecast period.
Flavoured Water Market Definition:
Water that has been sweetened with sugar or artificial sweeteners and has natural or artificial flavourings is known as flavoured water. To improve the taste of water, regular and synthetic flavours are added to Flavoured Water. Flavoured waters contain vitamins, minerals, spices, sweeteners, spring water, and artificial tastes, and they have a high nutritional value and provide customers with numerous health benefits such as blood system, weight management, and hunger control. It is a member of the category of beverages that have a taste comparable to water. The Flavoured Water Market report's segment analysis is provided on the basis of type and distribution channel.
The flavoured water market has grown as the population has grown, disposable income has increased, and people have become more aware of the health benefits of drinking water. Enhanced water is a type of beverage that contains natural or artificial tastes, sugar, sweeteners, vitamins, and minerals in addition to water. The majority of flavoured waters have fewer calories than non-diet soft beverages.
To get more Insights: Request Free Sample Report
Flavoured Water Market Dynamics:
Increasing consumer choice for healthful options to sugary tender drinks are driving the growth of the Flavoured Water Market:
The market is being fueled by a growing awareness of the importance of drinking healthy and regular water components. Flavoured water is a better alternative than soda. It is a great drink that's low in carbs and sugar, and some of them have almost no calories. Consumer preferences are shifting the flavoured water hydration industry toward carbonated drinks and drinks with a lot of sugar. The rising occurrence of plumpness and increasing awareness of healthy lifestyles among the urban population is projected to continue to drive the Flavoured Water Market.
It is growing more popular as customers health worries keep them away from artificially flavoured beverages and fizzy drinks. During the forecast period, this tendency is expected to fuel the growth of the flavoured market. The healthiest soda is Sierra Mist. Sierra Mist Lemon-lime drink has 140 calories, 37 grammes of carbohydrates, and 35 milligrammes of sodium per can, putting it slightly ahead of its nearest competition. This mist is another major factor driving the growth of the flavoured water market.
The market's expansion is being hampered by the availability of low-cost substitutes:
Fruits or Citrus infused water, unsweetened iced, Low sodium broths are common substitutes for the Flavoured Water Market. Flavoured liquids are a good option for plain water. Carbonated drinks are another major substitute for flavoured water. The carbonated drink contains high sugar levels in flavoured water, with a significant proportion of sugar turning into obesity in the liver. Carbonated drinks can cause a variety of health problems, including metabolic syndrome, low blood sugar, and high blood pressure which is witnessing the restraining factor for the market.
The growth of organised retail stores is creating a big market opportunity:
Flavoured water is available in a range of forms, ranging from the elegant to the simple, as seen in restaurants. Customers benefit from organised retail because they have access to a larger assortment of items, as well as greater convenience and a better shopping experience for various kinds of water. An increase in the number of working women, technological effect, rising income, and the emergence of a rural market are some of the factors that are contributing to the flavoured water market growth.
Plastic packaging is becoming more popular which is major challenging factor for the market:
Bottled water firms take just as much care with their packaging as they do with their water, choosing materials that are safe for their customer’s health and leave a small environmental footprint. Plastic bottled water containers utilise far less energy to manufacture, transport and recycle than metal, cartons, and glass containers. All bottled water in plastic containers, including the cap, is 100% recyclable. These factors are considered as the major challenging factor for the flavoured water market.
Flavoured Water Market Segment Analysis:
By Type, the market is segmented as Sparkling, Still, and Others. Sparkling Flavoured water dominated the market with a 59.2% share in 2025. As a healthy alternative to fizzy drinks, sparkling waters with added benefits of fruits and herbs are in hot demand. Sparkling drinks with low or no sugar and zero calories have grown in popularity among youthful health-conscious consumers over the years. Because of their taste, fizz, and health benefits, sparkling varieties are becoming increasingly popular. Several brands, notably Nestle Pure Life, provide a variety of fruit-flavoured zero-calorie and zero-sweetener products. By adding this kind of factor, this segment is expected to give lucrative growth for the Flavoured Water Market.
However, The Still segment is expected to grow at a CAGR of 5.4% through the forecast period. Consumer demand for non-carbonated drinks and a healthy lifestyle are two significant factors driving this segment's rise.

By Distribution Channel, the market is segmented as Supermarket, Convenience Store and Others. The Supermarket segment dominated the market with a 62.3% share in 2025. In the United Kingdom, the sale of flavoured water in supermarkets has climbed to 8.2% of the market. Adding diversity to flavoured water in supermarkets and hypermarkets can attract customers and boost the Flavoured Water Market's profitability. The production of flavoured water has expanded in several nations, including Australia and China, which is seen to be a contributing cause to the segment's growth.
However, The Still segment is expected to grow at a CAGR of 6.4% through the forecast period. They're known as natural destination retail places, and they help to promote the market for flavoured water. This segment provides several advantages, including lower product costs, a competitive advantage.
Flavoured Water Market Regional Insights:
The Asia Pacific flavoured water market dominated with a 54.6% share in 2025. This region has a greater consumer base in terms of the preferred water market. In nations such as China, India, and Japan, Flavoured Water has a wider market base. Due to increased awareness of several health benefits such as immune boosters, lower cholesterol, and weight loss, the market for Flavoured Water is growing in these countries. Due to increased disposable income and rapid development, the United States has the largest market share for preferred water.
However, The North American region is expected to grow at a CAGR of 7.4% through the forecast period. Because of its strong growth in the United States, the developed market of North America is the dominant region for functional ingredients added water sales. In the United States, bottled water sales have lately exceeded soft drink sales. Various trends, as well as the product's health and wellness features, are contributing to its increased usage.
The objective of the report is to present a comprehensive analysis of the Global Flavoured Water Market to the stakeholders in the industry. The report provides trends that are most dominant in the Global Flavoured Water Market and how these trends will influence new business investments and market development throughout the forecast period. The report also aids in the comprehension of the global market dynamics and competitive structure of the market by analyzing market leaders, market followers, and regional players.
The qualitative and quantitative data provided in the Global Flavoured Water Market report is to help understand which market segments, regions are expected to grow at higher rates, factors affecting the market, and key opportunity areas, which will drive the industry and market growth through the forecast period. The report also includes the competitive landscape of key players in the industry along with their recent developments in the Global Flavoured Water Market. The report studies factors such as company size, market share, market growth, revenue, production volume, and profits of the key players in the global market.
The report provides Porter's Five Force Model, which helps in designing the business strategies in the market. The report helps in identifying how many rivals are existing, who they are, and how their product quality is in the Global Flavoured Water Market. The report also analyses if the Global Flavoured Water Market is easy for a new player to gain a foothold in the market, do they enter or exit the market regularly if the market is dominated by a few Players, etc.
The report also includes a PESTEL Analysis, which aids in the development of company strategies. Political variables help in figuring out how much a government can influence the Global Flavoured Water Market. Economic variables aid in the analysis of economic performance drivers that have an impact on the Global Flavoured Water Market. Understanding the impact of the surrounding environment and the influence of environmental concerns on the global market is aided by legal factors.
Flavoured Water Market Scope:
|
Flavoured Water Market Scope |
|
|
Market Size in 2025 |
USD 35.00 Bn. |
|
Market Size in 2032 |
USD 58.44 Bn. |
|
CAGR (2026-2032) |
7.6% |
|
Historic Data |
2020-2025 |
|
Base Year |
2025 |
|
Forecast Period |
2026-2032 |
|
Segment Scope |
By Type
|
|
By Distribution Channel
|
|
|
Regional Scope |
North America- United States, Canada, and Mexico Europe – UK, France, Germany, Italy, Spain, Sweden, Austria, and Rest of Europe Asia Pacific – China, India, Japan, South Korea, Australia, ASEAN, Rest of APAC Middle East and Africa - South Africa, GCC, Egypt, Nigeria, Rest of the Middle East and Africa South America – Brazil, Argentina, Rest of South America |
Flavoured Water Market key players:
- Aquafina Flavor Splash (U.S)
- Herbal Water (India)
- Cargil Inc (U.S)
- Sunny Delight Beverages Company (U.S)
- Balanced Water Company (New York)
- Kraft Foods (U.S)
- New York Spring Water (New York)
- PepsiCo (New York)
- The coca-cola company (U.S)
- Nestle SA (U.S)
- Groupe Danon (Paris)
- Eklo water (Philadelphia)
- Suntory (Japan)
- Vieve Protein Water (United Kingdom)
- Hint water (U.S)
Frequently Asked Questions
The Asia Pacific region is expected to hold the highest share in the Global Flavoured Water Market.
The market size of the Global Flavoured Water Market is expected to be 58.44 Bn. by 2032.
The forecast period for the Global Flavoured Water Market is 2026-2032.
The market size of the Global Flavoured Water Market in 2025 was US$ 35.00 Bn.
1. Flavoured Water Market Introduction
1.1. Study Assumption and Market Definition
1.2. Scope of the Study
1.3. Executive Summary
2. Global Flavoured Water Market: Competitive Landscape
2.1. SMR Competition Matrix
2.2. Competitive Landscape
2.3. Key Players Benchmarking
2.3.1. Company Name
2.3.2. Product Segment
2.3.3. End User Segment
2.3.4. Revenue (2025)
2.3.5. Company Locations
2.4. Market Structure
2.4.1. Market Leaders
2.4.2. Market Followers
2.4.3. Emerging Players
2.5. Mergers and Acquisitions Details
3. Flavoured Water Market: Dynamics
3.1. Flavoured Water Market Trends by Region
3.1.1. North America
3.1.2. Europe
3.1.3. Asia Pacific
3.1.4. Middle East and Africa
3.1.5. South America
3.2. Flavoured Water Market Dynamics
3.2.1. Flavoured Water Market Drivers
3.2.2. Flavoured Water Market Restraints
3.2.3. Flavoured Water Market Opportunities
3.2.4. Flavoured Water Market Challenges
3.3. PORTER’s Five Forces Analysis
3.4. PESTLE Analysis
3.5. Value Chain Analysis
3.6. Trade Analysis
3.7. Regulatory Landscape
3.8. Key Opinion Leaders Analysis for the Flavoured Water Industry
4. Flavoured Water Market: Global Market Size and Forecast by Segmentation (by Value in USD Million and Volume in Litres) (2025-2032)
4.1. Flavoured Water Market Size and Forecast, by Type (2025-2032)
4.1.1. Sparkling
4.1.2. Still
4.1.3. Others
4.2. Flavoured Water Market Size and Forecast, by Distribution Channel (2025-2032)
4.2.1. Supermarket
4.2.2. Convenience Store
4.2.3. Others
4.3. Flavoured Water Market Size and Forecast, by Region (2025-2032)
4.3.1. North America
4.3.2. Europe
4.3.3. Asia Pacific
4.3.4. Middle East and Africa
4.3.5. South America
5. North America Flavoured Water Market Size and Forecast by Segmentation (by Value in USD Million and Volume in Litres) (2025-2032)
5.1. North America Flavoured Water Market Size and Forecast, by Type (2025-2032)
5.1.1. Sparkling
5.1.2. Still
5.1.3. Others
5.2. North America Flavoured Water Market Size and Forecast, by Distribution Channel (2025-2032)
5.2.1. Supermarket
5.2.2. Convenience Store
5.2.3. Others
5.3. North America Flavoured Water Market Size and Forecast, by Country (2025-2032)
5.3.1. United States
5.3.2. Canada
5.3.3. Mexico
6. Europe Flavoured Water Market Size and Forecast by Segmentation (by Value in USD Million and Volume in Litres) (2025-2032)
6.1. Europe Flavoured Water Market Size and Forecast, by Type (2025-2032)
6.2. Europe Flavoured Water Market Size and Forecast, by Distribution Channel (2025-2032)
6.3. Europe Flavoured Water Market Size and Forecast, by Country (2025-2032)
6.3.1. United Kingdom
6.3.2. France
6.3.3. Germany
6.3.4. Italy
6.3.5. Spain
6.3.6. Sweden
6.3.7. Austria
6.3.8. Rest of Europe
7. Asia Pacific Flavoured Water Market Size and Forecast by Segmentation (by Value in USD Million and Volume in Litres) (2025-2032)
7.1. Asia Pacific Flavoured Water Market Size and Forecast, by Type (2025-2032)
7.2. Asia Pacific Flavoured Water Market Size and Forecast, by Distribution Channel (2025-2032)
7.3. Asia Pacific Flavoured Water Market Size and Forecast, by Country (2025-2032)
7.3.1. China
7.3.2. S Korea
7.3.3. Japan
7.3.4. India
7.3.5. Australia
7.3.6. Indonesia
7.3.7. Malaysia
7.3.8. Vietnam
7.3.9. Taiwan
7.3.10. Rest of Asia Pacific
8. Middle East and Africa Flavoured Water Market Size and Forecast by Segmentation (by Value in USD Million and Volume in Litres) (2025-2032)
8.1. Middle East and Africa Flavoured Water Market Size and Forecast, by Type (2025-2032)
8.2. Middle East and Africa Flavoured Water Market Size and Forecast, by Distribution Channel (2025-2032)
8.3. Middle East and Africa Flavoured Water Market Size and Forecast, by Country (2025-2032)
8.3.1. South Africa
8.3.2. GCC
8.3.3. Nigeria
8.3.4. Rest of ME&A
9. South America Flavoured Water Market Size and Forecast by Segmentation (by Value in USD Million and Volume in Litres) (2025-2032)
9.1. South America Flavoured Water Market Size and Forecast, by Type (2025-2032)
9.2. South America Flavoured Water Market Size and Forecast, by Distribution Channel (2025-2032)
9.3. South America Flavoured Water Market Size and Forecast, by Country (2025-2032)
9.3.1. Brazil
9.3.2. Argentina
9.3.3. Rest Of South America
10. Company Profile: Key Players
10.1. Aquafina Flavor Splash (U.S)
10.1.1. Company Overview
10.1.2. Business Portfolio
10.1.3. Financial Overview
10.1.4. SWOT Analysis
10.1.5. Strategic Analysis
10.1.6. Recent Developments
10.2. Herbal Water (India)
10.3. Cargil Inc (U.S)
10.4. Sunny Delight Beverages Company (U.S)
10.5. Balanced Water Company (New York)
10.6. Kraft Foods (U.S)
10.7. New York Spring Water (New York)
10.8. PepsiCo (New York)
10.9. The coca-cola company (U.S)
10.10. Nestle SA (U.S)
10.11. Groupe Danon (Paris)
10.12. Eklo water (Philadelphia)
10.13. Suntory (Japan)
10.14. Vieve Protein Water (United Kingdom)
10.15. Hint water (U.S)
11. Key Findings
12. Industry Recommendations
13. Flavoured Water Market: Research Methodology