Artificial Meat Market Global Industry Analysis and Forecast (2026-2032) by Source, Application, Strategies, Trends and Region
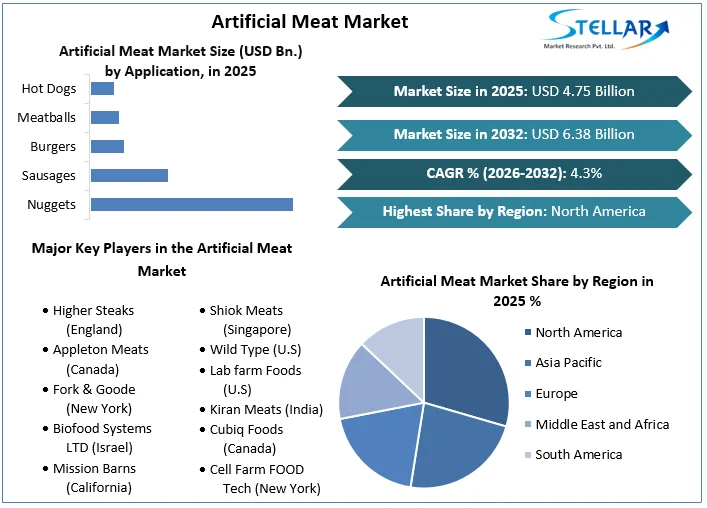
The Artificial Meat Market size was valued at US$ 4.75 Bn in 2025. The Global Artificial Meat Market is estimated to grow at a CAGR of 4.3% over the forecast period.
Artificial Meat Market Definition:
Artificial meat, also known as cultured meat or cell-based meat, is made from a small sample of animal tissue that is cultivated in a nutrient-rich environment to mimic the nutritional profile of traditional meat. Artificial meat is made from animal cells cultured in vitro rather than from murdered animals. It is classified as a type of cellular agriculture. Many of the same tissue engineering techniques used in regenerative medicine are employed to create artificial meat. Artificial Meat Market report is come up with the PESTLE analysis, PORTER's five force analysis and segment analysis on the basis of source, application and region.
In comparison to regular meat, the use of artificial meat has several potential health, environmental, cultural, and economic implications. Cultured meat is made in a lab from a few animal cells and is sometimes referred to as lab-grown, clean, or cultivated meat. It's real meat, but unlike traditional meat, it doesn't necessitate the death of animals.
To get more Insights: Request Free Sample Report
Artificial Meat Market Dynamics:
The artificial meat market is growing as a result of rising meat consumption, greater demand for nutritious meat, and rising consumer spending power:
Because of the scale of its ethical, human health, and environmental implications, the meat business has come under increased criticism in recent years. The aforementioned problems, together with projections that demand for protein products would continue to rise over the forecast period, indicate a pressing need for more nutritional, animal welfare-conscious, and sustainable protein product approaches. However, the demand for nutritious meat remains constant as one of the most nutritious meats that can consume is liver, particularly the beef liver. It's high in high-quality protein, as well as it also contains vitamins A, B12, and B6, iron, zinc, and vital amino acids.
Consumer demand for meat and animal-derived goods has fueled the expansion of cellular agriculture, which uses in-vitro cultivation to create animal proteins with less animal-derived material than the present meat industry. The concept aims to satisfy an end-user who wants to consume meat products while also ensuring total food security and reducing the food production's environmental impact.
Certain strict rules in organically adapted food products can stifle the development of artificial meat which is hampering the growth of the market:
Regarding product safety, FDA is working with USDA to monitor cage-raised beef and poultry using its current regulatory framework. However, artificial meat foods are under the sole control of the FDA. There are two regulatory bodies for the artificial meat market: the Food and Drug Administration (FDA) and the USDA. These regulators may use certain strict rules for organically modified foods which is a major reason for restraining the market.
Customer preferences are shifting, and people are becoming more health-conscious which is giving a huge opportunity for the market:
Because of shifting customer behaviour, the meat sector has undergone a drastic transformation. Market expansion is fueled by expanding spending power, rising demand for takeaway meals, busy lifestyles, rising health consciousness, and longer working hours. The meat business has been forced to use novel technology to generate goods that would meet both the evolving and rising demand of customers as a result of changing client preferences. It's also providing growth chances for newcomers to the alternative meat business, allowing them to achieve market momentum by developing new products that meet consumer demand. Due to this factor, it gives a huge opportunity for the artificial meat market.
Artificial Meat Market Segment Analysis:
By Source, the market is segmented as Poultry, Pork, Beef, Duck, and Others. The Poultry segment dominated the market with a 36.1% share in 2025. Because of the growing number of manufacturers in the artificial meat market, the cost-effectiveness of cultured chicken products compared to other sources, the accessible supply of protein, low-fat content, and minimal religious constraints, the poultry segment is expected to increase significantly. Rapid urbanisation, combined with the expanding popularity of poultry products in fast-food restaurants, has prompted producers to develop novel alternative items to suit rising customer demand. Due to this factor, this segment is witnessing rapid growth.
However, The Pork segment is expected to grow at a CAGR of 5.3% through the forecast period. Pork is the name given to the meat of a domestic pig in the culinary world. It is the most widely consumed meat in the European region. Pork is consumed both fresh and preserved. Pork is sliced into five basic sections: pork shoulder, picnic shoulder, loin, side, and leg, which are subsequently divided into smaller slices at the meat counter or butcher. This segment is expected to grow in the artificial meat market throughout the forecast period because pork shoulder is taken from the top of the pig shoulder is slightly tough and is often marketed as a boneless roast.

By Application, the market is segmented as Nuggets, Sausages, Burgers, Meatballs, and Hot Dogs. The Nuggets segment dominated the artificial meat market with a 45.2% share in 2025. Due to customer preferences for nuggets as snacks in developed countries such as the United Kingdom, Germany, Canada, and the United States, the nugget market is expected to see significant demand. Consumer’s good attitude toward clean meat and rising demand for cultured meat are some of the driving reasons projected for the segment's growth.
However, the meatballs segment during the forecast period will be in rising demand as it is made with ground meat that has been shaped into a small ball with other ingredients including bread crumbs, minced onion, eggs, butter, and seasoning. Meatballs can be prepared in a variety of ways, including frying, baking, or braising in sauce.
Artificial Meat Market Regional Insights:
The North American region dominated the market with a 35.2% share in 2025. Due to the meat-eating population and increased investments and research on product growth, the fake meat market in North America is expected to have strong demand throughout the forecast period. Furthermore, the global presence of cultured meat producers is likely to provide good change & development opportunities in the region. There is moderate industrial competition, with a small number of meat substitute producers. During the forecast period, however, increased industry rivalry is expected to be bolstered by new entrants, diversified customer preferences, and rising demand. The sector is currently characterised by research and development initiatives to create superior products while adhering to food regulations.
The objective of the report is to present a comprehensive analysis of the Global Artificial Meat market to the stakeholders in the industry. The report provides trends that are most dominant in the Global Artificial Meat market and how these trends will influence new business investments and market development throughout the forecast period. The report also aids in the comprehension of the global market dynamics and competitive structure of the market by analyzing market leaders, market followers, and regional players.
The qualitative and quantitative data provided in the Global Artificial Meat market report is to help understand which market segments, regions are expected to grow at higher rates, factors affecting the market, and key opportunity areas, which will drive the industry and market growth through the forecast period. The report also includes the competitive landscape of key players in the industry along with their recent developments in the Global Artificial Meat market. The report studies factors such as company size, market share, market growth, revenue, production volume, and profits of the key players in the global market.
The report provides Porter's Five Force Model, which helps in designing the business strategies in the market. The report helps in identifying how many rivals are existing, who they are, and how their product quality is in the Global Artificial Meat market. The report also analyses if the Global Artificial Meat market is easy for a new player to gain a foothold in the market, do they enter or exit the market regularly if the market is dominated by a few Players, etc.
The report also includes a PESTEL Analysis, which aids in the development of company strategies. Political variables help in figuring out how much a government can influence the Global Artificial Meat market. Economic variables aid in the analysis of economic performance drivers that have an impact on the Global Artificial Meat market. Understanding the impact of the surrounding environment and the influence of environmental concerns on the global market is aided by legal factors.
Artificial Meat Market Scope:
|
Artificial Meat Market |
|
|
Market Size in 2025 |
USD 4.75 Bn. |
|
Market Size in 2032 |
USD 6.38 Bn. |
|
CAGR (2026-2032) |
4.3% |
|
Historic Data |
2020-2025 |
|
Base Year |
2025 |
|
Forecast Period |
2026-2032 |
|
Segment Scope |
By Application
|
|
By Source
|
|
|
Regional Scope |
North America- United States, Canada, and Mexico Europe – UK, France, Germany, Italy, Spain, Sweden, Austria, and Rest of Europe Asia Pacific – China, India, Japan, South Korea, Australia, ASEAN, Rest of APAC Middle East and Africa - South Africa, GCC, Egypt, Nigeria, Rest of the Middle East and Africa South America – Brazil, Argentina, Rest of South America |
Artificial Meat Market Key Players:
- Higher Steaks (England)
- Appleton Meats (Canada)
- Fork & Goode (New York)
- Biofood Systems LTD (Israel)
- Mission Barns (California)
- BlueNalu, Inc. (California)
- Mutable (U.S)
- Seafuture Sustainable Biotech (Canada)
- Shiok Meats (Singapore)
- Wild Type (U.S)
- Lab farm Foods (U.S)
- Kiran Meats (India)
- Cubiq Foods (Canada)
- Cell Farm FOOD Tech (New York)
- Mosameat (Netherlands)
Frequently Asked Questions
The North American region is expected to hold the highest share in the Artificial Meat Market.
The market size of the Artificial Meat Market is expected to be 6.38 Bn by 2032
The forecast period for the Artificial Meat Market is 2026-2032.
The market size of the Artificial Meat Market in 2025 was US$ 4.75 Bn.
1. Artificial Meat Market Introduction
1.1. Study Assumption and Market Definition
1.2. Scope of the Study
1.3. Executive Summary
2. Global Artificial Meat Market: Competitive Landscape
2.1. SMR Competition Matrix
2.2. Competitive Landscape
2.3. Key Players Benchmarking
2.3.1. Company Name
2.3.2. Product Segment
2.3.3. End User Segment
2.3.4. Revenue (2025)
2.3.5. Company Locations
2.4. Market Structure
2.4.1. Market Leaders
2.4.2. Market Followers
2.4.3. Emerging Players
2.5. Mergers and Acquisitions Details
3. Artificial Meat Market: Dynamics
3.1. Artificial Meat Market Trends by Region
3.1.1. North America
3.1.2. Europe
3.1.3. Asia Pacific
3.1.4. Middle East and Africa
3.1.5. South America
3.2. Artificial Meat Market Dynamics
3.2.1. Artificial Meat Market Drivers
3.2.2. Artificial Meat Market Restraints
3.2.3. Artificial Meat Market Opportunities
3.2.4. Artificial Meat Market Challenges
3.3. PORTER’s Five Forces Analysis
3.4. PESTLE Analysis
3.5. Value Chain Analysis
3.6. Trade Analysis
3.7. Regulatory Landscape
3.8. Key Opinion Leaders Analysis for the Artificial Meat Industry
4. Artificial Meat Market: Global Market Size and Forecast by Segmentation (by Value in USD Million and Volume in Tons) (2025-2032)
4.1. Artificial Meat Market Size and Forecast, by Application (2025-2032)
4.1.1. Nuggets
4.1.2. Sausages
4.1.3. Burgers
4.1.4. Meatballs
4.1.5. Hot Dogs
4.2. Artificial Meat Market Size and Forecast, by Source (2025-2032)
4.2.1. Poultry
4.2.2. Pork
4.2.3. Beef
4.2.4. Duck
4.2.5. Others
4.3. Artificial Meat Market Size and Forecast, by Region (2025-2032)
4.3.1. North America
4.3.2. Europe
4.3.3. Asia Pacific
4.3.4. Middle East and Africa
4.3.5. South America
5. North America Artificial Meat Market Size and Forecast by Segmentation (by Value in USD Million and Volume in Tons) (2025-2032)
5.1. North America Artificial Meat Market Size and Forecast, by Application (2025-2032)
5.1.1. Nuggets
5.1.2. Sausages
5.1.3. Burgers
5.1.4. Meatballs
5.1.5. Hot Dogs
5.2. North America Artificial Meat Market Size and Forecast, by Source (2025-2032)
5.2.1. Poultry
5.2.2. Pork
5.2.3. Beef
5.2.4. Duck
5.2.5. Others
5.3. North America Artificial Meat Market Size and Forecast, by Country (2025-2032)
5.3.1. United States
5.3.2. Canada
5.3.3. Mexico
6. Europe Artificial Meat Market Size and Forecast by Segmentation (by Value in USD Million and Volume in Tons) (2025-2032)
6.1. Europe Artificial Meat Market Size and Forecast, by Application (2025-2032)
6.2. Europe Artificial Meat Market Size and Forecast, by Source (2025-2032)
6.3. Europe Artificial Meat Market Size and Forecast, by Country (2025-2032)
6.3.1. United Kingdom
6.3.2. France
6.3.3. Germany
6.3.4. Italy
6.3.5. Spain
6.3.6. Sweden
6.3.7. Austria
6.3.8. Rest of Europe
7. Asia Pacific Artificial Meat Market Size and Forecast by Segmentation (by Value in USD Million and Volume in Tons) (2025-2032)
7.1. Asia Pacific Artificial Meat Market Size and Forecast, by Application (2025-2032)
7.2. Asia Pacific Artificial Meat Market Size and Forecast, by Source (2025-2032)
7.3. Asia Pacific Artificial Meat Market Size and Forecast, by Country (2025-2032)
7.3.1. China
7.3.2. S Korea
7.3.3. Japan
7.3.4. India
7.3.5. Australia
7.3.6. Indonesia
7.3.7. Malaysia
7.3.8. Vietnam
7.3.9. Taiwan
7.3.10. Rest of Asia Pacific
8. Middle East and Africa Artificial Meat Market Size and Forecast by Segmentation (by Value in USD Million and Volume in Tons) (2025-2032)
8.1. Middle East and Africa Artificial Meat Market Size and Forecast, by Application (2025-2032)
8.2. Middle East and Africa Artificial Meat Market Size and Forecast, by Source (2025-2032)
8.3. Middle East and Africa Artificial Meat Market Size and Forecast, by Country (2025-2032)
8.3.1. South Africa
8.3.2. GCC
8.3.3. Nigeria
8.3.4. Rest of ME&A
9. South America Artificial Meat Market Size and Forecast by Segmentation (by Value in USD Million and Volume in Tons) (2025-2032)
9.1. South America Artificial Meat Market Size and Forecast, by Application (2025-2032)
9.2. South America Artificial Meat Market Size and Forecast, by Source (2025-2032)
9.3. South America Artificial Meat Market Size and Forecast, by Country (2025-2032)
9.3.1. Brazil
9.3.2. Argentina
9.3.3. Rest Of South America
10. Company Profile: Key Players
10.1. Higher Steaks (England)
10.1.1. Company Overview
10.1.2. Business Portfolio
10.1.3. Financial Overview
10.1.4. SWOT Analysis
10.1.5. Strategic Analysis
10.1.6. Recent Developments
10.2. Appleton Meats (Canada)
10.3. Fork & Goode (New York)
10.4. Biofood Systems LTD (Israel)
10.5. Mission Barns (California)
10.6. BlueNalu, Inc. (California)
10.7. Mutable (U.S)
10.8. Seafuture Sustainable Biotech (Canada)
10.9. Shiok Meats (Singapore)
10.10. Wild Type (U.S)
10.11. Lab farm Foods (U.S)
10.12. Kiran Meats (India)
10.13. Cubiq Foods (Canada)
10.14. Cell Farm FOOD Tech (New York)
10.15. Mosameat (Netherlands)
11. Key Findings
12. Industry Recommendations
13. Artificial Meat Market: Research Methodology