Device-as-a-Service Market Industry Overview (2026-2032) by Offering, Device Type, Organization Size, End-User and, Region.
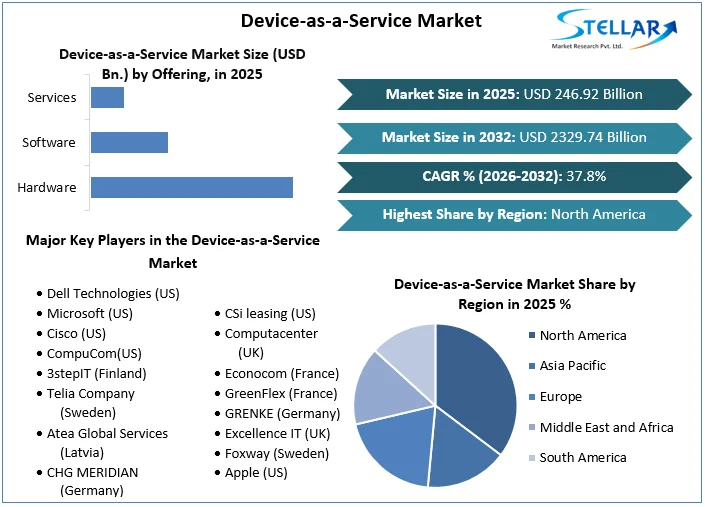
Device-as-a-Service Market size was valued at US$ 246.92 Billion in 2025 and the total Device-as-a-Service revenue is expected to grow at 37.8% through 2026 to 2032, reaching nearly US$ 2329.74 Billion.
Device-as-a-Service Market Overview:
DaaS offers prompt software and hardware upgrades and support, helping businesses to minimize their IT load; also, the approach aids in avoiding technology stagnation, thus improving efficiency. The flexible structure of device-as-a-service allows organizations to ramp up the number of devices and connected services. During the projected period, these aspects are likely to drive the market. The device-as-a-service market is steadily gaining traction amongst big and small and medium-sized businesses because it helps them to obtain hardware e.g. laptops, PCs, cellphones, and i-pads with preset applications or services.
Moreover, the quick acceptance of the premium service, greater compliance programs, better user output, reduced help desk costs, and the rising need for cost-effective and protected devices have boosted overall growth. The expansion of the startup environment is projected to fuel the adoption of the DaaS model. However, a lack of technological skills and the implementation of Choose Your Own Device rules may stymie industry progress.
The market's growth drivers, as well as the market's segments (Offering, Device Type, Organization Size, End-User and, Region), are analyzed in this research. Market participants, regions, and special requirements have all provided data. This market study provides an in-depth look at all of the important advancements that are currently taking place across all industry sectors. Statistics, infographics, and presentations are used to provide key data analysis. The analysis looks at the market's Drivers, Restraints, Opportunities, and Challenges for the Device-as-a-Service market. The study aids in the evaluation of market growth drivers and the determination of how to employ these drivers as a tool. The research also aids in the correction and resolution of difficulties with the global Device-as-a-Service market.
To get more Insights: Request Free Sample Report
Device-as-a-Service Market Dynamics:
A few of the key driver of the Device-as-a-Service Market is the fast acceptance of the membership services model. Consumers can prevent the high cost of obtaining the latest tech from capital spending to an upfront investment by using premium account-based device-as-a-service models. Various firms, small, medium, and big can use this to open up capital for investment in revenue-generating strategic projects. Other advantages include compliance requirements, the opportunity to employ cutting-edge innovations, and access to specialized services e.g. system configuration, deployment, data transmission, on-site assistance, and technological recycling.
Lack of understanding about the advantages of the device-as-a-service approach is a key barrier impeding its acceptance and so limiting its growth. Businesses in emerging countries e.g. Malaysia, China, Brazil, and Indonesia typically have lower acceptance of these offerings because they are unfamiliar with the concept e.g. data protection, cost savings, and a huge number of components to choose from provided by device-as-a-service; as a result, they are much less interested in adopting this service strategy.
Many industries have grown their usage of device-as-a-service, with corporations expanding their overall use of cloud-based solutions, mostly owing to safety concerns. Furthermore, safety expenditures and the number of public cloud suppliers have expanded dramatically, and many clients are constantly installing safe and robust systems in the cloud wherever feasible. As a result, security issues connected with employing a new service strategy are a key impediment to mass acceptance of device-as-a-service. Information security and data privacy laws are critical, particularly in the financial industry, because the cornerstone of banking is built on trust and trustworthiness.
Device-as-a-Service Market Segment Analysis:
By End-User, the IT & Telecom segment dominated the Device-as-a-Service Market in 2025. It is expected to grow at the highest CAGR of 15.8% in the aforementioned forecast period.
Access to safe, dependable, and increased performance IT equipment is critical to the operations of the IT and telecommunications sectors; as a result, the category creates the most substantial demand for IT devices e.g. laptops, and smartphones. Furthermore, the necessity for frequent upgrades of devices and hardware services is increasing in this market, adding to continued growth for device-as-a-service.
Device-as-a-service offers regular hardware & system upgrades and servicing, allowing businesses to decrease IT responsibilities while also avoiding technology stagnation, which ultimately improves productivity. Adopting device-as-a-service in the IT and telecommunications sector helps firms minimize IT expenditures by offering fair prices for leasing hardware, avoiding delays, and effectively handling gadgets by offering application security services.
Firms e.g. Cognizant Connect utilize HP's device-as-a-service offerings; these organizations' usage of device-as-a-service strategies has helped them increase their performance and effectiveness while saving time and money. Furthermore, with rising awareness about the potential advantages of device-as-a-service and a movement in inclination from the Capital costs strategy to the Operational expenditure corporate framework in order to save extra expenditures in IT architecture, the Device-as-a-Service Market is expected to grow rapidly.
Device-as-a-Service Market Regional Insights:
North America accounted for the largest revenue share of 28.5% in 2025. North America was among the first to embrace cutting-edge infrastructure, the Internet of Things, and innovative solutions like device-as-a-service. In terms of regulatory norms for entrepreneurs and major firms, the local market is also feasible. These elements are expected to boost the market growth in the forecast period. Rapid growth for the device-as-a-service model in IT and telecoms, as well as growing preference for portable devices across many industries, are likely to drive North America Device-as-a-Service Market growth.
Over the projection period, APAC is predicted to grow at the fastest CAGR. Some of the world's fastest-growing countries, e.g. India and China, are located in APAC. The growing number of internet users and the uninterrupted rise of various sectors for example life sciences in countries e.g. Japan may also reflect well for regional market growth.
The purpose of this research is to provide stakeholders in the industry with a thorough insight into the Device-as-a-Service Market. The study includes an analysis of difficult data in simple language, as well as the industry's historical and current state, as well as anticipated market size and trends. The market report examines all segments of the industry, with a focus on significant players such as market leaders, followers, and new entrants. The report includes a PORTER, PESTEL analysis as well as the possible influence of microeconomic market determinants. External and internal elements that are expected to have a favorable or negative impact on the firm have been examined, providing decision-makers with a clear future vision of the industry. The research also aids in comprehending the Device-as-a-Service Market dynamics and structure by studying market segments and forecasting market size. The research is an investor's guide since it depicts the competitive analysis of major competitors in the market by product, price, financial situation, product portfolio, growth plans, and geographical presence.
Breakthroughs in the Device-as-a-Service market are discussed, as well as organic and inorganic growth plans. Various companies are focusing on organic growth strategies such as new product releases, product approvals, and other items such as patents and events. Inorganic growth strategies used in the industry included acquisitions, partnerships, and collaborations.
Device-as-a-Service Market Scope:
|
Device-as-a-Service Market |
|
|
Market Size in 2025 |
USD 246.92 Bn. |
|
Market Size in 2032 |
USD 2329.74 Bn. |
|
CAGR (2026-2032) |
37.8% |
|
Historic Data |
2020-2025 |
|
Base Year |
2025 |
|
Forecast Period |
2026-2032 |
|
Segment Scope |
by Offering
|
|
by Device Type
|
|
|
by Organization Size
|
|
|
by End-User
|
|
|
Regional Scope |
North America- United States, Canada, and Mexico Europe – UK, France, Germany, Italy, Spain, Sweden, Austria, and Rest of Europe Asia Pacific – China, India, Japan, South Korea, Australia, ASEAN, Rest of APAC Middle East and Africa - South Africa, GCC, Egypt, Nigeria, Rest of the Middle East and Africa South America – Brazil, Argentina, Rest of South America |
Device-as-a-Service Market Players:
- Dell Technologies (US)
- Microsoft (US)
- Cisco (US)
- CompuCom(US)
- 3stepIT (Finland)
- Telia Company (Sweden)
- Atea Global Services (Latvia)
- CHG MERIDIAN (Germany)
- CSi leasing (US)
- Computacenter (UK)
- Econocom (France)
- GreenFlex (France)
- GRENKE (Germany)
- Excellence IT (UK)
- Foxway (Sweden)
- Apple (US)
Frequently Asked Questions
Lack of understanding about the advantages of the device-as-a-service approach is a key barrier impeding its acceptance and so limiting its growth.
The key players are Apple, Dell, etc.
the IT & Telecom segment is expected to grow at the highest CAGR of 15.8% in the aforementioned forecast period.
Chapter 1 Scope of the Report
Chapter 2 Research Methodology
2.1.Research Process
2.2.Global Device-as-a-Service Market: Target Audience
2.3.Global Device-as-a-Service Market: Primary Research (As per Client Requirement)
2.4.Global Device-as-a-Service Market: Secondary Research
Chapter 3 Executive Summary
Chapter 4 Competitive Landscape
4.1.Market Share Analysis, By Value, 2025-2032
4.1.1.Market Share Analysis, By Region, By Value, 2025-2032 (In %)
4.1.1.1.North America Market Share Analysis, By Value, 2025-2032 (In %)
4.1.1.2.Europe Market Share Analysis, By Value, 2025-2032 (In %)
4.1.1.3.Asia Pacific Market Share Analysis, By Value, 2025-2032 (In %)
4.1.1.4.South America Market Share Analysis, By Value, 2025-2032 (In %)
4.1.1.5.Middle East and Africa Market Share Analysis, By Value, 2025-2032 (In %)
4.1.2. Market Share Analysis, By Offering, By Value, 2025-2032 (In %)
4.1.2.1.North America Market Share Analysis, By Offering, By Value, 2025-2032 (In %)
4.1.2.1.1.USA Market Share Analysis, By Offering, By Value, 2025-2032 (In %)
4.1.2.1.2.Canada Market Share Analysis, By Offering, By Value, 2025-2032 (In %)
4.1.2.1.3.Mexico Market Share Analysis, By Offering, By Value, 2025-2032 (In %)
4.1.2.2.Europe Market Share Analysis, By Offering, By Value, 2025-2032 (In %)
4.1.2.2.1.UK Market Share Analysis, By Offering, By Value, 2025-2032 (In %)
4.1.2.2.2.France Market Share Analysis, By Offering, By Value, 2025-2032 (In %)
4.1.2.2.3.Germany Market Share Analysis, By Offering, By Value, 2025-2032 (In %)
4.1.2.2.4.Italy Market Share Analysis, By Offering, By Value, 2025-2032 (In %)
4.1.2.2.5.Spain Market Share Analysis, By Offering, By Value, 2025-2032 (In %)
4.1.2.2.6.Sweden Market Share Analysis, By Offering, By Value, 2025-2032 (In %)
4.1.2.2.7.Austria Market Share Analysis, By Offering, By Value, 2025-2032 (In %)
4.1.2.2.8.Rest of Europe Market Share Analysis, By Offering, By Value, 2025-2032 (In %)
4.1.2.3.Asia Pacific Market Share Analysis, By Offering, By Value, 2025-2032 (In %)
4.1.2.3.1.China Market Share Analysis, By Offering, By Value, 2025-2032 (In %)
4.1.2.3.2.India Market Share Analysis, By Offering, By Value, 2025-2032 (In %)
4.1.2.3.3.Japan Market Share Analysis, By Offering, By Value, 2025-2032 (In %)
4.1.2.3.4.South Korea Market Share Analysis, By Offering, By Value, 2025-2032 (In %)
4.1.2.3.5.Australia Market Share Analysis, By Offering, By Value, 2025-2032 (In %)
4.1.2.3.6.ASEAN Market Share Analysis, By Offering, By Value, 2025-2032 (In %)
4.1.2.3.7.Rest of APAC Market Share Analysis, By Offering, By Value, 2025-2032 (In %)
4.1.2.4.South America Market Share Analysis, By Offering, By Value, 2025-2032 (In %)
4.1.2.4.1.Brazil Market Share Analysis, By Offering, By Value, 2025-2032 (In %)
4.1.2.4.2.Argentina Market Share Analysis, By Offering, By Value, 2025-2032 (In %)
4.1.2.4.3.Rest of South America Market Share Analysis, By Offering, By Value, 2025-2032 (In %)
4.1.2.5.Middle East and Africa Market Share Analysis, By Offering, By Value, 2025-2032 (In %)
4.1.2.5.1.South Africa Market Share Analysis, By Offering, By Value, 2025-2032 (In %)
4.1.2.5.2.GCC Market Share Analysis, By Offering, By Value, 2025-2032 (In %)
4.1.2.5.3.Egypt Market Share Analysis, By Offering, By Value, 2025-2032 (In %)
4.1.2.5.4.Nigeria Market Share Analysis, By Offering, By Value, 2025-2032 (In %)
4.1.2.5.5.Rest of Middle East and Africa Market Share Analysis, By Offering, By Value, 2025-2032 (In %)
4.1.3.Market Share Analysis, By Device Type, By Value, 2025-2032 (In %)
4.1.3.1.North America Market Share Analysis, By Device Type, By Value, 2025-2032 (In %)
4.1.3.1.1.USA Market Share Analysis, By Device Type, By Value, 2025-2032 (In %)
4.1.3.1.2.Canada Market Share Analysis, By Device Type, By Value, 2025-2032 (In %)
4.1.3.1.3.Mexico Market Share Analysis, By Device Type, By Value, 2025-2032 (In %)
4.1.3.2.Europe Market Share Analysis, By Device Type, By Value, 2025-2032 (In %)
4.1.3.2.1.UK Market Share Analysis, By Device Type, By Value, 2025-2032 (In %)
4.1.3.2.2.France Market Share Analysis, By Device Type, By Value, 2025-2032 (In %)
4.1.3.2.3.Germany Market Share Analysis, By Device Type, By Value, 2025-2032 (In %)
4.1.3.2.4.Italy Market Share Analysis, By Device Type, By Value, 2025-2032 (In %)
4.1.3.2.5.Spain Market Share Analysis, By Device Type, By Value, 2025-2032 (In %)
4.1.3.2.6.Sweden Market Share Analysis, By Device Type, By Value, 2025-2032 (In %)
4.1.3.2.7.Austria Market Share Analysis, By Device Type, By Value, 2025-2032 (In %)
4.1.3.2.8.Rest of Europe Market Share Analysis, By Device Type, By Value, 2025-2032 (In %)
4.1.3.3.Asia Pacific Market Share Analysis, By Device Type, By Value, 2025-2032 (In %)
4.1.3.3.1.China Market Share Analysis, By Device Type, By Value, 2025-2032 (In %)
4.1.3.3.2.India Market Share Analysis, By Device Type, By Value, 2025-2032 (In %)
4.1.3.3.3.Japan Market Share Analysis, By Device Type, By Value, 2025-2032 (In %)
4.1.3.3.4.South Korea Market Share Analysis, By Device Type, By Value, 2025-2032 (In %)
4.1.3.3.5.Australia Market Share Analysis, By Device Type, By Value, 2025-2032 (In %)
4.1.3.3.6.ASEAN Market Share Analysis, By Device Type, By Value, 2025-2032 (In %)
4.1.3.3.7.Rest of APAC Market Share Analysis, By Device Type, By Value, 2025-2032 (In %)
4.1.3.4.South America Market Share Analysis, By Device Type, By Value, 2025-2032 (In %)
4.1.3.4.1.Brazil Market Share Analysis, By Device Type, By Value, 2025-2032 (In %)
4.1.3.4.2.Argentina Market Share Analysis, By Device Type, By Value, 2025-2032 (In %)
4.1.3.4.3.Rest of South America Market Share Analysis, By Device Type, By Value, 2025-2032 (In %)
4.1.3.5.Middle East and Africa Market Share Analysis, By Device Type, By Value, 2025-2032 (In %)
4.1.3.5.1.South Africa Market Share Analysis, By Device Type, By Value, 2025-2032 (In %)
4.1.3.5.2.GCC Market Share Analysis, By Device Type, By Value, 2025-2032 (In %)
4.1.3.5.3.Egypt Market Share Analysis, By Device Type, By Value, 2025-2032 (In %)
4.1.3.5.4.Nigeria Market Share Analysis, By Device Type, By Value, 2025-2032 (In %)
4.1.3.5.5.Rest of Middle East and Africa Market Share Analysis, By Device Type, By Value, 2025-2032 (In %)
4.1.4.Market Share Analysis, By Organization Size, By Value, 2025-2032 (In %)
4.1.4.1.North America Market Share Analysis, By Organization Size, By Value, 2025-2032 (In %)
4.1.4.1.1.USA Market Share Analysis, By Organization Size, By Value, 2025-2032 (In %)
4.1.4.1.2.Canada Market Share Analysis, By Organization Size, By Value, 2025-2032 (In %)
4.1.4.1.3.Mexico Market Share Analysis, By Organization Size, By Value, 2025-2032 (In %)
4.1.4.2.Europe Market Share Analysis, By Organization Size, By Value, 2025-2032 (In %)
4.1.4.2.1.UK Market Share Analysis, By Organization Size, By Value, 2025-2032 (In %)
4.1.4.2.2.France Market Share Analysis, By Organization Size, By Value, 2025-2032 (In %)
4.1.4.2.3.Germany Market Share Analysis, By Organization Size, By Value, 2025-2032 (In %)
4.1.4.2.4.Italy Market Share Analysis, By Organization Size, By Value, 2025-2032 (In %)
4.1.4.2.5.Spain Market Share Analysis, By Organization Size, By Value, 2025-2032 (In %)
4.1.4.2.6.Sweden Market Share Analysis, By Organization Size, By Value, 2025-2032 (In %)
4.1.4.2.7.Austria Market Share Analysis, By Organization Size, By Value, 2025-2032 (In %)
4.1.4.2.8.Rest of Europe Market Share Analysis, By Organization Size, By Value, 2025-2032 (In %)
4.1.4.3.Asia Pacific Market Share Analysis, By Organization Size, By Value, 2025-2032 (In %)
4.1.4.3.1.China Market Share Analysis, By Organization Size, By Value, 2025-2032 (In %)
4.1.4.3.2.India Market Share Analysis, By Organization Size, By Value, 2025-2032 (In %)
4.1.4.3.3.Japan Market Share Analysis, By Organization Size, By Value, 2025-2032 (In %)
4.1.4.3.4.South Korea Market Share Analysis, By Organization Size, By Value, 2025-2032 (In %)
4.1.4.3.5.Australia Market Share Analysis, By Organization Size, By Value, 2025-2032 (In %)
4.1.4.3.6.ASEAN Market Share Analysis, By Organization Size, By Value, 2025-2032 (In %)
4.1.4.3.7.Rest of APAC Market Share Analysis, By Organization Size, By Value, 2025-2032 (In %)
4.1.4.4.South America Market Share Analysis, By Organization Size, By Value, 2025-2032 (In %)
4.1.4.4.1.Brazil Market Share Analysis, By Organization Size, By Value, 2025-2032 (In %)
4.1.4.4.2.Argentina Market Share Analysis, By Organization Size, By Value, 2025-2032 (In %)
4.1.4.4.3.Rest of South America Market Share Analysis, By Organization Size, By Value, 2025-2032 (In %)
4.1.4.5.Middle East and Africa Market Share Analysis, By Organization Size, By Value, 2025-2032 (In %)
4.1.4.5.1.South Africa Market Share Analysis, By Organization Size, By Value, 2025-2032 (In %)
4.1.4.5.2.GCC Market Share Analysis, By Organization Size, By Value, 2025-2032 (In %)
4.1.4.5.3.Egypt Market Share Analysis, By Organization Size, By Value, 2025-2032 (In %)
4.1.4.5.4.Nigeria Market Share Analysis, By Organization Size, By Value, 2025-2032 (In %)
4.1.4.5.5.Rest of Middle East and Africa Market Share Analysis, By Organization Size, By Value, 2025-2032 (In %)
4.1.5.Market Share Analysis, By End-User, By Value, 2025-2032 (In %)
4.1.5.1.North America Market Share Analysis, By End-User, By Value, 2025-2032 (In %)
4.1.5.1.1.USA Market Share Analysis, By End-User, By Value, 2025-2032 (In %)
4.1.5.1.2.Canada Market Share Analysis, By End-User, By Value, 2025-2032 (In %)
4.1.5.1.3.Mexico Market Share Analysis, By End-User, By Value, 2025-2032 (In %)
4.1.5.2.Europe Market Share Analysis, By End-User, By Value, 2025-2032 (In %)
4.1.5.2.1.UK Market Share Analysis, By End-User, By Value, 2025-2032 (In %)
4.1.5.2.2.France Market Share Analysis, By End-User, By Value, 2025-2032 (In %)
4.1.5.2.3.Germany Market Share Analysis, By End-User, By Value, 2025-2032 (In %)
4.1.5.2.4.Italy Market Share Analysis, By End-User, By Value, 2025-2032 (In %)
4.1.5.2.5.Spain Market Share Analysis, By End-User, By Value, 2025-2032 (In %)
4.1.5.2.6.Sweden Market Share Analysis, By End-User, By Value, 2025-2032 (In %)
4.1.5.2.7.Austria Market Share Analysis, By End-User, By Value, 2025-2032 (In %)
4.1.5.2.8.Rest of Europe Market Share Analysis, By End-User, By Value, 2025-2032 (In %)
4.1.5.3.Asia Pacific Market Share Analysis, By End-User, By Value, 2025-2032 (In %)
4.1.5.3.1.China Market Share Analysis, By End-User, By Value, 2025-2032 (In %)
4.1.5.3.2.India Market Share Analysis, By End-User, By Value, 2025-2032 (In %)
4.1.5.3.3.Japan Market Share Analysis, By End-User, By Value, 2025-2032 (In %)
4.1.5.3.4.South Korea Market Share Analysis, By End-User, By Value, 2025-2032 (In %)
4.1.5.3.5.Australia Market Share Analysis, By End-User, By Value, 2025-2032 (In %)
4.1.5.3.6.ASEAN Market Share Analysis, By End-User, By Value, 2025-2032 (In %)
4.1.5.3.7.Rest of APAC Market Share Analysis, By End-User, By Value, 2025-2032 (In %)
4.1.5.4.South America Market Share Analysis, By End-User, By Value, 2025-2032 (In %)
4.1.5.4.1.Brazil Market Share Analysis, By End-User, By Value, 2025-2032 (In %)
4.1.5.4.2.Argentina Market Share Analysis, By End-User, By Value, 2025-2032 (In %)
4.1.5.4.3.Rest of South America Market Share Analysis, By End-User, By Value, 2025-2032 (In %)
4.1.5.5.Middle East and Africa Market Share Analysis, By End-User, By Value, 2025-2032 (In %)
4.1.5.5.1.South Africa Market Share Analysis, By End-User, By Value, 2025-2032 (In %)
4.1.5.5.2.GCC Market Share Analysis, By End-User, By Value, 2025-2032 (In %)
4.1.5.5.3.Egypt Market Share Analysis, By End-User, By Value, 2025-2032 (In %)
4.1.5.5.4.Nigeria Market Share Analysis, By End-User, By Value, 2025-2032 (In %)
4.1.5.6. Rest of Middle East and Africa Market Share Analysis, By End-User, By Value, 2025-2032 (In %)
4.2.Stellar Competition matrix
4.2.1.Global Stellar Competition Matrix
4.2.2.North America Stellar Competition Matrix
4.2.3.Europe Stellar Competition Matrix
4.2.4.Asia Pacific Stellar Competition Matrix
4.2.5.South America Stellar Competition Matrix
4.2.6.Middle East and Africa Stellar Competition Matrix
4.3. Key Players Benchmarking
4.3.1.Key Players Benchmarking By Offering, Pricing, Market Share, Investments, Expansion Plans, Physical Presence and Presence in the Market.
4.4. Mergers and Acquisitions in Industry
4.4.1.M&A by Region, Value and Strategic Intent
4.5. Market Dynamics
4.5.1.Market Drivers
4.5.2.Market Restraints
4.5.3.Market Opportunities
4.5.4.Market Challenges
4.5.5.PESTLE Analysis
4.5.6.PORTERS Five Force Analysis
4.5.7.Value Chain Analysis
Chapter 5 Global Device-as-a-Service Market Segmentation: By Offering
5.1.Global Device-as-a-Service Market, By Offering, Overview/Analysis, 2025-2032
5.2.Global Device-as-a-Service Market, By Offering, By Value, Market Share (%), 2025-2032 (USD Billion)
5.3.Global Device-as-a-Service Market, By Offering, By Value, -
5.3.1.Hardware
5.3.2.Software
5.3.3.Services
Chapter 6 Global Device-as-a-Service Market Segmentation: By Device Type
6.1.Global Device-as-a-Service Market, By Device Type, Overview/Analysis, 2025-2032
6.2.Global Device-as-a-Service Market Size, By Device Type, By Value, Market Share (%), 2025-2032 (USD Billion)
6.3.Global Device-as-a-Service Market, By Device Type, By Value, -
6.3.1.Desktops
6.3.2.Laptops, Notebooks, and Tablets
6.3.3.Smartphones and Peripherals
Chapter 7 Global Device-as-a-Service Market Segmentation: By Organization Size
7.1.Global Device-as-a-Service Market, By Organization Size, Overview/Analysis, 2025-2032
7.2.Global Device-as-a-Service Market Size, By Organization Size, By Value, Market Share (%), 2025-2032 (USD Billion)
7.3.Global Device-as-a-Service Market, By Organization Size, By Value, -
7.3.1.Small and Medium-sized Enterprises
7.3.2.Large Enterprises
Chapter 8 Global Device-as-a-Service Market Segmentation: By End-User
8.1.Global Device-as-a-Service Market, By End-User, Overview/Analysis, 2025-2032
8.2.Global Device-as-a-Service Market Size, By End-User, By Value, Market Share (%), 2025-2032 (USD Billion)
8.3.Global Device-as-a-Service Market, By End-User, By Value, -
8.3.1.IT & Telecommunications
8.3.2.Healthcare and Life Sciences
8.3.3.Educational Institutions
8.3.4.Banking, Financial Services and Insurance (BFSI)
8.3.5.Public Sector and Government Offices
8.3.6.Other
Chapter 9 Global Device-as-a-Service Market Segmentation: By Region
9.1.Global Device-as-a-Service Market, By Region – North America
9.1.1.North America Device-as-a-Service Market Size, By Offering, By Value, 2025-2032 (USD Billion)
9.1.2.North America Device-as-a-Service Market Size, By Device Type, By Value, 2025-2032 (USD Billion)
9.1.3.North America Device-as-a-Service Market Size, By Organization Size, By Value, 2025-2032 (USD Billion)
9.1.4.North America Device-as-a-Service Market Size, By End-User, By Value, 2025-2032 (USD Billion)
9.1.5.By Country – U.S.
9.1.5.1.U.S.Device-as-a-Service Market Size, By Offering, By Value, 2025-2032 (USD Billion)
9.1.5.2.U.S.Device-as-a-Service Market Size, By Device Type, By Value, 2025-2032 (USD Billion)
9.1.5.3.U.S.Device-as-a-Service Market Size, By Organization Size, By Value, 2025-2032 (USD Billion)
9.1.5.4.U.S.Device-as-a-Service Market Size, By End-User, By Value, 2025-2032 (USD Billion)
9.1.5.5.Canada Device-as-a-Service Market Size, By Value, 2025-2032 (USD Billion)
9.1.5.6.Mexico Device-as-a-Service Market Size, By Value, 2025-2032 (USD Billion)
9.2. Europe Device-as-a-Service Market Size, By Value, 2025-2032 (USD Billion)
9.2.1.UK
9.2.2.France
9.2.3.Germany
9.2.4.Italy
9.2.5.Spain
9.2.6.Sweden
9.2.7.Austria
9.2.8.Rest of Europe
9.3.Asia Pacific Device-as-a-Service Market Size, By Value, 2025-2032 (USD Billion)
9.3.1.China
9.3.2.India
9.3.3.Japan
9.3.4.South Korea
9.3.5.Australia
9.3.6.ASEAN
9.3.7.Rest of APAC
9.4.Middle East and Africa Device-as-a-Service Market Size, By Value, 2025-2032 (USD Billion)
9.4.1.South Africa
9.4.2.GCC
9.4.3.Egypt
9.4.4.Nigeria
9.4.5.Rest of Middle East and Africa
9.5.South America Device-as-a-Service Market Size, By Value, 2025-2032 (USD Billion)
9.5.1.Brazil
9.5.2.Argentina
9.5.3.Rest of South America
Chapter 10 Company Profiles
10.1.Key Players
10.1.1.IT & Telecommunications
10.1.1.1.Company Overview
10.1.1.2.Tube Portfolio
10.1.1.3.Financial Overview
10.1.1.4.Business Strategy
10.1.1.5.Key Developments
10.1.2.Healthcare and Life Sciences
10.1.3.Educational Institutions
10.1.4.Banking, Financial Services and Insurance (BFSI)
10.1.5.Public Sector and Government Offices
10.1.6.Other
10.2. Key Findings
10.3. Recommendations