Circulating Tumor Cells Market Global Industry Outlook and Forecast (2026-2032)
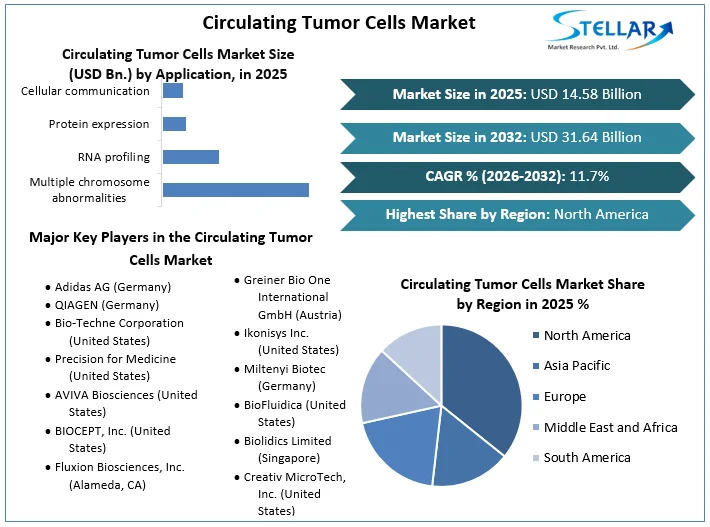
Circulating Tumor Cells Market size was valued at US$ 14.58 Billion in 2025 and the Circulating Tumor Cells revenue is expected to grow at 11.7% through 2026 to 2032, reaching nearly US$ 31.64 Billion.
Circulating Tumor Cells Market Definition & Overview:
Circulating tumour cells (CTCs) is an uncommon type of cell seen in the blood of individuals with solid tumours and act as a seed for metastasis. Cancer spreads via the circulation in two ways: single migratory CTCs and multicellular groupings CTC clusters. CTCs are ideal for creating preclinical models, especially 3D organoid cultures, for drug screening, disease modelling, genome editing, and organoid biobanks. The increased need for preventative medicine and companion diagnostics, as well as the rising incidence of cancer, are driving the circulating tumor cells market forward.
According to the World Health Organization, cancer is the biggest cause of death globally, with approximately 10 million deaths expected by 2020. Tobacco use, a high BMI, a low fruit and vegetable intake, alcohol use, and a lack of physical activity are all contributing to an increase in cancer incidence.
To get more Insights: Request Free Sample Report
Circulating Tumor Cells Market Dynamics:
One of the primary factors driving the growth of the circulating tumor cells market is the government and other government organisations' interest and ambition to enhance finances and activities. One of the factors likely to propel the market's growth through 2032 is an increase in demand for oncology screening, diagnosis, and therapy tracking the patient's illness development.
Additionally, the market is likely to be driven by the increased frequency of various cancers. Breast cancer (2.26 million cases) and lung cancer (2.21 million cases) were the two most frequent cancers in 2020. Early identification of cancer, as well as adequate treatment and care for cancer patients, can help to lower the disease burden. Circulating cancer cells are also well-suited to the development of preclinical models, notably 3D organoid cultures, for use in drug screening, disease modelling, genome editing, and organoid biobanks, which is propelling the circulating tumor cells market forward.
The circulating tumor cells market is being driven by the rising demand for companion diagnostics. Rising R&D of targeted medicines increased desire for customised medicine with increased knowledge in emerging countries, the development of novel biomarkers for various disorders, and a higher number of unmet needs for cancer therapy are all factors boosting demand for companion diagnostics.
Circulating Tumor Cells Market Segment Analysis:
By Technology, The CTC detection and enrichment techniques segment of the circulating tumor cells market, which accounted for 65.8% of sales in 2025, was the most valuable. Over the forecast period, the availability of various technologies for enriching circulating tumour cells in cancer detection is projected to have a major influence on market growth. Additionally, market growth is likely to be fuelled by positive or negative enrichment of circulating tumour cells based on biological features.
The CTC Analysis segment is expected to grow at a 16.1 per cent CAGR, with the United States, Canada, Japan, China, and Europe leading the way. These regional markets, which had a total market value of US$1.1 billion in 2020, are expected to grow to US$3.1 billion by the end of the forecast period. China will continue to be one of the fastest expanding markets in this cluster of regional markets. The Asia-Pacific market, led by nations such as Australia, India, and South Korea, is expected to reach US$2.3 billion by 2030.

Circulating Tumor Cells Market Regional Insights:
North America is expected to continue to have a significant share of the circulating tumor cells market over the forecast period. According to the American Cancer Society, over 15.5 per cent of Americans have a history of cancer in 2019, with the bulk of cases diagnosed during the previous two years. New cases are being recorded in large numbers, with over 1.7 million new cases reported in 2018. The United States ranks among the top countries in the world in terms of healthcare spending, spending 17.1 percent of its total GDP on healthcare. Cancer sufferers spend more money on treatment for breast, lung, colon, and rectum malignancies.
The market in the United States is estimated to be worth $1.8 billion, while China is expected to grow at a 16.6% CAGR. In the United States, the Circulating Tumour Cell (CTC) Diagnostics market is expected to reach US$1.8 billion by 2020. China, the world's second-biggest economy, is expected to reach a projected market size of US$3.3 billion by 2030, representing a CAGR of 16.6 percent from 2020 to 2030. Japan and Canada are two more important geographic markets, with forecasted growth rates of 15.4 percent and 14.8 percent, respectively, from 2020 to 2030. Germany is expected to expand at a CAGR of around 12.6 percent in Europe.
The objective of the report is to present a comprehensive analysis of the Circulating Tumor Cells Market to the stakeholders in the industry. The report provides trends that are most dominant in the Circulating Tumor Cells Market and how these trends will influence new business investments and market development throughout the forecast period. The report also aids in the comprehension of the global market dynamics and competitive structure of the market by analyzing market leaders, market followers, and regional players.
The qualitative and quantitative data provided in the Circulating Tumor Cells Market report is to help understand which market segments, regions are expected to grow at higher rates, factors affecting the market, and key opportunity areas, which will drive the industry and market growth through the forecast period. The report also includes the competitive landscape of key players in the industry along with their recent developments in the Circulating Tumor Cells Market. The report studies factors such as company size, market share, market growth, revenue, production volume, and profits of the key players in the global market.
The report provides Porter's Five Force Model, which helps in designing the business strategies in the market. The report helps in identifying how many rivals are existing, who they are, and how their product quality is in the Market. The report also analyses if the Circulating Tumor Cells Market is easy for a new player to gain a foothold in the market, do they enter or exit the market regularly if the market is dominated by a few players, etc.
Circulating Tumor Cells Market Scope:
|
Circulating Tumor Cells Market |
|
|
Market Size in 2025 |
USD 14.58 Bn. |
|
Market Size in 2032 |
USD 31.64 Bn. |
|
CAGR (2026-2032) |
11.70% |
|
Historic Data |
2020-2025 |
|
Base Year |
2025 |
|
Forecast Period |
2026-2032 |
|
Segment Scope |
by Technology
|
|
By Application
|
|
|
Regional Scope |
North America- United States, Canada, and Mexico Europe – UK, France, Germany, Italy, Spain, Sweden, Austria, and Rest of Europe Asia Pacific – China, India, Japan, South Korea, Australia, ASEAN, Rest of APAC Middle East and Africa - South Africa, GCC, Egypt, Nigeria, Rest of the Middle East and Africa South America – Brazil, Argentina, Rest of South America |
Circulating Tumor Cells Market Players:
- QIAGEN (Germany)
- Bio-Techne Corporation (United States)
- Precision for Medicine (United States)
- AVIVA Biosciences (United States)
- BIOCEPT, Inc. (United States)
- Fluxion Biosciences, Inc. (Alameda, CA)
- Greiner Bio One International GmbH (Austria)
- Ikonisys Inc. (United States)
- Miltenyi Biotec (Germany)
- BioFluidica (United States)
- Biolidics Limited (Singapore)
- Creativ MicroTech, Inc. (United States)
Frequently Asked Questions
the worldwide circulating tumour cells and cancer stem cells market is the government and other government organisations' interest and ambition to enhance finances and activities.
North America is expected to continue to have a significant share of the market over the forecast period.
Cancer sufferers spend more money on treatment for breast, lung, colon, and rectum malignancies.
QIAGEN, Bio-Techne Corporation, Precision for Medicine, AVIVA Biosciences, BIOCEPT, Inc., BioCEP Ltd., Fluxion Biosciences, Inc.
1. Research Methodology
1.1 Research Data
1.1.1. Primary Data
1.1.2. Secondary Data
1.2. Market Size Estimation
1.2.1. Bottom-Up Approach
1.2.2. Top-Up Approach
1.3. Market Breakdown and Data Triangulation
1.4. Research Assumption
2. Circulating Tumor Cells Market Executive Summary
2.1. Market Overview
2.2. Market Size (2025) and Forecast (2026– 2032) and Y-O-Y%
2.3. Market Size (USD) and Market Share (%) – By Segments and Regions
3. Global Circulating Tumor Cells Market: Competitive Landscape
3.1. SMR Competition Matrix
3.2. Key Players Benchmarking
3.2.1. Company Name
3.2.2. Headquarter
3.2.3. Service Segment
3.2.4. End-user Segment
3.2.5. Y-O-Y%
3.2.6. Revenue (2025)
3.2.7. Company Locations
3.3. Market Structure
3.3.1. Market Leaders
3.3.2. Market Followers
3.3.3. Emerging Players
3.4. Consolidation of the Market
3.4.1. Strategic Initiatives and Developments
3.4.2. Mergers and Acquisitions
3.4.3. Collaborations and Partnerships
4. Circulating Tumor Cells Market: Dynamics
4.1. Circulating Tumor Cells Market Trends by Region
4.1.1. North America
4.1.2. Europe
4.1.3. Asia Pacific
4.1.4. Middle East and Africa
4.1.5. South America
4.2. Circulating Tumor Cells Market Drivers
4.3. Circulating Tumor Cells Market Restraints
4.4. Circulating Tumor Cells Market Opportunities
4.5. Circulating Tumor Cells Market Challenges
4.6. PORTER’s Five Forces Analysis
4.6.1. Intensity of the Rivalry
4.6.2. Threat of New Entrants
4.6.3. Bargaining Power of Suppliers
4.6.4. Bargaining Power of Buyers
4.6.5. Threat of Substitutes
4.7. PESTLE Analysis
4.7.1. Political Factors
4.7.2. Economic Factors
4.7.3. Social Factors
4.7.4. Technological Factors
4.7.5. Legal Factors
4.7.6. Environmental Factors
4.8. Technological Roadmap
4.9. Regulatory Landscape
4.9.1. Market Regulation by Region
4.9.1.1. North America
4.9.1.2. Europe
4.9.1.3. Asia Pacific
4.9.1.4. Middle East and Africa
4.9.1.5. South America
4.9.2. Impact of Regulations on Market Dynamics
4.9.3. Government Schemes and Initiatives
5. Circulating Tumor Cells Market: Global Market Size and Forecast by Segmentation (by Value in USD Million) (2025-2032)
5.1. Circulating Tumor Cells Market Size and Forecast, by Technology (2025-2032)
5.1.1. CTC enrichment methods
5.1.2. Positive enrichment
5.1.3. Negative enrichment
5.1.4. Others
5.1.5. CTC detection methods
5.1.6. Immunocytochemical technology
5.1.7. Molecular (RNA)-based technology
5.1.8. Others
5.2. Circulating Tumor Cells Market Size and Forecast, by Application (2025-2032)
5.2.1. Multiple chromosome abnormalities
5.2.2. RNA profiling
5.2.3. Protein expression
5.2.4. Cellular communication
5.2.5. Others
5.3. Circulating Tumor Cells Market Size and Forecast, by Region (2025-2032)
5.3.1. North America
5.3.2. Europe
5.3.3. Asia Pacific
5.3.4. Middle East and Africa
5.3.5. South America
6. North America Circulating Tumor Cells Market Size and Forecast by Segmentation (by Value in USD Million) (2025-2032)
6.1. North America Circulating Tumor Cells Market Size and Forecast, by Technology (2025-2032)
6.1.1. CTC enrichment methods
6.1.2. Positive enrichment
6.1.3. Negative enrichment
6.1.4. Others
6.1.5. CTC detection methods
6.1.6. Immunocytochemical technology
6.1.7. Molecular (RNA)-based technology
6.1.8. Others
6.2. North America Circulating Tumor Cells Market Size and Forecast, by Application (2025-2032)
6.2.1. Multiple chromosome abnormalities
6.2.2. RNA profiling
6.2.3. Protein expression
6.2.4. Cellular communication
6.2.5. Others
6.3. North America Circulating Tumor Cells Market Size and Forecast, by Country (2025-2032)
6.3.1. United States
6.3.2. Canada
6.3.3. Mexico
7. Europe Circulating Tumor Cells Market Size and Forecast by Segmentation (by Value in USD Million) (2025-2032)
7.1. Europe Circulating Tumor Cells Market Size and Forecast, by Technology (2025-2032)
7.2. Europe Circulating Tumor Cells Market Size and Forecast, by Application (2025-2032)
7.3. Europe Circulating Tumor Cells Market Size and Forecast, by Country (2025-2032)
7.3.1. United Kingdom
7.3.2. France
7.3.3. Germany
7.3.4. Italy
7.3.5. Spain
7.3.6. Sweden
7.3.7. Austria
7.3.8. Rest of Europe
8. Asia Pacific Circulating Tumor Cells Market Size and Forecast by Segmentation (by Value in USD Million) (2025-2032)
8.1. Asia Pacific Circulating Tumor Cells Market Size and Forecast, by Technology (2025-2032)
8.2. Asia Pacific Circulating Tumor Cells Market Size and Forecast, by Application (2025-2032)
8.3. Asia Pacific Circulating Tumor Cells Market Size and Forecast, by Country (2025-2032)
8.3.1. China
8.3.2. S Korea
8.3.3. Japan
8.3.4. India
8.3.5. Australia
8.3.6. Indonesia
8.3.7. Malaysia
8.3.8. Vietnam
8.3.9. Taiwan
8.3.10. Rest of Asia Pacific
9. Middle East and Africa Circulating Tumor Cells Market Size and Forecast by Segmentation (by Value in USD Million) (2025-2032)
9.1. Middle East and Africa Circulating Tumor Cells Market Size and Forecast, by Technology (2025-2032)
9.2. Middle East and Africa Circulating Tumor Cells Market Size and Forecast, by Application (2025-2032)
9.3. Middle East and Africa Circulating Tumor Cells Market Size and Forecast, by Country (2025-2032)
9.3.1. South Africa
9.3.2. GCC
9.3.3. Nigeria
9.3.4. Rest of ME&A
10. South America Circulating Tumor Cells Market Size and Forecast by Segmentation (by Value in USD Million) (2025-2032)
10.1. South America Circulating Tumor Cells Market Size and Forecast, by Technology (2025-2032)
10.2. South America Circulating Tumor Cells Market Size and Forecast, by Application (2025-2032)
10.3. South America Circulating Tumor Cells Market Size and Forecast, by Country (2025-2032)
10.3.1. Brazil
10.3.2. Argentina
10.3.3. Rest Of South America
11. Company Profile: Key Players
11.1. QIAGEN (Germany)
11.1.1. Company Overview
11.1.2. Business Portfolio
11.1.3. Financial Overview
11.1.3.1. Total Revenue
11.1.3.2. Segment Revenue
11.1.3.3. Regional Revenue
11.1.4. SWOT Analysis
11.1.5. Strategic Analysis
11.1.6. Recent Developments
11.2. Bio-Techne Corporation (United States)
11.3. Precision for Medicine (United States)
11.4. AVIVA Biosciences (United States)
11.5. BIOCEPT, Inc. (United States)
11.6. Fluxion Biosciences, Inc. (Alameda, CA)
11.7. Greiner Bio One International GmbH (Austria)
11.8. Ikonisys Inc. (United States)
11.9. Miltenyi Biotec (Germany)
11.10. BioFluidica (United States)
11.11. Biolidics Limited (Singapore)
11.12. Creativ MicroTech, Inc. (United States)
12. Key Findings
13. Analyst Recommendations
13.1. Strategic Recommendations
13.2. Future Outlook