Carbon Neutral Market Global Industry Analysis and Forecast (2026-2032), Technology Trends.
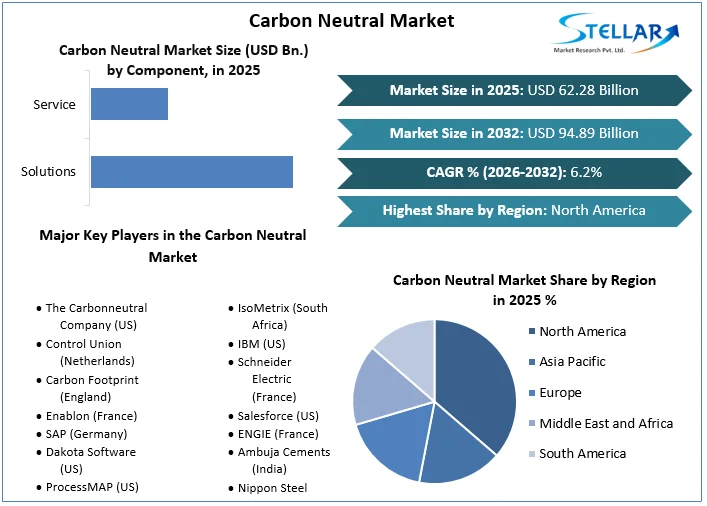
Carbon Neutral Market size was valued at US$ 62.28 Bn. in 2025 and the total revenue is expected to grow at a CAGR of 6.2% through 2026 to 2032, reaching nearly US$ 94.89 Bn.
Carbon Neutral Market Overview:
Carbon-neutrality is achieved when the utility's generation of power sold emits zero CO2 or is offset by sustainable carbon sequestration. When companies, processes, and products quantify their carbon emissions and compensate for them through carbon offsetting programmes, they become carbon neutral. In addition to avoidance and reduction, carbon offsets are an important part of a comprehensive climate strategy.Greenhouse gases, such as CO2, distribute uniformly in the atmosphere, implying that greenhouse gas concentrations are roughly the same everywhere around the globe. As a result, where emissions are created or avoided on the planet has no bearing on the global concentration of greenhouse gases or the greenhouse gas effect. As a result, emissions that cannot be prevented in one location can be offset by carbon offset initiatives in another. This can be accomplished, for example, by forest conservation, afforestation, or the increase of renewable energy sources.
Though Carbon Neutral Market forecasting through 2032 is based on real output, demand and supply of 2025, 2025 numbers are also estimated on real numbers published by key players as well all-important players across the world. Market forecasting till 2032 is done based on past data from 2020 to 2025 with the impact of global lock down on the market in 2020 and 2021.
To get more Insights: Request Free Sample Report
Carbon Neutral Market Dynamics:
In today's society, people prefer to do business with organizations who are socially and environmentally conscious. According to a survey of customers in the United Kingdom and the United States, 88% would prefer companies that would help them "be more ecologically friendly and ethical in your daily life." That implies, if you don't indicate your company is attempting to become carbon-neutral, you risk disappointing a lot of your present and potential customers. Allowing employees to strive toward carbon-neutral solutions pushes them to think outside the box when developing new products and services, resulting in growth of Carbon Neutral Market with increased revenue streams.
Adopting renewable energy solutions as a power source is a key aspect of becoming carbon-neutral. All enterprises, particularly large-scale commercial and industrial operations such as manufacturing, office buildings, hospitality operations such as restaurants and hotels, and retail, face significant electricity expenditures.
Switching to alternative energy sources, such as solar, will lower your expenses immediately, resulting in a lower electricity payment. You may often minimize or eliminate your out-of-pocket payments by taking advantage of government discounts and rebates.
These advantages also apply to business travel. You can cut emissions and associated costs by lowering the number of vehicles on the road and optimizing your commercial travels. This involves cutting down on plane travel as well.
Carbon Neutral Market Segment Analysis:
The Carbon Neutral Market is segmented by Carbon Neutral Fuel, Vertical, and Component.
Based on the Carbon Neutral Fuel, the Carbon Neutral Market is segmented into Biodiesel, Bio-ethanol, Bio-butanol, and others. Biodiesel segment is expected to grow rapidly at a CAGR of xx% during the forecast period 2026-2032. The plants that provide biodiesel with their feedstocks, such as soybeans and palm oil trees, absorb carbon dioxide (CO2) as they grow; this is why the US government considers biodiesel to be carbon-neutral. The CO2 absorbed by these plants compensates for the CO2 produced during the production and combustion of biodiesel. Biodiesel produced in the United States is largely made from soybean oil. Biodiesel can also be made from used vegetable oils or animal fats, such as restaurant grease and oil.
Large areas of natural vegetation and forests have been removed and burned in several regions of the world to cultivate soybeans and palm oil trees for biodiesel production. Land removal and burning may have more severe environmental consequences than the possible benefits of using biodiesel made from soybeans and palm oil trees. These are the key benefits of the biodiesel that are expected to drives the growth of this segment in the carbon neutral market during the forecast period 2025-2032.

Based on the Vertical, the market is segmented into Manufacturing, Energy and Utilities, Residential and Commercial Buildings, Transportation and Logistics, IT and Telecom, and others. Energy and Utilities segment is expected to hold the largest share in the Carbon Neutral Market of xx% by 2032. Global energy consumption has climbed at around twice the average growth rate, according to the International Energy Agency (IEA). The surge is due to a strong global economy and increased heating and cooling needs in a few places of the world. In recent years, demand for fossil fuels, natural gas, solar, and wind energy has increased by double digits. Energy demands increased as a result of increased electricity demand. As a result of the high energy use, CO2 emissions increased by 1.7 percent in 2017.
The development and early adoption of a number of technologies by consumers, businesses, and utilities are paving the way for both power users (individual customers and communities) and power producers (large-scale utilities) to become carbon-neutral. Individual customers can now go "off the grid" with their own renewable energy sources, while commercial consumers and municipalities can pursue the same aim on a bigger scale due to these technologies. Energy efficient technologies, Generation technologies, Grid technologies, and carbon sequestration are the four types of the technology utilised in sustainable energy generation, as well as their impact on customer choice and future business models for power utilities.
Smart home technologies, technology utilised in smart/energy-neutral buildings, innovative interior and outdoor lighting technologies, and sensor-based consumption are all examples of energy efficiency technologies.
Carbon sequestration is the process of removing carbon dioxide and other greenhouse gases from the atmosphere using engineering-based technologies or business-nature collaborations.
Carbon Neutral Market Regional Insights:
North America region is expected to dominate the Carbon Neutral market during the forecast period 2026-2032. North America region is expected to hold the largest market shares of xx% by 2032. President Joe Biden has signed an executive order to make the federal government carbon-neutral by 2050, with a 65% in global-warming greenhouse gas emissions by 2030 and an all-electric fleet of cars and trucks by 2050. According to a recent analysis by DNV, North America must be carbon neutral by 2042 and carbon negative thereafter to satisfy global climate change goals.
Canada recently set a goal of achieving net-zero emissions by 2050, as well as boosted its greenhouse gas reduction targets for 2032. By 2032, it plans to reduce greenhouse gas emissions by 40 to 45 percent compared to 2005 levels. These are the major key drivers that are expected to drives the growth of the North America region in the carbon neutral market during the forecast period 2026-2032
Europe is expected to grow rapidly at a CAGR of xx% during the forecast period 2026-2032. Between 2019 and 2024, the number of carbon-neutral airports in Europe increased dramatically. There were 146 carbon-neutral airports in the Europe as of May 2020, the bulk of which were in Scandinavia. Airports Council International (ACI) Europe launched the Airport Carbon Accreditation programme in 2009 to acknowledge airports' efforts to minimise their carbon footprint. By 3032, ACI hopes to have 100 carbon-neutral airports.
The objective of the report is to present a comprehensive analysis of the Carbon Neutral Market to the stakeholders in the industry. The report provides trends that are most dominant in the Carbon Neutral Market and how these trends will influence new business investments and market development throughout the forecast period. The report also aids in the comprehension of the Carbon Neutral Market dynamics and competitive structure of the market by analyzing market leaders, market followers, and regional players.
The qualitative and quantitative data provided in the Carbon Neutral Market report is to help understand which market segments, regions are expected to grow at higher rates, factors affecting the market, and key opportunity areas, which will drive the industry and market growth through the forecast period. The report also includes the competitive landscape of key players in the industry along with their recent developments in the Carbon Neutral Market. The report studies factors such as company size, market share, market growth, revenue, production volume, and profits of the key players in the Carbon Neutral Market.
The report provides Porter's Five Force Model, which helps in designing the business strategies in the market. The report helps in identifying how many rivals are existing, who they are, and how their product quality is in the Market. The report also analyses if the Carbon Neutral Market is easy for a new player to gain a foothold in the market, do they enter or exit the market regularly if the market is dominated by a few players, etc.
The report also includes a PESTEL Analysis, which aids in the development of company strategies. Political variables help in figuring out how much a government can influence the Market. Economic variables aid in the analysis of economic performance drivers that have an impact on the Market. Understanding the impact of the surrounding environment and the influence of environmental concerns on the Carbon Neutral Market is aided by legal factors.
Carbon Neutral Market Scope:
|
Carbon Neutral Market |
|
|
Market Size in 2025 |
USD 62.28 Bn. |
|
Market Size in 2032 |
USD 94.89 Bn. |
|
CAGR (2026-2032) |
6.2% |
|
Historic Data |
2020-2025 |
|
Base Year |
2025 |
|
Forecast Period |
2026-2032 |
|
Segment Scope |
By Carbon Neutral Fuel
|
|
By Vertical
|
|
|
By Component
|
|
|
Regional Scope |
North America- United States, Canada, and Mexico Europe – UK, France, Germany, Italy, Spain, Sweden, Austria, and Rest of Europe Asia Pacific – China, India, Japan, South Korea, Australia, ASEAN, Rest of APAC Middle East and Africa - South Africa, GCC, Egypt, Nigeria, Rest of the Middle East and Africa South America – Brazil, Argentina, Rest of South America |
Carbon Neutral Market Key Players
- The Carbonneutral Company (US)
- Control Union (Netherlands)
- Carbon Footprint (England)
- Enablon (France)
- SAP (Germany)
- Dakota Software (US)
- ProcessMAP (US)
- IsoMetrix (South Africa)
- IBM (US)
- Schneider Electric (France)
- Salesforce (US)
- ENGIE (France)
- Ambuja Cements (India)
- Nippon Steel (Japan)
- JSW Group (India)
Regional Breakdown:
Europe Carbon Neutral Market: Industry Analysis and Forecast (2024-2030)
Asia Pacific Carbon Neutral Market: Industry Analysis and Forecast (2024-2030)
North America Carbon Neutral Market: Industry Analysis and Forecast (2024-2030)
Frequently Asked Questions
North America is expected to hold the highest share in the Carbon Neutral Market.
The Carbon neutral Company (US), Control Union (Netherlands), Carbon Footprint (England), Enablon (France), and SAP (Germany) are the top key players in the Carbon Neutral Market.
Energy and Utilities vertical segment hold the largest market share in the Carbon Neutral market by 2032.
The market size of the Carbon Neutral market is expected to reach USD 94.89 Bn. by 2032.
The market size of the Carbon Neutral market was worth US $62.28 Bn. in 2025.
1. Research Methodology
1.1 Research Data
1.1.1. Primary Data
1.1.2. Secondary Data
1.2. Market Size Estimation
1.2.1. Bottom-Up Approach
1.2.2. Top-Down Approach
1.3. Market Breakdown and Data Triangulation
1.4. Research Assumption
2. Carbon Neutral Market Executive Summary
2.1. Market Overview
2.2. Market Size (2025) and Forecast (2026– 2032) and Y-O-Y%
2.3. Market Size (USD) and Market Share (%) – By Segments and Regions
3. Carbon Neutral Market: Competitive Landscape
3.1. SMR Competition Matrix
3.2. Key Players Benchmarking
3.2.1. Company Name
3.2.2. Headquarter
3.2.3. Business Segment
3.2.4. End-user Segment
3.2.5. Y-O-Y%
3.2.6. Revenue (2025)
3.2.7. Company Locations
3.3. Market Structure
3.3.1. Market Leaders
3.3.2. Market Followers
3.3.3. Emerging Players
3.4. Consolidation of the Market
3.4.1. Strategic Initiatives
3.4.2. Mergers and Acquisitions
3.4.3. Collaborations and Partnerships
3.4.4. Developments and Innovations
4. Carbon Neutral Market: Dynamics
4.1. Carbon Neutral Market Trends by Region
4.1.1. North America
4.1.2. Europe
4.1.3. Asia Pacific
4.1.4. Middle East and Africa
4.1.5. South America
4.2. Carbon Neutral Market Drivers
4.3. Carbon Neutral Market Restraints
4.4. Carbon Neutral Market Opportunities
4.5. Carbon Neutral Market Challenges
4.6. PORTER’s Five Forces Analysis
4.6.1. Intensity of the Rivalry
4.6.2. Threat of New Entrants
4.6.3. Bargaining Power of Suppliers
4.6.4. Bargaining Power of Buyers
4.6.5. Threat of Substitutes
4.7. PESTLE Analysis
4.7.1. Political Factors
4.7.2. Economic Factors
4.7.3. Social Factors
4.7.4. Technological Factors
4.7.5. Legal Factors
4.7.6. Environmental Factors
4.8. Technological Analysis
4.8.1. Carbon sequestration
4.8.2. Blockchain-based carbon footprint management development
4.8.3. Technological Roadmap
4.9. Regulatory Landscape
4.9.1. Market Regulation by Region
4.9.1.1. North America
4.9.1.2. Europe
4.9.1.3. Asia Pacific
4.9.1.4. Middle East and Africa
4.9.1.5. South America
4.9.2. Impact of Regulations on Market Dynamics
4.9.3. Government Schemes and Initiatives
5. Carbon Neutral Market: Global Market Size and Forecast by Segmentation (by Value in USD Million) (2025-2032)
5.1. Carbon Neutral Market Size and Forecast, by Carbon Neutral Fuel (2025-2032)
5.1.1. Biodiesel
5.1.2. Bio-ethanol
5.1.3. Bio-butanol
5.1.4. Others
5.2. Carbon Neutral Market Size and Forecast, by Vertical (2025-2032)
5.2.1. Manufacturing
5.2.2. Energy and Utilities
5.2.3. Residential and Commercial Buildings
5.2.4. Transportation and Logistics
5.2.5. IT and Telecom
5.2.6. Other
5.3. Carbon Neutral Market Size and Forecast, by Component (2025-2032)
5.3.1. Solutions
5.3.2. Service
5.4. Carbon Neutral Market Size and Forecast, by Region (2025-2032)
5.4.1. North America
5.4.2. Europe
5.4.3. Asia Pacific
5.4.4. Middle East and Africa
5.4.5. South America
6. North America Carbon Neutral Market Size and Forecast by Segmentation (by Value in USD Million) (2025-2032)
6.1. North America Carbon Neutral Market Size and Forecast, by Carbon Neutral Fuel (2025-2032)
6.1.1. Biodiesel
6.1.2. Bio-ethanol
6.1.3. Bio-butanol
6.1.4. Others
6.2. North America Carbon Neutral Market Size and Forecast, by Vertical (2025-2032)
6.2.1. Manufacturing
6.2.2. Energy and Utilities
6.2.3. Residential and Commercial Buildings
6.2.4. Transportation and Logistics
6.2.5. IT and Telecom
6.2.6. Other
6.3. North America Carbon Neutral Market Size and Forecast, by Component (2025-2032)
6.3.1. Solutions
6.3.2. Service
6.4. North America Carbon Neutral Market Size and Forecast, by Country (2025-2032)
6.4.1. United States
6.4.2. Canada
6.4.3. Mexico
7. Europe Carbon Neutral Market Size and Forecast by Segmentation (by Value in USD Million) (2025-2032)
7.1. Europe Carbon Neutral Market Size and Forecast, by Carbon Neutral Fuel (2025-2032)
7.2. Europe Carbon Neutral Market Size and Forecast, by Vertical (2025-2032)
7.3. Europe Carbon Neutral Market Size and Forecast, by Component (2025-2032)
7.4. Europe Carbon Neutral Market Size and Forecast, by Country (2025-2032)
7.4.1. United Kingdom
7.4.2. France
7.4.3. Germany
7.4.4. Italy
7.4.5. Spain
7.4.6. Sweden
7.4.7. Austria
7.4.8. Rest of Europe
8. Asia Pacific Carbon Neutral Market Size and Forecast by Segmentation (by Value in USD Million) (2025-2032)
8.1. Asia Pacific Carbon Neutral Market Size and Forecast, by Carbon Neutral Fuel (2025-2032)
8.2. Asia Pacific Carbon Neutral Market Size and Forecast, by Vertical (2025-2032)
8.3. Asia Pacific Carbon Neutral Market Size and Forecast, by Component (2025-2032)
8.4. Asia Pacific Carbon Neutral Market Size and Forecast, by Country (2025-2032)
8.4.1. China
8.4.2. S Korea
8.4.3. Japan
8.4.4. India
8.4.5. Australia
8.4.6. Indonesia
8.4.7. Malaysia
8.4.8. Vietnam
8.4.9. Taiwan
8.4.10. Rest of Asia Pacific
9. Middle East and Africa Carbon Neutral Market Size and Forecast by Segmentation (by Value in USD Million) (2025-2032)
9.1. Middle East and Africa Carbon Neutral Market Size and Forecast, by Carbon Neutral Fuel (2025-2032)
9.2. Middle East and Africa Carbon Neutral Market Size and Forecast, by Vertical (2025-2032)
9.3. Middle East and Africa Carbon Neutral Market Size and Forecast, by Component (2025-2032)
9.4. Middle East and Africa Carbon Neutral Market Size and Forecast, by Country (2025-2032)
9.4.1. South Africa
9.4.2. GCC
9.4.3. Nigeria
9.4.4. Rest of ME&A
10. South America Carbon Neutral Market Size and Forecast by Segmentation (by Value in USD Million) (2025-2032)
10.1. South America Carbon Neutral Market Size and Forecast, by Carbon Neutral Fuel (2025-2032)
10.2. South America Carbon Neutral Market Size and Forecast, by Vertical (2025-2032)
10.3. South America Carbon Neutral Market Size and Forecast, by Component (2025-2032)
10.4. South America Carbon Neutral Market Size and Forecast, by Country (2025-2032)
10.4.1. Brazil
10.4.2. Argentina
10.4.3. Rest Of South America
11. Company Profile: Key Players
11.1. The Carbonneutral Company (US)
11.1.1. Company Overview
11.1.2. Business Portfolio
11.1.3. Financial Overview
11.1.3.1. Total Revenue
11.1.3.2. Segment Revenue
11.1.3.3. Regional Revenue
11.1.4. SWOT Analysis
11.1.5. Strategic Analysis
11.1.6. Recent Developments
11.2. Control Union (Netherlands)
11.3. Carbon Footprint (England)
11.4. Enablon (France)
11.5. SAP (Germany)
11.6. Dakota Software (US)
11.7. ProcessMAP (US)
11.8. IsoMetrix (South Africa)
11.9. IBM (US)
11.10. Schneider Electric (France)
11.11. Salesforce (US)
11.12. ENGIE (France)
11.13. Ambuja Cements (India)
11.14. Nippon Steel (Japan)
11.15. JSW Group (India)
12. Key Findings
13. Analyst Recommendations
13.1. Strategic Recommendations
13.2. Future Outlook


