Blockchain in Logistics Market Perspective on Upcoming Impacts and Forecast Analysis (2026-2032) by Type, Application, End User Industry, Providers, Offering, and Region.
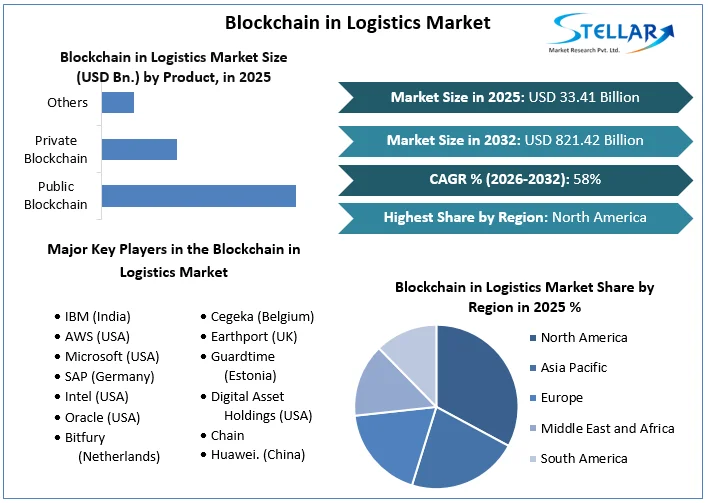
Blockchain in Logistics Market size was valued at US$ 33.41 Billion in 2025 and the total Blockchain in Logistics Market revenue is expected to grow at 58% through 2026 to 2032, reaching nearly US$ 821.42 Billion.
Blockchain in Logistics Market Overview:
The logistics sector is becoming more complicated, with supply chains comprising an increasing number of sites and third parties for goods processing, fulfilment, and shipment. Because management frequently changes between stages, there is a high risk of miscommunication and error, which is one of the reasons why supply chain inefficiencies cost firms millions of dollars each year. According to the World Economic Forum, widespread blockchain implementation could boost global trade by $1 trillion over the next 10 years by removing trade barriers and shortening cumbersome processes. If organisations take advantage of blockchain's possibilities, logistics is destined to be one of the great winners in this fast-changing market.
Blockchain in Logistics Market Dynamics:
One of the key priorities for COVID-19 is product/service tracking and traceability, which has a $962 billion economic potential. According to APQC and Supply Chain Management Review, blockchain software solutions were used the most in logistics (58%), procurement (31%), and supply chain planning (29%) by 2020. The biggest benefit of distributed ledger technology, according to 77% of study respondents, is improved real-time tracking of product movement (QC and Supply Chain Management Review). 69% of firms use blockchain-based technologies to maintain supply chain visibility, which helps them reduce counterfeit items and increase product integrity. Blockchain is used by 62% of businesses to create trust between parties, store sensitive information, and ensure data and process integrity.
To get more Insights: Request Free Sample Report
Many projects are currently in the works to improve supply chain transparency and track provenance using blockchain technology. These projects collect information on how goods are manufactured, where they come from, and how they are handled, which is then recorded in a blockchain-based system. As a result, the data becomes permanent and easily shared, providing supply chain participants with more extensive track-and-trace capabilities than ever before. Companies can utilize this data to give proof of legitimacy for pharmaceutical shipments and proof of authenticity for luxury goods, for example. Consumers benefit from these projects because they can learn more about the things they are buying, such as if a piece was ethically sourced, is an original item, and has been kept in proper conditions.
Achieving excellence in logistics includes running collaboratively with others to optimize the glide of bodily items in addition to the complicated glide of records and economic transactions. But nowadays there may be a considerable quantity of trapped cost in logistics, in large part stemming from the fragmented and aggressive nature of the logistics industry. For example, withinside the US alone, its miles envisioned that there are over 500,000 individual trucking corporations. With any such big number of stakeholders worried withinside the deliver chain, this frequently creates low transparency, unstandardized methods, information silos and numerous tiers of era adoption. Many elements of the logistics cost chain also are sure to guide methods mandated through regulatory authorities. For example, corporations need to many times depend on guide information access and paper-primarily based totally documentation to stick to customs methods. All this makes it hard to song the provenance of products and the reputation of shipments as they pass alongside the deliver chain, inflicting friction in international trade. Blockchain can doubtlessly assist to triumph over those frictions in logistics and recognize vast profits in logistics technique efficiency.
This era also can allow facts transparency and get right of entry to amongst applicable blocckchain stakeholders, growing a unmarried supply of truth. In addition, trust is required among stakeholders to share statistics is more advantageous via way of means of the intrinsic protection mechanisms of blockchain era. Furthermore, blockchain can gain price financial savings via way of means of powering leaner, extra automated, and error-loose processes. As nicely as including visibility and predictability to logistics operations, it may boost up the bodily go with the drift of products. Provenance monitoring of products can allow accountable and sustainable deliver chains at scale and assist to address product counterfeiting. Additionally, blockchain-primarily based totally answers provide capability for brand new logistics offerings and extra progressive commercial enterprise models.
New Technological Developments by Companies in the Blockchain in Logistics Market:
- Maersk and IBM have teamed up to create a global blockchain-based system for digitising trade procedures and end-to-end shipment monitoring in order to boost efficiency in ocean freight. The technology allows each supply chain stakeholder to track the passage of items through the system and determine where a container is in transit. Stakeholders can also access bills of lading and other data, as well as check the status of customs paperwork. The use of blockchain technology guarantees safe data transmission and a tamper-proof store for this content. This technology is expected to track tens of millions of shipping containers each year, according to the two companies. It has the potential to drastically reduce delays and fraud in the logistics business, potentially saving billions of dollars.
- ZIM, an ocean carrier, has performed a pilot to digitise the real bill of lading, which is commonly referred to as the "holy grail" of logistics. The bill of lading is a receipt and a contract for the items being carried, and it is one of the most significant documents in ocean shipping. A bill of lading's information is crucial since it provides all important details such as the shipment's description, amount, and destination, as well as how the products must be handled and paid. ZIM and pilot participants successfully issued, exchanged, and received original electronic documents across the decentralised network during a testing of a blockchain-based system designed by Wave.
- The containers, which were carried from China to Canada, were delivered without incident to the importers (i.e., consignees). Industry acceptance of a digital bill of lading would be important, despite the fact that it is currently in the experimental stage. It has the potential to help supply chains save money by providing error-free documentation and quick transfer of original documents.
- Accenture is working on a blockchain-based solution that would replace traditional bills of lading and provide a single source of truth for all supply chain stakeholders from freight inquiries to trade document issuance. A decentralised network unites all stakeholders in the supply chain and allows direct contact, obviating the need for central bodies and middlemen.
The B2B segment dominates the market:
The B2B (Business-to-Business) sector now dominates the Blockchain in Logistics market and is expected to continue so through 2027. As the number of B2B parcel drops per recipient and special delivery requirements rise, the Blockchain in Logistics market is likely to expand. The expansion of e-commerce and online food stores is driving the B2C sector; in 2020-2027, B2C Blockchain in Logistics is expected to grow by 26% Y-O-Y. Government regulations, gasoline prices, and transportation are the most significant hurdles to the B2C segment's growth, as well as major challenges for industry leaders.
Smart Contracts in Logistics: Automating Commercial Processes:
According to current industry estimates, 10% of all freight invoices contain erroneous data, resulting in disputes and other process inefficiencies in the logistics business. This issue is so widespread that Accenture estimates that improving invoice accuracy and reducing overpayments may save at least 5% of annual freight spend in the oil and energy industry alone. Blockchain has the ability to improve efficiency throughout the whole logistics and settlement process, including trade financing, as well as assist in the resolution of logistical disputes. This information can be utilised to create smart contracts when digitised documents and real-time shipment data become embedded in blockchain-based systems. When certain circumstances are met, these contracts can automate business procedures.
Ship Chain was one of the first companies to seek smart contract applications in the logistics business. ShipChain is a startup that has created a blockchain-based system for tracking and tracing a product from the moment it leaves the manufacturer to final delivery at the customer's doorstep. The system is planned to contain an open API architecture that can interface with existing freight management software, and it will cover all modes of freight. Once the prerequisites are met, all essential supply chain information is stored in an immutable blockchain-based database that can execute smart contracts (for example, as soon as the driver transmits confirmation of successful delivery).
Blockchain in Logistics Market Regional Insights:
North America is expected to have the largest blockchain market in terms of market size. The region's early adoption of blockchain technologies, as well as the advent of various blockchain technology providers, will contribute to the market's overall share. Businesses in North America have recognised the value of blockchain technology in providing better customer experiences, and they have begun to use it to develop business applications. Due to the growth of e-commerce and the COVID-19 epidemic, consumers are placing more orders online, fueling the Blockchain in Logistics sector. This resulted in a 37% rise in volume, with 20 billion parcels delivered in the US, and a 29% increase in revenue, reaching $171 billion in 2020.
Asia Pacific is predicted to have the highest CAGR during the projection period. Furthermore, the APAC region's expansion is powered by the region's rising E commerce penetration and commercial advancements. Apart from that, the region's economic development is being driven by rising living standards and disposable income in India, Japan, China, and ASEAN countries. Furthermore, with major market players building bases in APAC in the hopes of reaping future benefits, the industry is expected to expand at a quick rate. China leads the APAC region with a market share of 50%, because to rising E commerce in the Chinese region and the country's booming industrial sector.
The objective of the report is to present a comprehensive analysis of the Blockchain in Logistics Market to the stakeholders in the industry. The report provides trends that are most dominant in the Blockchain in Logistics Market and how these trends will influence new business investments and market development throughout the forecast period. The report also aids in the comprehension of the Blockchain in Logistics Market dynamics and competitive structure of the market by analyzing market leaders, market followers, and regional players.
The qualitative and quantitative data provided in the Blockchain in Logistics Market report is to help understand which market segments, regions are expected to grow at higher rates, factors affecting the market, and key opportunity areas, which will drive the industry and market growth through the forecast period. The report also includes the competitive landscape of key players in the industry along with their recent developments in the Blockchain in Logistics Market. The report studies factors such as company size, market share, market growth, revenue, production volume, and profits of the key players in the Blockchain in Logistics Market.
The report provides Porter's Five Force Model, which helps in designing the business strategies in the market. The report helps in identifying how many rivals are existing, who they are, and how their product quality is in the Market. The report also analyses if the Blockchain in Logistics Market is easy for a new player to gain a foothold in the market, do they enter or exit the market regularly if the market is dominated by a few players, etc.
The report also includes a PESTEL Analysis, which aids in the development of company strategies. Political variables help in figuring out how much a government can influence the Market. Economic variables aid in the analysis of economic performance drivers that have an impact on the Market. Understanding the impact of the surrounding environment and the influence of environmental concerns on the Blockchain in Logistics Market is aided by legal factors.
Blockchain in Logistics Market Scope:
|
Blockchain in Logistics Market |
|
|
Market Size in 2025 |
USD 33.41 Bn. |
|
Market Size in 2032 |
USD 821.42 Bn. |
|
CAGR (2026-2032) |
58% |
|
Historic Data |
2020-2025 |
|
Base Year |
2025 |
|
Forecast Period |
2026-2032 |
|
Segment Scope |
by Product
|
|
by Application
|
|
|
Regional Scope |
North America- United States, Canada, and Mexico Europe – UK, France, Germany, Italy, Spain, Sweden, Austria, and Rest of Europe Asia Pacific – China, India, Japan, South Korea, Australia, ASEAN, Rest of APAC Middle East and Africa - South Africa, GCC, Egypt, Nigeria, Rest of the Middle East and Africa South America – Brazil, Argentina, Rest of South America |
Blockchain in Logistics Market Players:
Frequently Asked Questions
North America region have the highest growth rate in the Blockchain in Logistics market.
IBM (India), AWS (USA), Microsoft (USA), SAP (Germany), Intel (USA), Oracle (USA), Bitfury (Netherlands), Cegeka (Belgium), Earthport (UK), Guardtime (Estonia), Digital Asset Holdings (USA), Chain, Huawei. (China) and others are the key players in the Blockchain in Logistics market.
Healthcare segment is dominating the market owing to increasing penetration of medication products amid COVID pandemic.
1. Blockchain in Logistics Market: Research Methodology
1.1. Research Data
1.1.1. Secondary Data
1.1.2. Primary Data
1.2. Market Size Estimation
1.2.1. Bottom-Up Approach
1.2.2. Top-Up Approach
1.3. Research Assumption
2. Blockchain in Logistics Market: Executive Summary
2.1. Market Overview
2.2. Market Size (2025) and Forecast (2026 – 2032) and Y-O-Y%
2.3. Market Size (USD) and Market Share (%) – By Segments and Regions
3. Blockchain in Logistics Market: Competitive Landscape
3.1. Stellar Competition Matrix
3.2. Key Players Benchmarking
3.2.1. Company Name
3.2.2. Headquarter
3.2.3. Business Segment
3.2.4. End-user Segment
3.2.5. Y-O-Y%
3.2.6. Revenue (2025)
3.2.7. Profit Magin
3.2.8. Market Share
3.2.9. Company Locations
3.3. Market Structure
3.3.1. Market Leaders
3.3.2. Market Followers
3.3.3. Emerging Players
3.4. Consolidation of the Market
4. Blockchain in Logistics Market: Dynamics
4.1. Market Trends
4.2. Market Driver
4.3. Market Restraints
4.4. Market Opportunities
4.5. Market Challenges
4.6. Technology Roadmap
4.7. PORTER’s Five Forces Analysis
4.8. PESTLE Analysis
4.9. Regulatory Landscape by Region
4.9.1. North America
4.9.2. Europe
4.9.3. Asia Pacific
4.9.4. Middle East and Africa
4.9.5. South America
5. Blockchain in Logistics Market Size and Forecast by Segments (by Value in USD Mn.)
5.1. Blockchain in Logistics Market Size and Forecast, by Product (2025-2032)
5.1.1. Public Blockchain
5.1.2. Private Blockchain
5.1.3. Others
5.2. Blockchain in Logistics Market Size and Forecast, by Application (2025-2032)
5.2.1. Marketing and Advertising
5.2.2. Healthcare
5.2.3. Automotive
5.2.4. Pharmaceuticals
5.2.5. Consumer Goods
5.2.6. Others
5.3. Blockchain in Logistics Market Size and Forecast, by Region (2025-2032)
5.3.1. North America
5.3.2. Europe
5.3.3. Asia Pacific
5.3.4. Middle East and Africa
5.3.5. South America
6. North America Blockchain in Logistics Market Size and Forecast (by Value in USD Mn.)
6.1. North America Blockchain in Logistics Market Size and Forecast, by Product (2025-2032)
6.1.1. Public Blockchain
6.1.2. Private Blockchain
6.1.3. Others
6.2. North America Blockchain in Logistics Market Size and Forecast, by Application (2025-2032)
6.2.1. Marketing and Advertising
6.2.2. Healthcare
6.2.3. Automotive
6.2.4. Pharmaceuticals
6.2.5. Consumer Goods
6.2.6. Others
6.3. North America Blockchain in Logistics Market Size and Forecast, by Country (2025-2032)
6.3.1. United States
6.3.2. Canada
6.3.3. Mexico
7. Europe Blockchain in Logistics Market Size and Forecast (by Value in USD Mn.)
7.1. Europe Blockchain in Logistics Market Size and Forecast, by Product (2025-2032)
7.2. Europe Blockchain in Logistics Market Size and Forecast, by Application (2025-2032)
7.3. Europe Blockchain in Logistics Market Size and Forecast, by Country (2025-2032)
7.3.1. UK
7.3.2. France
7.3.3. Germany
7.3.4. Italy
7.3.5. Spain
7.3.6. Sweden
7.3.7. Austria
7.3.8. Rest of Europe
8. Asia Pacific Blockchain in Logistics Market Size and Forecast (by Value in USD Mn.)
8.1. Asia Pacific Blockchain in Logistics Market Size and Forecast, by Product (2025-2032)
8.2. Asia Pacific Blockchain in Logistics Market Size and Forecast, by Application (2025-2032)
8.3. Asia Pacific Blockchain in Logistics Market Size and Forecast, by Country (2025-2032)
8.3.1. China
8.3.2. S Korea
8.3.3. Japan
8.3.4. India
8.3.5. Australia
8.3.6. Indonesia
8.3.7. Malaysia
8.3.8. Vietnam
8.3.9. Taiwan
8.3.10. Bangladesh
8.3.11. Pakistan
8.3.12. Rest of Asia Pacific
9. Middle East and Africa Blockchain in Logistics Market Size and Forecast (by Value in USD Mn.)
9.1. Middle East and Africa Blockchain in Logistics Market Size and Forecast, by Product (2025-2032)
9.2. Middle East and Africa Blockchain in Logistics Market Size and Forecast, by Application (2025-2032)
9.3. Middle East and Africa Single-Use Filtration Assembly Market Size and Forecast, by Country (2025-2032)
9.3.1. South Africa
9.3.2. GCC
9.3.3. Egypt
9.3.4. Nigeria
9.3.5. Rest of ME&A
10. South America Blockchain in Logistics Market Size and Forecast (by Value in USD Mn.)
10.1. South America Blockchain in Logistics Market Size and Forecast, by Product (2025-2032)
10.2. South America Blockchain in Logistics Market Size and Forecast, by Application (2025-2032)
10.3. South America Blockchain in Logistics Market Size and Forecast, by Country (2025-2032)
10.3.1. Brazil
10.3.2. Argentina
10.3.3. Rest of South America
11. Company Profiles: Key Players
11.1. IBM (India)
11.1.1. Company Overview
11.1.2. Source Portfolio
11.1.3. Financial Overview
11.1.4. Business Strategy
11.1.5. Recent Developments
11.2. AWS (USA)
11.3. Microsoft (USA)
11.4. SAP (Germany)
11.5. Intel (USA)
11.6. Oracle (USA)
11.7. Bitfury (Netherlands)
11.8. Cegeka (Belgium)
11.9. Earthport (UK)
11.10. Guardtime (Estonia)
11.11. Digital Asset Holdings (USA)
11.12. Chain
11.13. Huawei. (China)
12. Key Findings
13. Recommendations