Active Ingredients Market Global Industry Analysis and Forecast (2026-2032) by Application, and Region.
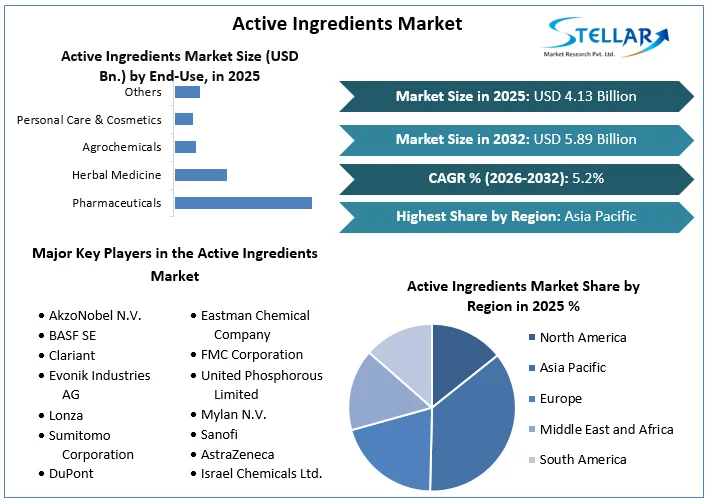
Active Ingredients Market size was valued at US$ 4.13 Billion in 2025 and the Active Ingredients Market revenue is expected to grow at 5.2% through 2026 to 2032, reaching nearly US$ 5.89 Billion.
Active Ingredients Market Overview:
According to the United States Food and Drug Administration (FDA), any component of a drug product that is intended to have pharmacological activity or have another direct influence on the diagnosis, cure, mitigation, treatment, or prevention of disease, or to affect the structure or function of the human or animal body is considered an active ingredient. Active ingredients are those components of a product that may undergo chemical change during manufacturing and then be present in the finished product in a transformed form to provide the desired activity or effect.
To get more Insights: Request Free Sample Report
The component of a drug that is responsible for its effects is known as the active ingredient. Aside from offering a therapeutic benefit, an active ingredient might have unexpected or undesirable effects that can cause minor discomfort or even death.
Active Ingredients Market Dynamics:
Surging demand for skincare products:
The global Active Ingredients Market is driven by rising worries about skin aging and the requirement for an even skin tone, which contributes to an increase in sales and manufacture of various cosmetic goods. Damaged skin is caused by factors such as the sun's rays, pollution, stress, and poor eating habits, which drive the demand for personal care and cosmetics goods. Key factors contributing to the growth of skin care products include a growing desire for health-promoting and self-care products, a growing interest in the power of regimens and routines, and the use of social media to simplify consumers' unusually complex choices when interacting with skincare brands.
This is because of the influence of social media platforms and celebrity brand endorsements, which drive global sales of personal care and cosmetics goods and is another major driver of the global active ingredients market. Following is the list of a few active ingredients used in cosmetics:
Alpha Hydroxy Acid (AHA)
Natural sources of the AHA family of acids include fruit, milk, and sugar. AHAs have a variety of skin advantages, including exfoliating, brightening, smoothing, anti-aging, and acne prevention. However, glycolic acid, which is generated from sugar, and lactic acid, which is derived from milk, are two of the most often used AHAs in skincare.
The former is distinct in that glycolic acid molecules are smaller than those found in other AHAs, allowing them to penetrate deeper into the skin and provide advantages to more layers of the skin. Lactic acid, on the other hand, has the same benefits as other AHAs but is excellent for sensitive skin because it is a non-friction exfoliator that breaks down and dissolves dead skin cells without causing skin irritation.
Hyaluronic Acid
Hyaluronic acid is a potent substance that has received a lot of attention in recent years thanks to its high hydrating and anti-aging qualities. It is an essential component of the skin's structure because it is a naturally produced sugar in the body. However, as aging happens, natural amounts of hyaluronic acid decline, contributing to a loss of skin tone and volume. Topical use, on the other hand, can assist to prevent the apparent symptoms of hyaluronic acid loss.
For example, its ability to retain water and contribute to the regulation of your skin's moisture levels maintains it balanced and hydrated. Second, hyaluronic acid improves the skin's resiliency. These two functions work together to give the skin more volume and fullness, decreasing the appearance of fine lines and wrinkles.
Significant use in the pharmaceutical industry:
The active ingredient used in a pharmaceutical drug is called an active pharmaceutical ingredient (API). The quality of a drug's active components has a direct impact on its safety and efficacy. In many events throughout the years, poorly made and contaminated active substances have been linked to negative health results, including death. As a result, active compounds are now regulated in most nations throughout the world.
Regulating active ingredients in Canada may help to improve the quality and safety of pharmaceuticals for consumers, as well as strengthen Canada's pharmaceutical drug supply system and align the country with its international regulatory partners.
Rules and regulations:
The quality of a drug's active ingredient has a direct impact on its safety and efficacy. Negative health consequences, including deaths, are caused by poorly made and contaminated active substances. As a result, governments all over the world have begun to regulate the production and processing of active ingredients. Pesticides are regulated by the US Environmental Protection Agency under the Federal Insecticide, Fungicide, and Rodenticide Act, for example.
The Food and Drug Regulations, on the other hand, set out the requirements for Establishment Licensing and Good Manufacturing Practices in the manufacturing and importation of active pharmaceutical ingredients. The International Conference on Harmonization (ICH) Q7 Guideline is a quality guideline that controls the manufacturing of active ingredients. It was established by various countries, including the United States, Japan, and the European Union.
Active Ingredients Market Segment Analysis:
Based on End-Use: The pharmaceuticals segment is expected to remain dominant during the forecast period.
The active pharmaceutical ingredient of the Active Ingredients Market, which is the medicinal substance itself, is contained in the dosage form, together with excipients, which are the contents of the tablet, the liquid in which the active agent is suspended, or other pharmaceutically inert material. The active components in drugs are the most important factor in their selection. Excipients are carefully chosen during formulation creation to ensure that the active component reaches the target site in the body at the correct rate and extent.
Patients frequently have trouble identifying the active ingredients in their medications, and many are unaware that such a thing exists. When patients take multiple drugs, the active ingredients can interact, leading to serious or life-threatening problems. The Medicines Database, which provides information on pharmaceuticals available in Australia, is one example of an internet service that can identify the active ingredient in most medications.
Detailed analysis of each segment mentioned in the scope table is covered in the SMR’s report.
Active Ingredients Market Regional Insights:
The rising industrial sector in North America is driving the active ingredients market in the region. The rising frequency of preventable chronic diseases, increased government focus on generic medications, rising demand for biologics and specialty drugs, and technological developments in API manufacturing techniques are all driving the market in North America. According to IQVIA (MIDAS May 2019), the US market accounted for 65.20% of sales of new medications launched between 2013 and 2018, with pharmaceutical R&D spending totaling US $55.75 billion in 2018.
Because of the region's increasing development, Asia-Pacific is the fastest-growing regional market. Emerging economies such as India, South Korea, Thailand, and Malaysia have significant development potential. Thanks to the presence of agricultural countries in the region, the demand for agrochemicals has been steadily growing in the Asia-Pacific active ingredients market.
Because of the region's growing pharmaceutical and personal care and cosmetics industries, active ingredient demand is expected to be high in Europe. Germany, the United Kingdom, France, and Russia are all major contributors to market growth.
The report includes a PORTER, PESTEL analysis as well as the possible influence of microeconomic market determinants. External and internal elements that are expected to have a favorable or negative impact on the firm have been examined, providing decision-makers with a clear future vision of the industry. The research also aids in comprehending the Active Ingredients Market dynamics and structure by studying market segments and forecasting market size. The research is an investor's guide since it depicts the competitive analysis of major competitors in the Active Ingredients Market by product, price, financial situation, product portfolio, growth plans, and geographical presence.
Breakthroughs in the Active Ingredients industry are discussed, as well as organic and inorganic growth plans. Various companies are focusing on organic growth strategies such as new product releases, product approvals, and other items such as patents and events. Inorganic growth strategies used in the industry included acquisitions, partnerships, and collaborations.
Active Ingredients Market Scope
|
Active Ingredients Market |
|
|
Market Size in 2025 |
USD 4.13 Bn. |
|
Market Size in 2032 |
USD 5.89 Bn. |
|
CAGR (2026-2032) |
5.2 % |
|
Historic Data |
2020-2025 |
|
Base Year |
2025 |
|
Forecast Period |
2026-2032 |
|
Segment Scope |
By End-Use
|
|
Regional Scope |
North America- United States, Canada, and Mexico Europe – UK, France, Germany, Italy, Spain, Sweden, Austria, and Rest of Europe Asia Pacific – China, India, Japan, South Korea, Australia, ASEAN, Rest of APAC Middle East and Africa - South Africa, GCC, Egypt, Nigeria, Rest of the Middle East and Africa South America – Brazil, Argentina, Rest of South America |
Active Ingredients Market Players
- AkzoNobel N.V.
- BASF SE
- Clariant
- Evonik Industries AG
- Lonza
- Sumitomo Corporation
- DuPont
- Eastman Chemical Company
- FMC Corporation
- United Phosphorous Limited
- Mylan N.V.
- Sanofi
- AstraZeneca
- Israel Chemicals Ltd.
- Others
Frequently Asked Questions
The United States region has the highest growth rate in the Active Ingredients Market.
AkzoNobel N.V., Ashland, BASF SE, Clariant, Evonik Industries AG, Lonza, Sumitomo Corporation, DuPont, Eastman Chemical Company, FMC Corporation, United Phosphorous Limited, Mylan N.V., Sanofi, AstraZeneca, Israel Chemicals Ltd., and Others.
The North American region held almost 45% of the overall market share.
1. Research Methodology
1.1 Research Data
1.1.1. Primary Data
1.1.2. Secondary Data
1.2. Market Size Estimation
1.2.1. Bottom-Up Approach
1.2.2. Top-Up Approach
1.3. Market Breakdown and Data Triangulation
1.4. Research Assumption
2. Active Ingredients Market Executive Summary
2.1. Market Overview
2.2. Market Size (2025) and Forecast (2026 – 2032) and Y-O-Y%
2.3. Market Size (USD) and Market Share (%) – By Segments and Regions
3. Global Active Ingredients Market: Competitive Landscape
3.1. SMR Competition Matrix
3.2. Key Players Benchmarking
3.2.1. Company Name
3.2.2. Headquarter
3.2.3. Product Segment
3.2.4. End-user Segment
3.2.5. Y-O-Y%
3.2.6. Revenue (2025)
3.2.7. Company Locations
3.3. Market Structure
3.3.1. Market Leaders
3.3.2. Market Followers
3.3.3. Emerging Players
3.4. Consolidation of the Market
3.4.1. Strategic Initiatives and Developments
3.4.2. Mergers and Acquisitions
3.4.3. Collaborations and Partnerships
3.4.4. Product Launches and Innovations
4. Active Ingredients Market: Dynamics
4.1. Active Ingredients Market Trends by Region
4.1.1. North America
4.1.2. Europe
4.1.3. Asia Pacific
4.1.4. Middle East and Africa
4.1.5. South America
4.2. Active Ingredients Market Drivers
4.3. Active Ingredients Market Restraints
4.4. Active Ingredients Market Opportunities
4.5. Active Ingredients Market Challenges
4.6. PORTER’s Five Forces Analysis
4.6.1. Intensity of the Rivalry
4.6.2. Threat of New Entrants
4.6.3. Bargaining Power of Suppliers
4.6.4. Bargaining Power of Buyers
4.6.5. Threat of Substitutes
4.7. PESTLE Analysis
4.7.1. Political Factors
4.7.2. Economic Factors
4.7.3. Social Factors
4.7.4. Legal Factors
4.7.5. Environmental Factors
4.8. Technological Roadmap
4.9. Value Chain Analysis
4.10. Regulatory Landscape by Region
4.10.1. North America
4.10.2. Europe
4.10.3. Asia Pacific
4.10.4. Middle East and Africa
4.10.5. South America
5. Active Ingredients Market: Global Market Size and Forecast by Segmentation (by Value in USD Million) (2025-2032)
5.1. Active Ingredients Market Size and Forecast, by End Use (2025-2032)
5.1.1. Pharmaceuticals
5.1.2. Herbal Medicine
5.1.3. Agrochemicals
5.1.4. Personal Care & Cosmetics
5.1.5. Others
5.2. Active Ingredients Market Size and Forecast, by Region (2025-2032)
5.2.1. North America
5.2.2. Europe
5.2.3. Asia Pacific
5.2.4. Middle East and Africa
5.2.5. South America
6. North America Active Ingredients Market Size and Forecast by Segmentation (by Value in USD Million) (2025-2032)
6.1. North America Active Ingredients Market Size and Forecast, by End Use (2025-2032)
6.1.1. Pharmaceuticals
6.1.2. Herbal Medicine
6.1.3. Agrochemicals
6.1.4. Personal Care & Cosmetics
6.1.5. Others
6.2. North America Active Ingredients Market Size and Forecast, by Country (2025-2032)
6.2.1. United States
6.2.2. Canada
6.2.3. Mexico
7. Europe Active Ingredients Market Size and Forecast by Segmentation (by Value in USD Million) (2025-2032)
7.1. Europe Active Ingredients Market Size and Forecast, by End Use (2025-2032)
7.2. Europe Active Ingredients Market Size and Forecast, by Country (2025-2032)
7.2.1. United Kingdom
7.2.2. France
7.2.3. Germany
7.2.4. Italy
7.2.5. Spain
7.2.6. Sweden
7.2.7. Austria
7.2.8. Rest of Europe
8. Asia Pacific Active Ingredients Market Size and Forecast by Segmentation (by Value in USD Million) (2025-2032)
8.1. Asia Pacific Active Ingredients Market Size and Forecast, by End Use (2025-2032)
8.2. Asia Pacific Active Ingredients Market Size and Forecast, by Country (2025-2032)
8.2.1. China
8.2.2. S Korea
8.2.3. Japan
8.2.4. India
8.2.5. Australia
8.2.6. Indonesia
8.2.7. Malaysia
8.2.8. Vietnam
8.2.9. Taiwan
8.2.10. Rest of Asia Pacific
9. Middle East and Africa Active Ingredients Market Size and Forecast by Segmentation (by Value in USD Million) (2025-2032)
9.1. Middle East and Africa Active Ingredients Market Size and Forecast, by End Use (2025-2032)
9.2. Middle East and Africa Active Ingredients Market Size and Forecast, by Country (2025-2032)
9.2.1. South Africa
9.2.2. GCC
9.2.3. Nigeria
9.2.4. Rest of ME&A
10. South America Active Ingredients Market Size and Forecast by Segmentation (by Value in USD Million) (2025-2032)
10.1. South America Active Ingredients Market Size and Forecast, by End Use (2025-2032)
10.2. South America Active Ingredients Market Size and Forecast, by Country (2025-2032)
10.2.1. Brazil
10.2.2. Argentina
10.2.3. Rest Of South America
11. Company Profile: Key Players
11.1. AkzoNobel N.V.
11.1.1. Company Overview
11.1.2. Business Portfolio
11.1.2.1. Product Name
11.1.2.2. Product Details (Price, Features, etc)
11.1.3. Financial Overview
11.1.3.1. Total Revenue
11.1.3.2. Segment Revenue
11.1.3.3. Regional Revenue
11.1.4. SWOT Analysis
11.1.5. Strategic Analysis
11.1.6. Recent Developments
11.2. BASF SE
11.3. Clariant
11.4. Evonik Industries AG
11.5. Lonza
11.6. Sumitomo Corporation
11.7. DuPont
11.8. Eastman Chemical Company
11.9. FMC Corporation
11.10. United Phosphorous Limited
11.11. Mylan N.V.
11.12. Sanofi
11.13. AstraZeneca
11.14. Israel Chemicals Ltd.
11.15. Others
12. Key Findings
13. Analyst Recommendations
13.1. Strategic Recommendations
13.2. Future Outlook