3D Printing Automotive Market - Key Growth Potential and Forecast Analysis (2026-2032) by Type, Solutions, and Region
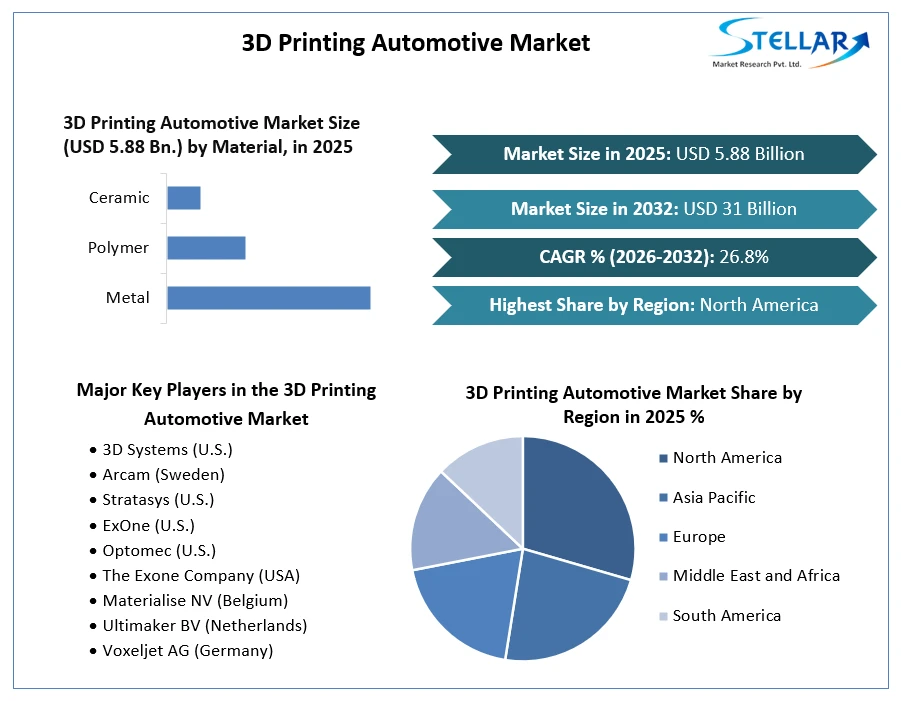
3D Printing Automotive Market size was valued at USD 5.88 Billion in 2025 and the total 3D Printing Automotive Market revenue is expected to grow at 26.8% through 2026 to 2032, reaching nearly USD 31 Billion.
3D Printing Automotive Market Overview:
3D printing, also known as additive manufacturing, is the process of using a printing press to create a 3D object from a digital file. This process applies a continuous layer of material until the entire object is built. 3D printing is used in industries such as automotive, defense, and aerospace. The growing acceptance of 3D printing is due to its many advantages, including innovative design, advanced customization, faster time to market, and the ability to manufacture parts without the use of expensive tools.
Factors driving 3D printing automotive market are innovations in new printing materials for 3D printing, new technology developments, low development costs, and significant patent expirations. However, regulatory hurdles in different countries, lack of material availability and standardization, process control standards, and limited awareness of technology can hinder market growth.
To get more Insights: Request Free Sample Report
3D Printing Automotive Market Dynamics:
Waste Minimization:
Because of its accuracy in producing products, 3D printers have become more popular among professional users. The use of 3D printing in the early stages of production is advantageous since designers can spot flaws or problems in the produced, decreasing production time and costs. Additive manufacturing allows for the integration of complicated designs and the optimization of operating resources. As a result, the 3D printing automotive market is likely to rise at a rapid pace over the forecast period.
The usage of materials is efficient, and no extra material is wasted in unneeded areas. Previously, subtractive techniques were used to produce items, which resulted in a huge quantity of material being lost throughout the manufacturing process. The use of 3D printing for prototyping reduces the time it takes to create a prototype. Manufacturers used to outsource the prototyping process, which resulted in higher costs and a longer turnaround time. With 3D printing, OEMs can now produce a prototype in less than a day and for a quarter of the cost. Because of their flexibility and strength, polymers are the most popular 3D print materials with high demand rate in the 3D printing automotive market.
Metals are projected to become more popular as a 3D print material in the future, as components that must endure high temperatures and pressure may be produced using 3D printers that use metals as a print material. Due to the size constraint, 3DP cannot be used for mass manufacturing, and a 3D printer will not be able to print more than one object at a time.
Rising raw material prices and fluctuations in the global economy have forced the automotive industry to seek cost-effective strategies. Strict government standards require manufacturers to spend an average of $ 400 on emission control components and $ 200 on new safety devices, including investment in new assembly station installations and R & D. Advances in technology and materials used in additive manufacturing are expected to create a new frontier for 3D printing automotive market. Local Motors was one of the first manufacturers to commercialize the use of 3D printing in the automotive sector, producing chassis and body panels with giant 3D printers. Ford Motor Company uses 3D printers to prototype and manufacture vehicle components from resin, quartz powder, sand and even metal.
Peugeot used 3D printing technology to create an interior iCabin for a fractal concept car. Optimization and adoption of laminated modeling technologies such as 3D printing for automakers is unavoidable for effective production. This can be seen from the fact that Mitsubishi purchased the first 3D printer in 2013, which is far behind the equivalent printers. Using this technology for prototyping has proven to be a very cost-effective and time-saving outcome. Ford is a prototype of a 3D printed cylinder head water jacket at a cost of just under $ 2,000, as opposed to traditional template manufacturing for about $ 20,000.
3D Printing Automotive Market Segmentation:
FDM technology is dominating the market in terms of user base:
FDM is one of the most commonly used in the 3D printing automotive market. The flexibility of the process of manufacturing prototypes, concept model parts, and final products helps maintain a large share of the automotive 3D printing market. This computerized method takes input from the processing equipment of the model that needs to be printed and starts the printing process from bottom to top. As a rule, materials such as thermoplastics are used, making it an ultra-lightweight final product. Highly high performance engineering grade thermoplastics can also be used in this process, making it a durable, durable and extremely lightweight product.
Supporting the environmental impact of the process, such as minimizing waste and ignoring carbon dioxide emissions, also supports the industry's massive uptake of the process. Recent advances in FDM technology make this process even more important for automakers as it is compatible with 3D printed components made from materials such as carbon fiber and carbon fiber reinforced plastics.
Polymers are the most often used 3DP material, but metals are expected to expand at the fastest rate from 2026 to 2032, as components that require high temperature and pressure resistance can be created using 3D printers using metals/metal-alloys as 3DP material. Volume sales of 3D printers are expected to expand at a CAGR of 36.03% from 2026 to 2032. The rising demand from the consumer and industrial segments is to blame for this increase. Users ranging from home hobbyists to engineers can use a computer to build or change a product design and then print it out using a 3D printer instead of paper. The 3DP process can be carried out at a service bureau, lowering the barrier to entry and allowing products to be manufactured at or near their final destination. 3DP is quickly gaining popularity since it allows anyone with a computer to design and construct a product without the need for a factory or understanding of complex manufacturing procedures.
3D Printing Automotive Market Regional Insights:
The North America 3D printing automotive market is expected to increase steadily, owing to early acceptance of the technology. The Asia-Pacific and European markets are still in the early phases of 3DP adoption and are expected to develop faster than the North American market. The Asia-Pacific and European lags are due to a lack of understanding of 3DP and an unwillingness to adapt to new technology.
The objective of the report is to present a comprehensive analysis of the 3D Printing Automotive Market to the stakeholders in the industry. The report provides trends that are most dominant in the 3D Printing Automotive Market and how these trends will influence new business investments and market development throughout the forecast period. The report also aids in the comprehension of the market dynamics and competitive structure of the market by analyzing market leaders, market followers, and regional players.
The qualitative and quantitative data provided in the 3D Printing Automotive Market report is to help understand which market segments, regions are expected to grow at higher rates, factors affecting the market, and key opportunity areas, which will drive the industry and market growth through the forecast period. The report also includes the competitive landscape of key players in the industry along with their recent developments in the 3D Printing Automotive Market. The report studies factors such as company size, market share, market growth, revenue, production volume, and profits of the key players in the market.
The report provides Porter's Five Force Model, which helps in designing the business strategies in the market. The report helps in identifying how many rivals are existing, who they are, and how their product quality is in the Market. The report also analyses if the 3D Printing Automotive Market is easy for a new player to gain a foothold in the market, do they enter or exit the market regularly if the market is dominated by a few players, etc.
The report also includes a PESTEL Analysis, which aids in the development of company strategies. Political variables help in figuring out how much a government can influence the Market. Economic variables aid in the analysis of economic performance drivers that have an impact on the Market. Understanding the impact of the surrounding environment and the influence of environmental concerns on the 3D Printing Automotive Market is aided by legal factors.
3D Printing Automotive Market Scope:
|
3D Printing Automotive Market |
|
|
Market Size in 2025 |
USD 5.88 Bn. |
|
Market Size in 2032 |
USD 31 Bn. |
|
CAGR (2026-2032) |
26.8% |
|
Historic Data |
2020-2025 |
|
Base Year |
2025 |
|
Forecast Period |
2026-2032 |
|
Segment Scope |
by Technology Type
|
|
by Material
|
|
|
by Application
|
|
|
Regional Scope |
North America- United States, Canada, and Mexico Europe – UK, France, Germany, Italy, Spain, Sweden, Austria, and Rest of Europe Asia Pacific – China, India, Japan, South Korea, Australia, ASEAN, Rest of APAC Middle East and Africa - South Africa, GCC, Egypt, Nigeria, Rest of the Middle East and Africa South America – Brazil, Argentina, Rest of South America |
3D Printing Automotive Market Players:
- 3D Systems (U.S.)
- Arcam (Sweden)
- Stratasys (U.S.)
- ExOne (U.S.)
- Optomec (U.S.)
- The Exone Company (USA)
- Materialise NV (Belgium)
- Ultimaker BV (Netherlands)
- Voxeljet AG (Germany)
- Höganäs AB (Sweden)
- Envisiontec GmbH (Germany)
- EOS GmbH (Germany)
- Moog Inc. (USA)
Frequently Asked Questions
North America region have the highest growth rate in the 3D Printing Automotive market.
3D Systems (U.S.), Arcam (Sweden), Stratasys (U.S.) , ExOne (U.S.), Optomec (U.S.), The Exone Company (USA), Materialise NV (Belgium), Ultimaker BV (Netherlands), Voxeljet AG (Germany), Höganäs AB (Sweden), Envisiontec GmbH (Germany), EOS GmbH (Germany), Moog Inc. (USA) and others are the key players in the 3D Printing Automotive market.
Polymer segment is dominating the market owing to high customer demand and high rigidity of the material.
Chapter 1 Scope of the Report
Chapter 2 Research Methodology
2.1. Research Process
2.2. Global 3D Printing Automotive Market: Target Audience
2.3. Global 3D Printing Automotive Market: Primary Research (As per Client Requirement)
2.4. Global 3D Printing Automotive Market: Secondary Research
Chapter 3 Executive Summary
Chapter 4 Competitive Landscape
4.1. Market Share Analysis, By Value, 2024-2032
4.1.1. Market Share Analysis, By Region, By Value, 2025-2032 (In %)
4.1.1.1. North America Market Share Analysis, By Value, 2025-2032 (In %)
4.1.1.2. Europe Market Share Analysis, By Value, 2025-2032 (In %)
4.1.1.3. Asia Pacific Market Share Analysis, By Value, 2025-2032 (In %)
4.1.1.4. South America Market Share Analysis, By Value, 2025-2032 (In %)
4.1.1.5. Middle East and Africa Market Share Analysis, By Value, 2025-2032 (In %)
4.1.2. Market Share Analysis, By Technology Type, By Value, 2025-2032 (In %)
4.1.2.1. North America Market Share Analysis, By Technology Type, By Value, 2025-2032 (In %)
4.1.2.1.1. USA Market Share Analysis, By Technology Type, By Value, 2025-2032 (In %)
4.1.2.1.2. Canada Market Share Analysis, By Technology Type, By Value, 2025-2032 (In %)
4.1.2.1.3. Mexico Market Share Analysis, By Technology Type, By Value, 2025-2032 (In %)
4.1.2.2. Europe Market Share Analysis, By Technology Type, By Value, 2025-2032 (In %)
4.1.2.2.1. UK Market Share Analysis, By Technology Type, By Value, 2025-2032 (In %)
4.1.2.2.2. France Market Share Analysis, By Technology Type, By Value, 2025-2032 (In %)
4.1.2.2.3. Germany Market Share Analysis, By Technology Type, By Value, 2025-2032 (In %)
4.1.2.2.4. Italy Market Share Analysis, By Technology Type, By Value, 2025-2032 (In %)
4.1.2.2.5. Spain Market Share Analysis, By Technology Type, By Value, 2025-2032 (In %)
4.1.2.2.6. Sweden Market Share Analysis, By Technology Type, By Value, 2025-2032 (In %)
4.1.2.2.7. Austria Market Share Analysis, By Technology Type, By Value, 2025-2032 (In %)
4.1.2.2.8. Rest of Europe Market Share Analysis, By Technology Type, By Value, 2025-2032 (In %)
4.1.2.3. Asia Pacific Market Share Analysis, By Technology Type, By Value, 2025-2032 (In %)
4.1.2.3.1. China Market Share Analysis, By Technology Type, By Value, 2025-2032 (In %)
4.1.2.3.2. India Market Share Analysis, By Technology Type, By Value, 2025-2032 (In %)
4.1.2.3.3. Japan Market Share Analysis, By Technology Type, By Value, 2025-2032 (In %)
4.1.2.3.4. South Korea Market Share Analysis, By Technology Type, By Value, 2025-2032 (In %)
4.1.2.3.5. Australia Market Share Analysis, By Technology Type, By Value, 2025-2032 (In %)
4.1.2.3.6. ASEAN Market Share Analysis, By Technology Type, By Value, 2025-2032 (In %)
4.1.2.3.7. Rest of APAC Market Share Analysis, By Technology Type, By Value, 2025-2032 (In %)
4.1.2.4. South America Market Share Analysis, By Technology Type, By Value, 2025-2032 (In %)
4.1.2.4.1. Brazil Market Share Analysis, By Technology Type, By Value, 2025-2032 (In %)
4.1.2.4.2. Argentina Market Share Analysis, By Technology Type, By Value, 2025-2032 (In %)
4.1.2.4.3. Rest of South America Market Share Analysis, By Technology Type, By Value, 2025-2032 (In %)
4.1.2.5. Middle East and Africa Market Share Analysis, By Technology Type, By Value, 2025-2032 (In %)
4.1.2.5.1. South Africa Market Share Analysis, By Technology Type, By Value, 2025-2032 (In %)
4.1.2.5.2. GCC Market Share Analysis, By Technology Type, By Value, 2025-2032 (In %)
4.1.2.5.3. Egypt Market Share Analysis, By Technology Type, By Value, 2025-2032 (In %)
4.1.2.5.4. Nigeria Market Share Analysis, By Technology Type, By Value, 2025-2032 (In %)
4.1.2.5.5. Rest of Middle East and Africa Market Share Analysis, By Technology Type, By Value, 2025-2032 (In %)
4.1.3. Market Share Analysis, By Application, By Value, 2025-2032 (In %)
4.1.4. North America Market Share Analysis, By Application, By Value, 2025-2032 (In %)
4.1.4.1.1. USA Market Share Analysis, By Application, By Value, 2025-2032 (In %)
4.1.4.1.2. Canada Market Share Analysis, By Application, By Value, 2025-2032 (In %)
4.1.4.1.3. Mexico Market Share Analysis, By Application, By Value, 2025-2032 (In %)
4.1.4.2. Europe Market Share Analysis, By Application, By Value, 2025-2032 (In %)
4.1.4.2.1. UK Market Share Analysis, By Application, By Value, 2025-2032 (In %)
4.1.4.2.2. France Market Share Analysis, By Application, By Value, 2025-2032 (In %)
4.1.4.2.3. Germany Market Share Analysis, By Application, By Value, 2025-2032 (In %)
4.1.4.2.4. Italy Market Share Analysis, By Application, By Value, 2025-2032 (In %)
4.1.4.2.5. Spain Market Share Analysis, By Application, By Value, 2025-2032 (In %)
4.1.4.2.6. Sweden Market Share Analysis, By Application, By Value, 2025-2032 (In %)
4.1.4.2.7. Austria Market Share Analysis, By Application, By Value, 2025-2032 (In %)
4.1.4.2.8. Rest of Europe Market Share Analysis, By Application, By Value, 2025-2032 (In %)
4.1.4.3. Asia Pacific Market Share Analysis, By Application, By Value, 2025-2032 (In %)
4.1.4.3.1. China Market Share Analysis, By Application, By Value, 2025-2032 (In %)
4.1.4.3.2. India Market Share Analysis, By Application, By Value, 2025-2032 (In %)
4.1.4.3.3. Japan Market Share Analysis, By Application, By Value, 2025-2032 (In %)
4.1.4.3.4. South Korea Market Share Analysis, By Application, By Value, 2025-2032 (In %)
4.1.4.3.5. Australia Market Share Analysis, By Application, By Value, 2025-2032 (In %)
4.1.4.3.6. ASEAN Market Share Analysis, By Application, By Value, 2025-2032 (In %)
4.1.4.3.7. Rest of APAC Market Share Analysis, By Application, By Value, 2025-2032 (In %)
4.1.4.4. South America Market Share Analysis, By Application, By Value, 2025-2032 (In %)
4.1.4.4.1. Brazil Market Share Analysis, By Application, By Value, 2025-2032 (In %)
4.1.4.4.2. Argentina Market Share Analysis, By Application, By Value, 2025-2032 (In %)
4.1.4.4.3. Rest of South America Market Share Analysis, By Application, By Value, 2025-2032 (In %)
4.1.4.5. Middle East and Africa Market Share Analysis, By Application, By Value, 2025-2032 (In %)
4.1.4.5.1. South Africa Market Share Analysis, By Application, By Value, 2025-2032 (In %)
4.1.4.5.2. GCC Market Share Analysis, By Application, By Value, 2025-2032 (In %)
4.1.4.5.3. Egypt Market Share Analysis, By Application, By Value, 2025-2032 (In %)
4.1.4.5.4. Nigeria Market Share Analysis, By Application, By Value, 2025-2032 (In %)
4.1.4.5.5. Rest of Middle East and Africa Market Share Analysis, By Application, By Value, 2025-2032 (In %)
4.1.5. Market Share Analysis, By Material, By Value, 2025-2032 (In %)
4.1.6. North America Market Share Analysis, By Material, By Value, 2025-2032 (In %)
4.1.6.1.1. USA Market Share Analysis, By Material, By Value, 2025-2032 (In %)
4.1.6.1.2. Canada Market Share Analysis, By Material, By Value, 2025-2032 (In %)
4.1.6.1.3. Mexico Market Share Analysis, By Material, By Value, 2025-2032 (In %)
4.1.6.2. Europe Market Share Analysis, By Material, By Value, 2025-2032 (In %)
4.1.6.2.1. UK Market Share Analysis, By Material, By Value, 2025-2032 (In %)
4.1.6.2.2. France Market Share Analysis, By Material, By Value, 2025-2032 (In %)
4.1.6.2.3. Germany Market Share Analysis, By Material, By Value, 2025-2032 (In %)
4.1.6.2.4. Italy Market Share Analysis, By Material, By Value, 2025-2032 (In %)
4.1.6.2.5. Spain Market Share Analysis, By Material, By Value, 2025-2032 (In %)
4.1.6.2.6. Sweden Market Share Analysis, By Material, By Value, 2025-2032 (In %)
4.1.6.2.7. Austria Market Share Analysis, By Material, By Value, 2025-2032 (In %)
4.1.6.2.8. Rest of Europe Market Share Analysis, By Material, By Value, 2025-2032 (In %)
4.1.6.3. Asia Pacific Market Share Analysis, By Material, By Value, 2025-2032 (In %)
4.1.6.3.1. China Market Share Analysis, By Material, By Value, 2025-2032 (In %)
4.1.6.3.2. India Market Share Analysis, By Material, By Value, 2025-2032 (In %)
4.1.6.3.3. Japan Market Share Analysis, By Material, By Value, 2025-2032 (In %)
4.1.6.3.4. South Korea Market Share Analysis, By Material, By Value, 2025-2032 (In %)
4.1.6.3.5. Australia Market Share Analysis, By Material, By Value, 2025-2032 (In %)
4.1.6.3.6. ASEAN Market Share Analysis, By Material, By Value, 2025-2032 (In %)
4.1.6.3.7. Rest of APAC Market Share Analysis, By Material, By Value, 2025-2032 (In %)
4.1.6.4. South America Market Share Analysis, By Material, By Value, 2025-2032 (In %)
4.1.6.4.1. Brazil Market Share Analysis, By Material, By Value, 2025-2032 (In %)
4.1.6.4.2. Argentina Market Share Analysis, By Material, By Value, 2025-2032 (In %)
4.1.6.4.3. Rest of South America Market Share Analysis, By Material, By Value, 2025-2032 (In %)
4.1.6.5. Middle East and Africa Market Share Analysis, By Material, By Value, 2025-2032 (In %)
4.1.6.5.1. South Africa Market Share Analysis, By Material, By Value, 2025-2032 (In %)
4.1.6.5.2. GCC Market Share Analysis, By Material, By Value, 2025-2032 (In %)
4.1.6.5.3. Egypt Market Share Analysis, By Material, By Value, 2025-2032 (In %)
4.1.6.5.4. Nigeria Market Share Analysis, By Material, By Value, 2025-2032 (In %)
4.1.6.5.5. Rest of Middle East and Africa Market Share Analysis, By Material, By Value, 2025-2032 (In %)
4.2. Stellar Competition matrix
4.2.1. Global Stellar Competition Matrix
4.2.2. North America Stellar Competition Matrix
4.2.3. Europe Stellar Competition Matrix
4.2.4. Asia Pacific Stellar Competition Matrix
4.2.5. South America Stellar Competition Matrix
4.2.6. Middle East and Africa Stellar Competition Matrix
4.3. Key Players Benchmarking
4.3.1. Key Players Benchmarking by Product, Pricing, Market Share, Investments, Expansion Plans, Physical Presence and Presence in the Market.
4.4. Mergers and Acquisitions in Industry
4.4.1. M&A by Region, Value and Strategic Intent
4.5. Market Dynamics
4.5.1. Market Drivers
4.5.2. Market Restraints
4.5.3. Market Opportunities
4.5.4. Market Challenges
4.5.5. PESTLE Analysis
4.5.6. PORTERS Five Force Analysis
4.5.7. Value Chain Analysis
Chapter 5 Global 3D Printing Automotive Market Segmentation: By Technology Type
5.1. Global 3D Printing Automotive Market, By Technology Type, Overview/Analysis, 2024-2032
5.2. Global 3D Printing Automotive Market, By Technology Type, By Value, Market Share (%), 2025-2032 (USD Million)
5.3. Global 3D Printing Automotive Market, By Technology Type, By Value,
5.3.1. Selective Laser Sintering (SLS)
5.3.2. Stereo Lithography (SLA)
5.3.3. Digital Light Processing (DLP)
5.3.4. Electronic Beam Melting (EBM)
5.3.5. Selective Laser Melting (SLM)
5.3.6. Fused Deposition Modelling (FDM)
Chapter 6 Global 3D Printing Automotive Market Segmentation: By Application
6.1. Global 3D Printing Automotive Market, By Application, Overview/Analysis, 2024-2032
6.2. Global 3D Printing Automotive Market Size, By Application, By Value, Market Share (%), 2025-2032 (USD Million)
6.3. Global 3D Printing Automotive Market, By Application, By Value,
6.3.1. Prototyping
6.3.2. Research and development
6.3.3. Production
Chapter 7 Global 3D Printing Automotive Market Segmentation: By Material
7.1. Global 3D Printing Automotive Market, By Material, Overview/Analysis, 2024-2032
7.2. Global 3D Printing Automotive Market Size, By Material, By Value, Market Share (%), 2025-2032 (USD Million)
7.3. Global 3D Printing Automotive Market, By Material, By Value, -
7.3.1. Metal
7.3.2. Polymer
7.3.3. Ceramic
Chapter 8 Global 3D Printing Automotive Market Segmentation: By Region
8.1. Global 3D Printing Automotive Market, By Region – North America
8.1.1. North America 3D Printing Automotive Market Size, By Technology Type, By Value, 2025-2032 (USD Million)
8.1.2. North America 3D Printing Automotive Market Size, By Application, By Value, 2025-2032 (USD Million)
8.1.3. North America 3D Printing Automotive Market Size, By Material, By Value, 2025-2032 (USD Million)
8.1.4. By Country – U.S.
8.1.4.1. U.S. 3D Printing Automotive Market Size, By Technology Type, By Value, 2025-2032 (USD Million)
8.1.4.2. U.S. 3D Printing Automotive Market Size, By Application, By Value, 2025-2032 (USD Million)
8.1.4.3. U.S. 3D Printing Automotive Market Size, By Material, By Value, 2025-2032 (USD Million)
8.1.4.4. Canada 3D Printing Automotive Market Size, By Value, 2025-2032 (USD Million)
8.1.4.5. Mexico 3D Printing Automotive Market Size, By Value, 2025-2032 (USD Million)
8.2. Europe 3D Printing Automotive Market Size, By Value, 2025-2032 (USD Million)
8.2.1. UK
8.2.2. France
8.2.3. Germany
8.2.4. Italy
8.2.5. Spain
8.2.6. Sweden
8.2.7. Austria
8.2.8. Rest of Europe
8.3. Asia Pacific 3D Printing Automotive Market Size, By Value, 2025-2032 (USD Million)
8.3.1. China
8.3.2. India
8.3.3. Japan
8.3.4. South Korea
8.3.5. Australia
8.3.6. ASEAN
8.3.7. Rest of APAC
8.4. Middle East and Africa 3D Printing Automotive Market Size, By Value, 2025-2032 (USD Million)
8.4.1. South Africa
8.4.2. GCC
8.4.3. Egypt
8.4.4. Nigeria
8.4.5. Rest of Middle East and Africa
8.5. South America 3D Printing Automotive Market Size, By Value, 2025-2032 (USD Million)
8.5.1. Brazil
8.5.2. Argentina
8.5.3. Rest of South America
Chapter 9 Company Profiles
9.1. Key Players
9.1.1. 3D Systems (U.S.)
9.1.1.1. Company Overview
9.1.1.2. Technology Type Portfolio
9.1.1.3. Financial Overview
9.1.1.4. Business Strategy
9.1.1.5. Key Developments
9.1.2. Arcam (Sweden)
9.1.3. Stratasys (U.S.)
9.1.4. ExOne (U.S.)
9.1.5. Optomec (U.S.)
9.1.6. The Exone Company (USA)
9.1.7. Materialise NV (Belgium)
9.1.8. Ultimaker BV (Netherlands)
9.1.9. Voxeljet AG (Germany)
9.1.10 Höganäs AB (Sweden)
9.1.11 Envisiontec GmbH (Germany)
9.1.12 EOS GmbH (Germany)
9.1.13 Moog Inc. (USA)
9.2. Key Findings
9.3. Recommendations