Co-Packaged Optics Market Size, Share, Growth Trends, Industry Analysis, Key Players, Investment Opportunities, and Forecast 2026-2034
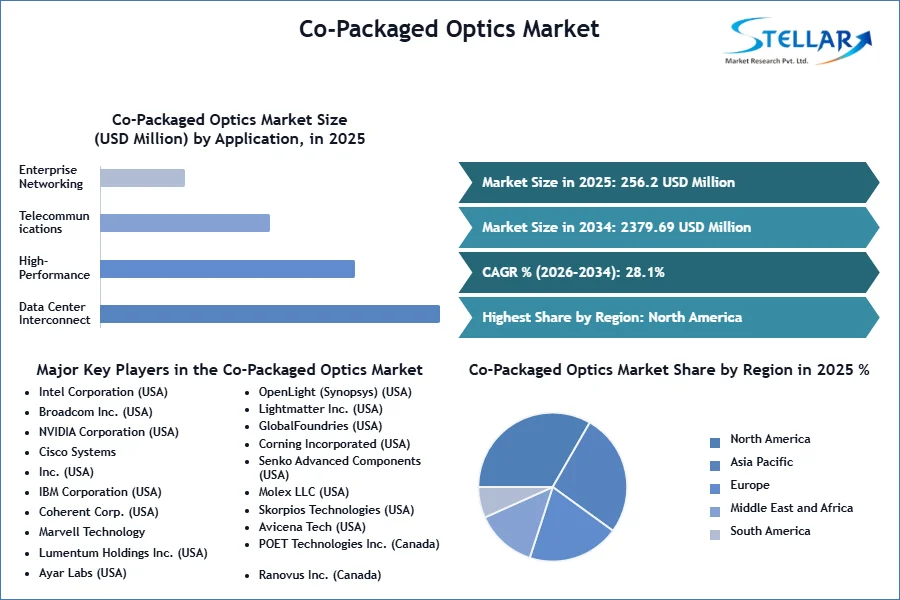
Co-Packaged Optics Market is projected to grow at a CAGR of 28.1% through 2034. It was valued at USD 256.2 Mn in 2025 and is expected to become USD 2379.69 Mn by 2034.
Co-Packaged Optics Market Overview
Co-packaged optics is a game-changing innovation where optical components like lasers, signal modulators, and light detectors get built right into the same package as processing chips like CPUs, GPUs, or specialized networking processors. This tight integration does away with separate optical modules, allowing data to move faster while using less power and packing more bandwidth into smaller spaces than conventional designs where optics sit apart from chips. The Co-Packaged Optics Market hits breakthrough milestones in 2025, with NVIDIA co-packaged optics being brought into its GB200 AI superchips in order to cut power consumption by 30%. The Co-Packaged Optics Alliance accelerated adoption through the publication of its first interoperability standards within Q1 and TSMC mass-producing 3nm CPO solutions for future AI accelerator generations.
Intel and Broadcom additionally announced photonics-enhanced data center chips aiming at 1.6T networks. These developments meet growing demand for energy-efficient AI hardware, although issues such as thermal management at 3nm remain. Standardization and mass production now make CPO the backbone of AI-era data centers. Several major trends are driving CPO adoption, The explosive growth in AI systems and the industry-wide shift to ultra-fast 800G and 1.6T networks are turbocharging Co-Packaged Optics Market expansion. But the companies still face hurdles like tricky integration processes, high initial production costs, and the ongoing need for industrial standards. The sustainability angle is particularly compelling, with CPO's potential to reduce data center power usage by 30-50% aligning perfectly with global green computing initiatives.
According to SMR CPO technology has a promising future, with the market at the crossroads of a number of megatrends such as AI proliferation, green computing, and next-generation networking. Some fascinating trends are emerging in North America due to its dense network of cloud giants and tech innovators. Asia-Pacific Co-Packaged Optics Market are demonstrating high growth potential as regional cloud players and 5G deployments grow. The Co-Packaged Optics industry is witnessing interesting segmentation, with silicon photonics solutions dominating existing implementations but emerging techniques such as plasmonic catching on for niche applications. Industry analysts driven growth ahead particularly for AI Optimized CPO systems and green data center solutions.
To get more Insights: Request Free Sample Report
Co-Packaged Optics Market Dynamics
High Speed Data Transmission to Drive Market Growth
The Co-Packaged Optics Market is growing rapidly, increasing demand for high-speed data transmission driven by AI and machine learning to cloud services and massive data centers. CPO, which integrates optics into ASICs or switch chips, decreases power consumption, latency, and improves bandwidth efficiency, becoming essential for future 800G and 1.6T networks. Growing progress in silicon photonics and 3D chip integration, spearheaded by firms such as Intel, Broadcom, and Cisco, are driving CPO innovation.
Production and Supply Chain to Create Challenges
Large-scale deployment faces challenges due to complex manufacturing processes, costly production, and limited production capacity for advanced photonics. To overcome this, industry stakeholders are entering into collaborations to improve the efficiency of production and lower costs. Organizations like the CPO Alliance and OIF aim to create compatibility and scalability across the ecosystem. Additionally, CPO's ability to slash power usage by 30-50% facilitates green technology objectives with increasing uptake in environmentally friendly data centers. CPO is moving into AI clusters, edge computing, and 5G networks, where its ultra-low latency advantage plays to the strengths of critical applications such as autonomous vehicles, quantum computing, and real-time analytics, with startups and technology titans alike racing to supply small, high-performance modules for emerging applications.
Co-Packaged Optics Market Segmentation:
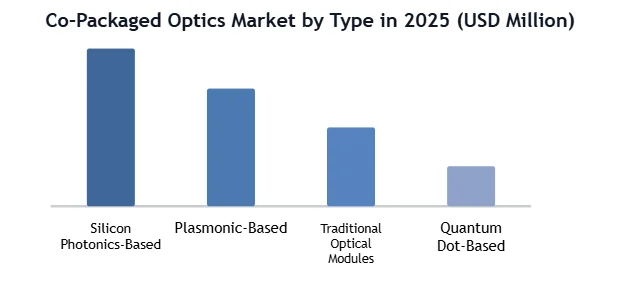
Based on Integration Type, the Co-Packaged Optics Industry is segmented into silicon photonics-based, Plasmonic-based, conventional optical modules, and Quantum Dot-Based serving various data transmission requirements of high-performance computing systems. Silicon photonics solutions are leading the market with more than 55% market share owing to their better integration capacity with CMOS technology and cost-effectiveness in large volumes. The segment will grow as hyperscale data centers re-equip their infrastructure. Plasmonic-based co-packaging is seeing rapid growth in specialized uses that demand ultra-miniaturization. Legacy optical modules are still present in legacy networks, but their market share keeps shrinking by around 3% every year as the Co-Packaged Optics Market moves towards integrated solutions. New quantum dot-based co-packaged optics are coming into pilot production stages and may shake up the Co-Packaged Optics Market in the next ten years.
Based on Data Rate, the 400G-800G space accounts for the largest share of revenues as large cloud vendors finish equipping their infrastructures, and deployment volumes jump 25% year-to-year. 1.6T+ segment is seeing explosive growth as AI clusters and next-generation switches reach production. The 100G-200G segment has consistent demand for enterprise use cases and 5G backhaul, while sub-100G solutions are being quickly replaced except in cost-constrained edge deployments, fueled by growing demands for AI/ML workloads and memory bandwidth in data centers.
Based on Application, Data center deployment shows the highest Co-Packaged Optics Market volume, with hyperscale’s making large investments in optical I/O solutions to bypass copper constraints in future architectures. High-performance computing applications are expanding at the highest rate as exascale systems and AI accelerators require unprecedented photonic integration. The telecommunications market is evolving toward co-packaged solutions for 5G advanced and future 6G fronthaul/backhaul needs. Enterprise networking is the smallest market today, but it has decent growth prospects as distributed computing architectures become widespread. The military/aerospace market is also becoming a high-margin niche market, where custom radiation-hardened co-packaged optics are increasingly being used in satellite communications and avionics systems.
Co-Packaged Optics Market Regional Analysis:
North America Emerges as a Key Player in the Global Co-Packaged Optics Market
North America is currently leading the co-packaged optics market driven by growth in data center technologies, high-speed networking requirements, and rising investments in cloud computing infrastructure. North America benefits from rapid digital transformation, increase of 5G networks, and rising demand for energy-efficient optical solutions in hyperscale data centers. The U.S. leads the local market with around 70% of the demand driven by top technology giants like Google, Amazon, and Microsoft, which are heavily investing in next-generation data center infrastructure. Meanwhile, Canada is experiencing stable growth with growing telecom and enterprise IT infrastructure spending.
The U.S. imported more than $1.2 billion of optical components in 2025, up by 22% compared to the preceding year, marking the region's dependence on high-performance co-packaged optics for supporting skyrocketing bandwidth needs. Moreover, the region’s robust semiconductor and photonics fabrication base allows innovation in optical interconnects, with major players heavily investing in R&D. Government policies for next-generation networking infrastructure, including the U.S. CHIPS and Science Act, are further increasing the Co-Packaged Optics Market growth. With growing demand for AI-based cloud services and edge computing, North America is expected to continue leading the co-packaged optics market, driving worldwide trends in high-speed data communications and optical networking solutions.
Co-Packaged Optics Market Competitive Landscape:
Two dominant leaders shaping innovation in the Co-Packaged Optics industry are Intel and Broadcom, both with unique strengths that drive the future of high-speed, low-energy data connectivity. Intel has solidified its position in the Co-Packaged Optics Market by virtue of its leading silicon photonics platform, expressly designed to address the exponential data requirements of cloud computing and AI workloads. With years of research, extensive vertical integration, and close alignment with hyperscale cloud providers, Intel solutions are leading the way in integration, cost-effectiveness, and power savings. Its CPO strategies are designed to decrease energy per bit while increasing bandwidth, making it a pioneer in next-generation data center architecture.

However, Broadcom holds a dominant position in high-performance networking through its Tomahawk switch ASICs, which are extensively used in next-gen data centers. By strategically partnering with TSMC on 3nm node designs, Broadcom is pushing CPO implementation at scale, prioritizing ultra-low latency and interoperability. This makes Broadcom the vendor of choice for top-of-rack switching solutions that require speed and manufacturability.
|
Co-Packaged Optics Market Scope |
|
|
Market Size in 2025 |
USD 256.2 Mn |
|
Market Size in 2034 |
USD 2379.69 Mn |
|
CAGR (2026-2034) |
28.1% |
|
Historic Data |
2020-2025 |
|
Base Year |
2025 |
|
Forecast Period |
2026-2034 |
|
Segments |
By Integration Type Silicon Photonics-Based Plasmonic-Based Traditional Optical Modules Quantum Dot-Based |
|
By Data Rate 400G-800G 1.6T+ 100G-200G Sub-100G 800G-1.6T |
|
|
By Application Data Center Interconnects High-Performance Computing Telecommunications Enterprise Networking Others |
|
|
Regional Scope |
North America- United States, Canada, and Mexico Europe – UK, France, Germany, Italy, Spain, Sweden, Russia, and Rest of Europe Asia Pacific – China, South Korea, Japan, India, Australia, Indonesia, Philippines, Malaysia, Vietnam, Thailand, Rest of APAC Middle East and Africa - South Africa, GCC, Egypt, Nigeria, Rest of the Middle East and Africa South America – Brazil, Argentina, Rest of South America |
Key Players in the Co-Packaged Optics Market:
- Intel Corporation (USA)
- Broadcom Inc. (USA)
- NVIDIA Corporation (USA)
- Cisco Systems, Inc. (USA)
- IBM Corporation (USA)
- Coherent Corp. (USA)
- Marvell Technology, Inc. (USA)
- Lumentum Holdings Inc. (USA)
- Ayar Labs (USA)
- OpenLight (Synopsys) (USA)
- Lightmatter Inc. (USA)
- GlobalFoundries (USA)
- Corning Incorporated (USA)
- Senko Advanced Components (USA)
- Molex LLC (USA)
- Skorpios Technologies (USA)
- Avicena Tech (USA)
- POET Technologies Inc. (Canada)
- Ranovus Inc. (Canada)
- Xanadu Quantum Technologies (Canada)
- TE Connectivity Ltd. (Switzerland)
- NXP Semiconductors (Netherlands)
- EFFECT Photonics (Netherlands)
- TSMC (Taiwan)
- Samsung Electronics (South Korea)
- Furukawa Electric Co., Ltd. (Japan)
- Sumitomo Electric Industries (Japan)
- Hirose Electric Co., Ltd. (Japan)
- SiFotonics Technologies (China
- Teramount Ltd. (Israel)
Frequently Asked Questions
Growing Demand for High-Speed Data Transmission and Progress in Silicon Photonics & Chip Integration drive the Co-Packaged Optics Market.
North America is leading the Co-Packaged Optics Market with increasing demand.
According to SMR, Co-Packaged Optics Market is growing at a CAGR of 28.1%.
Data Center Interconnects, High-Performance Computing, Telecommunications, Enterprise Networking and others are the applications of Co- Packaged Optics.
1. Co-Packaged Optics Market Introduction
1.1. Study Assumption and Market Definition
1.2. Scope of the Study
1.3. Executive Summary
2. Global Co-Packaged Optics Market: Competitive Landscape
2.1. Ecosystem Analysis
2.2. SMR Competition Matrix
2.3. Competitive Landscape
2.4. Key Players Benchmarking
2.4.1. Company Name
2.4.2. Business Segment
2.4.3. End-user Segment
2.4.4. Revenue (2025)
2.4.5. Company Locations
2.5. Market Structure
2.5.1. Market Leaders
2.5.2. Market Followers
2.5.3. Emerging Players
2.6. Mergers and Acquisitions Details
3. Co-Packaged Optics Market: Dynamics
3.1. Co-Packaged Optics Market Trends by Region
3.1.1. North America Co-Packaged Optics Market Trends
3.1.2. Europe Co-Packaged Optics Market Trends
3.1.3. Asia Pacific Co-Packaged Optics Market Trends
3.1.4. Middle East and Africa Co-Packaged Optics Market Trends
3.1.5. South America Co-Packaged Optics Market Trends
3.2. Co-Packaged Optics Market Dynamics
3.2.1. Co-Packaged Optics Market Drivers
3.2.2. Co-Packaged Optics Market Restraints
3.2.3. Co-Packaged Optics Market Opportunities
3.2.4. Co-Packaged Optics Market Challenges
3.3. PORTER’s Five Forces Analysis
3.4. PESTLE Analysis
3.5. Regulatory Landscape by Region
3.5.1. North America
3.5.2. Europe
3.5.3. Asia Pacific
3.5.4. Middle East and Africa
3.5.5. South America
3.6. Key Opinion Leader Analysis for Co-Packaged Optics Industry
4. Co-Packaged Optics Market: Global Market Size and Forecast by Segmentation (by Value in USD Million) (2026-2034)
4.1. Co-Packaged Optics Market Size and Forecast, By Integration Type (2026-2034)
4.1.1. Silicon Photonics-Based
4.1.2. Plasmonic-Based
4.1.3. Traditional Optical Modules
4.1.4. Quantum Dot-Based
4.2. Co-Packaged Optics Market Size and Forecast, By Data Rate (2026-2034)
4.2.1. 400G-800G
4.2.2. 1.6T+
4.2.3. 100G-200G
4.2.4. Sub-100G
4.2.5. 800G-1.6T
4.3. Co-Packaged Optics Market Size and Forecast, By Application (2026-2034)
4.3.1. Data Center Interconnects
4.3.2. High-Performance Computing
4.3.3. Telecommunications
4.3.4. Enterprise Networking
4.3.5. Others
4.4. Co-Packaged Optics Market Size and Forecast, By Region (2026-2034)
4.4.1. North America
4.4.2. Europe
4.4.3. Asia Pacific
4.4.4. Middle East and Africa
4.4.5. South America
5. North America Co-Packaged Optics Market Size and Forecast by Segmentation (by Value in USD Million) (2026-2034)
5.1. North America Co-Packaged Optics Market Size and Forecast, By Integration Type (2026-2034)
5.1.1. Silicon Photonics-Based
5.1.2. Plasmonic-Based
5.1.3. Traditional Optical Modules
5.1.4. Quantum Dot-Based
5.2. North America Co-Packaged Optics Market Size and Forecast, By Data Rate (2026-2034)
5.2.1. 400G-800G
5.2.2. 1.6T+
5.2.3. 100G-200G
5.2.4. Sub-100G
5.2.5. 800G-1.6T
5.3. North America Co-Packaged Optics Market Size and Forecast, By Application (2026-2034)
5.3.1. Data Center Interconnects
5.3.2. High-Performance Computing
5.3.3. Telecommunications
5.3.4. Enterprise Networking
5.3.5. Others
5.4. North America Co-Packaged Optics Market Size and Forecast, by Country (2026-2034)
5.4.1. United States
5.4.1.1. United States Co-Packaged Optics Market Size and Forecast, By Integration Type (2026-2034)
5.4.1.1.1. Silicon Photonics-Based
5.4.1.1.2. Plasmonic-Based
5.4.1.1.3. Traditional Optical Modules
5.4.1.1.4. Quantum Dot-Based
5.4.1.2. United States Co-Packaged Optics Market Size and Forecast, By Data Rate (2026-2034)
5.4.1.2.1. 400G-800G
5.4.1.2.2. 1.6T+
5.4.1.2.3. 100G-200G
5.4.1.2.4. Sub-100G
5.4.1.2.5. 800G-1.6T
5.4.1.3. United States Co-Packaged Optics Market Size and Forecast, By Application (2026-2034)
5.4.1.3.1. Data Center Interconnects
5.4.1.3.2. High-Performance Computing
5.4.1.3.3. Telecommunications
5.4.1.3.4. Enterprise Networking
5.4.1.3.5. Others
5.4.2. Canada
5.4.2.1. Canada Co-Packaged Optics Market Size and Forecast, By Integration Type (2026-2034)
5.4.2.1.1. Silicon Photonics-Based
5.4.2.1.2. Plasmonic-Based
5.4.2.1.3. Traditional Optical Modules
5.4.2.1.4. Quantum Dot-Based
5.4.2.2. Canada Co-Packaged Optics Market Size and Forecast, By Data Rate (2026-2034)
5.4.2.2.1. 400G-800G
5.4.2.2.2. 1.6T+
5.4.2.2.3. 100G-200G
5.4.2.2.4. Sub-100G
5.4.2.2.5. 800G-1.6T
5.4.3. Canada Co-Packaged Optics Market Size and Forecast, By Application Industry (2026-2034)
5.4.3.1.1. Data Center Interconnects
5.4.3.1.2. High-Performance Computing
5.4.3.1.3. Telecommunications
5.4.3.1.4. Enterprise Networking
5.4.3.1.5. Others
5.4.4. Mexico
5.4.4.1. Mexico Co-Packaged Optics Market Size and Forecast, By Integration Type (2026-2034)
5.4.4.1.1. Silicon Photonics-Based
5.4.4.1.2. Plasmonic-Based
5.4.4.1.3. Traditional Optical Modules
5.4.4.1.4. Quantum Dot-Based
5.4.4.2. Mexico Co-Packaged Optics Market Size and Forecast, By Data Rate (2026-2034)
5.4.4.2.1. 400G-800G
5.4.4.2.2. 1.6T+
5.4.4.2.3. 100G-200G
5.4.4.2.4. Sub-100G
5.4.4.2.5. 800G-1.6T
5.4.4.3. Mexico Co-Packaged Optics Market Size and Forecast, By Application (2026-2034)
5.4.4.3.1. Data Center Interconnects
5.4.4.3.2. High-Performance Computing
5.4.4.3.3. Telecommunications
5.4.4.3.4. Enterprise Networking
5.4.4.3.5. Others
6. Europe Co-Packaged Optics Market Size and Forecast by Segmentation (by Value in USD Million) (2026-2034)
6.1. Europe Co-Packaged Optics Market Size and Forecast, By Integration Type (2026-2034)
6.2. Europe Co-Packaged Optics Market Size and Forecast, By Data Rate (2026-2034)
6.3. Europe Co-Packaged Optics Market Size and Forecast, By Application (2026-2034)
6.4. Europe Co-Packaged Optics Market Size and Forecast, by Country (2026-2034)
6.4.1. United Kingdom
6.4.1.1. United Kingdom Co-Packaged Optics Market Size and Forecast, By Integration Type (2026-2034)
6.4.1.2. United Kingdom Co-Packaged Optics Market Size and Forecast, By Data Rate (2026-2034)
6.4.1.3. United Kingdom Co-Packaged Optics Market Size and Forecast, By Application (2026-2034)
6.4.2. France
6.4.2.1. France Co-Packaged Optics Market Size and Forecast, By Integration Type (2026-2034)
6.4.2.2. France Co-Packaged Optics Market Size and Forecast, By Data Rate (2026-2034)
6.4.2.3. France Co-Packaged Optics Market Size and Forecast, By Application (2026-2034)
6.4.3. Germany
6.4.3.1. Germany Co-Packaged Optics Market Size and Forecast, By Integration Type (2026-2034)
6.4.3.2. Germany Co-Packaged Optics Market Size and Forecast, By Data Rate (2026-2034)
6.4.3.3. Germany Co-Packaged Optics Market Size and Forecast, By Application (2026-2034)
6.4.4. Italy
6.4.4.1. Italy Co-Packaged Optics Market Size and Forecast, By Integration Type (2026-2034)
6.4.4.2. Italy Co-Packaged Optics Market Size and Forecast, By Data Rate (2026-2034)
6.4.4.3. Italy Co-Packaged Optics Market Size and Forecast, By Application (2026-2034)
6.4.5. Spain
6.4.5.1. Spain Co-Packaged Optics Market Size and Forecast, By Integration Type (2026-2034)
6.4.5.2. Spain Co-Packaged Optics Market Size and Forecast, By Data Rate (2026-2034)
6.4.5.3. Spain Co-Packaged Optics Market Size and Forecast, By Application (2026-2034)
6.4.6. Sweden
6.4.6.1. Sweden Co-Packaged Optics Market Size and Forecast, By Integration Type (2026-2034)
6.4.6.2. Sweden Co-Packaged Optics Market Size and Forecast, By Data Rate (2026-2034)
6.4.6.3. Sweden Co-Packaged Optics Market Size and Forecast, By Application (2026-2034)
6.4.7. Austria
6.4.7.1. Austria Co-Packaged Optics Market Size and Forecast, By Integration Type (2026-2034)
6.4.7.2. Austria Co-Packaged Optics Market Size and Forecast, By Data Rate (2026-2034)
6.4.7.3. Austria Co-Packaged Optics Market Size and Forecast, By Application (2026-2034)
6.4.8. Rest of Europe
6.4.8.1. Rest of Europe Co-Packaged Optics Market Size and Forecast, By Integration Type (2026-2034)
6.4.8.2. Rest of Europe Co-Packaged Optics Market Size and Forecast, By Data Rate (2026-2034)
6.4.8.3. Rest of Europe Co-Packaged Optics Market Size and Forecast, By Application (2026-2034)
7. Asia Pacific Co-Packaged Optics Market Size and Forecast by Segmentation (by Value in USD Million) (2026-2034)
7.1. Asia Pacific Co-Packaged Optics Market Size and Forecast, By Integration Type (2026-2034)
7.2. Asia Pacific Co-Packaged Optics Market Size and Forecast, By Data Rate (2026-2034)
7.3. Asia Pacific Co-Packaged Optics Market Size and Forecast, By Application (2026-2034)
7.4. Asia Pacific Co-Packaged Optics Market Size and Forecast, by Country (2026-2034)
7.4.1. China
7.4.1.1. China Co-Packaged Optics Market Size and Forecast, By Integration Type (2026-2034)
7.4.1.2. China Co-Packaged Optics Market Size and Forecast, By Data Rate (2026-2034)
7.4.1.3. China Co-Packaged Optics Market Size and Forecast, By Application (2026-2034)
7.4.2. S Korea
7.4.2.1. S Korea Co-Packaged Optics Market Size and Forecast, By Integration Type (2026-2034)
7.4.2.2. S Korea Co-Packaged Optics Market Size and Forecast, By Data Rate (2026-2034)
7.4.2.3. S Korea Co-Packaged Optics Market Size and Forecast, By Application (2026-2034)
7.4.3. Japan
7.4.3.1. Japan Co-Packaged Optics Market Size and Forecast, By Integration Type (2026-2034)
7.4.3.2. Japan Co-Packaged Optics Market Size and Forecast, By Data Rate (2026-2034)
7.4.3.3. Japan Co-Packaged Optics Market Size and Forecast, By Application (2026-2034)
7.4.4. India
7.4.4.1. India Co-Packaged Optics Market Size and Forecast, By Integration Type (2026-2034)
7.4.4.2. India Co-Packaged Optics Market Size and Forecast, By Data Rate (2026-2034)
7.4.4.3. India Co-Packaged Optics Market Size and Forecast, By Application (2026-2034)
7.4.5. Australia
7.4.5.1. Australia Co-Packaged Optics Market Size and Forecast, By Integration Type (2026-2034)
7.4.5.2. Australia Co-Packaged Optics Market Size and Forecast, By Data Rate (2026-2034)
7.4.5.3. Australia Co-Packaged Optics Market Size and Forecast, By Application (2026-2034)
7.4.6. Indonesia
7.4.6.1. Indonesia Co-Packaged Optics Market Size and Forecast, By Integration Type (2026-2034)
7.4.6.2. Indonesia Co-Packaged Optics Market Size and Forecast, By Data Rate (2026-2034)
7.4.6.3. Indonesia Co-Packaged Optics Market Size and Forecast, By Application (2026-2034)
7.4.7. Philippines
7.4.7.1. Philippines Co-Packaged Optics Market Size and Forecast, By Integration Type (2026-2034)
7.4.7.2. Philippines Co-Packaged Optics Market Size and Forecast, By Data Rate (2026-2034)
7.4.7.3. Philippines Co-Packaged Optics Market Size and Forecast, By Application (2026-2034)
7.4.8. Malaysia
7.4.8.1. Malaysia Co-Packaged Optics Market Size and Forecast, By Integration Type (2026-2034)
7.4.8.2. Malaysia Co-Packaged Optics Market Size and Forecast, By Data Rate (2026-2034)
7.4.8.3. Malaysia Co-Packaged Optics Market Size and Forecast, By Application (2026-2034)
7.4.9. Vietnam
7.4.9.1. Vietnam Co-Packaged Optics Market Size and Forecast, By Integration Type (2026-2034)
7.4.9.2. Vietnam Co-Packaged Optics Market Size and Forecast, By Data Rate (2026-2034)
7.4.9.3. Vietnam Co-Packaged Optics Market Size and Forecast, By Application (2026-2034)
7.4.10. Thailand
7.4.10.1. Thailand Co-Packaged Optics Market Size and Forecast, By Integration Type (2026-2034)
7.4.10.2. Thailand Co-Packaged Optics Market Size and Forecast, By Data Rate (2026-2034)
7.4.10.3. Thailand Co-Packaged Optics Market Size and Forecast, By Application (2026-2034)
7.4.11. Rest of Asia Pacific
7.4.11.1. Rest of Asia Pacific Co-Packaged Optics Market Size and Forecast, By Integration Type (2026-2034)
7.4.11.2. Rest of Asia Pacific Co-Packaged Optics Market Size and Forecast, By Data Rate (2026-2034)
7.4.11.3. Rest of Asia Pacific Co-Packaged Optics Market Size and Forecast, By Application (2026-2034)
8. Middle East and Africa Co-Packaged Optics Market Size and Forecast by Segmentation (by Value in USD Million) (2026-2034)
8.1. Middle East and Africa Co-Packaged Optics Market Size and Forecast, By Integration Type (2026-2034)
8.2. Middle East and Africa Co-Packaged Optics Market Size and Forecast, By Data Rate (2026-2034)
8.3. Middle East and Africa Co-Packaged Optics Market Size and Forecast, By Application (2026-2034)
8.4. Middle East and Africa Co-Packaged Optics Market Size and Forecast, by Country (2026-2034)
8.4.1. South Africa
8.4.1.1. South Africa Co-Packaged Optics Market Size and Forecast, By Integration Type (2026-2034)
8.4.1.2. South Africa Co-Packaged Optics Market Size and Forecast, By Data Rate (2026-2034)
8.4.1.3. South Africa Co-Packaged Optics Market Size and Forecast, By Application (2026-2034)
8.4.2. GCC
8.4.2.1. GCC Co-Packaged Optics Market Size and Forecast, By Integration Type (2026-2034)
8.4.2.2. GCC Co-Packaged Optics Market Size and Forecast, By Data Rate (2026-2034)
8.4.2.3. GCC Co-Packaged Optics Market Size and Forecast, By Application (2026-2034)
8.4.3. Nigeria
8.4.3.1. Nigeria Co-Packaged Optics Market Size and Forecast, By Integration Type (2026-2034)
8.4.3.2. Nigeria Co-Packaged Optics Market Size and Forecast, By Data Rate (2026-2034)
8.4.3.3. Nigeria Co-Packaged Optics Market Size and Forecast, By Application (2026-2034)
8.4.4. Rest of ME&A
8.4.4.1. Rest of ME&A Co-Packaged Optics Market Size and Forecast, By Integration Type (2026-2034)
8.4.4.2. Rest of ME&A Co-Packaged Optics Market Size and Forecast, By Data Rate (2026-2034)
8.4.4.3. Rest of ME&A Co-Packaged Optics Market Size and Forecast, By Application (2026-2034)
9. South America Co-Packaged Optics Market Size and Forecast by Segmentation (by Value in USD Million) (2026-2034)
9.1. South America Co-Packaged Optics Market Size and Forecast, By Integration Type (2026-2034)
9.2. South America Co-Packaged Optics Market Size and Forecast, By Data Rate (2026-2034)
9.3. South America Co-Packaged Optics Market Size and Forecast, By Application (2026-2034)
9.4. South America Co-Packaged Optics Market Size and Forecast, by Country (2026-2034)
9.4.1. Brazil
9.4.1.1. Brazil Co-Packaged Optics Market Size and Forecast, By Integration Type (2026-2034)
9.4.1.2. Brazil Co-Packaged Optics Market Size and Forecast, By Data Rate (2026-2034)
9.4.1.3. Brazil Co-Packaged Optics Market Size and Forecast, By Application (2026-2034)
9.4.2. Argentina
9.4.2.1. Argentina Co-Packaged Optics Market Size and Forecast, By Integration Type (2026-2034)
9.4.2.2. Argentina Co-Packaged Optics Market Size and Forecast, By Data Rate (2026-2034)
9.4.2.3. Argentina Co-Packaged Optics Market Size and Forecast, By Application (2026-2034)
9.4.3. Rest Of South America
9.4.3.1. Rest Of South America Co-Packaged Optics Market Size and Forecast, By Integration Type (2026-2034)
9.4.3.2. Rest Of South America Co-Packaged Optics Market Size and Forecast, By Data Rate (2026-2034)
9.4.3.3. Rest Of South America Co-Packaged Optics Market Size and Forecast, By Application (2026-2034)
10. Company Profile: Key Players
10.1. Intel Corporation (USA)
10.1.1. Company Overview
10.1.2. Business Portfolio
10.1.3. Financial Overview
10.1.4. SWOT Analysis
10.1.5. Strategic Analysis
10.1.6. Recent Developments
10.2. Broadcom Inc. (USA)
10.3. Cisco Systems (USA)
10.4. NVIDIA (USA)
10.5. TSMC (Thailand)
10.6. IBM Research (USA)
10.7. Huawei (China)
10.8. Juniper Networks (USA)
10.9. Marvell Technology (USA)
10.10. Ranovus (Canada)
10.11. Coherent Corp. (USA)
10.12. Lumentum Holdings (USA)
10.13. Infinera (USA)
10.14. NeoPhotonics (USA)
10.15. MACOM Technology (USA)
10.16. Ayar Labs (USA)
10.17. Lightmatter (USA)
10.18. Rockley Photonics (UK)
10.19. POET Technologies (Canada)
10.20. Alphawave Semi (UK)
10.21. OpenLight (Synopsys) (USA)
10.22. SiLC Technologies (USA)
10.23. Elenion Technologies (Nokia) (Germany)
10.24. EFFECT Photonics (Netherlands)
10.25. Lightelligence (USA)
10.26. Xanadu (Canada)
10.27. Scintil Photonics (France)
10.28. Aurrion (Juniper) (USA)
10.29. Tower Semiconductor (Israel)
10.30. VLC Photonics (Spain)Colgate-Palmolive (USA)
11. Key Findings
12. Analyst Recommendations
13. Co-Packaged Optics Market: Research Methodology