Wires and Cables Market - Global Industry Analysis by Market Share, Trend, Size, Competitive Landscape, Regional Outlook and Forecast 2026-2034
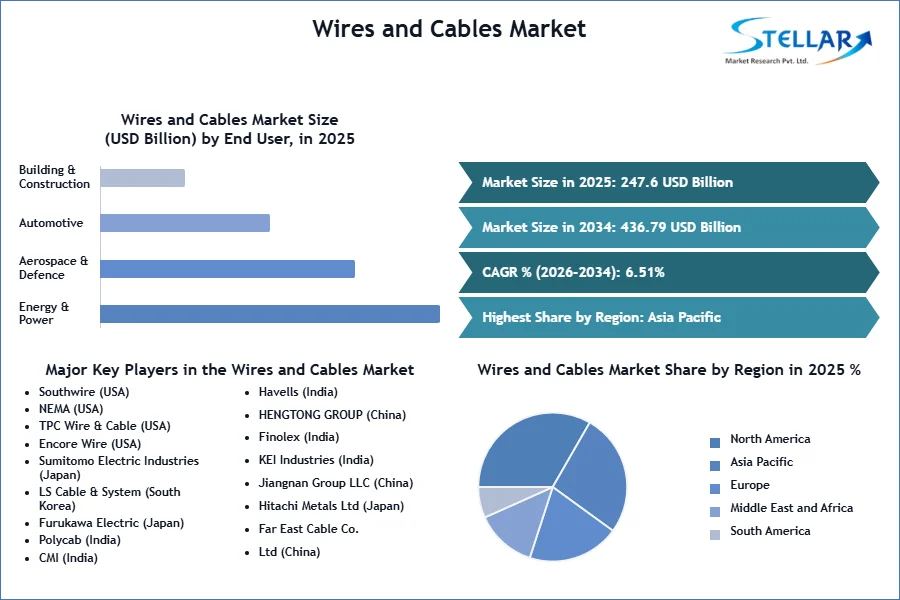
Global Wires and Cables Market size was valued at USD 247.6 Bn in 2025 and is expected to reach USD 436.79 Bn by 2034, at a CAGR of 6.51 %.
Wires and Cables Market Overview
A wire is defined as one electrical conductor, while a cable is defined as a group of individually insulated wires (conductors) encased together in sheathing. The sheathing is a non-conducting material with protective properties to shield the conducting part of the wire/cable. The global wires and cables market was valued at USD 247.6 billion in 2025 and is expected to grow at a compound annual growth rate (CAGR) of 6.51% from 2026 to 2034. Major factors driving this growth include rising urbanization and expanding infrastructure worldwide, which have significantly impacted power and energy demand across commercial, industrial, and residential sectors. Increased investments in upgrading power transmission and distribution systems, along with the development of smart grids, are also contributing to market growth. The implementation of smart grid technology has increased the need for grid interconnections, leading to heightened investments in new underground and submarine cables.
In 2025, India's exports of commodity group 8544, which includes insulated wires, cables, and optical fibre cables, totaled $2 billion, marking a 16.9% increase from 2024. This rise represented a $291 million boost over the previous year's $1.71 billion. Commodity group 8544 accounted for 0.465% of India's total exports, which amounted to $431 billion in 2025. This share increased by 0.086 percentage points from 0.379% in 2024 when total exports were $452 billion. Additionally, exports of commodity group 8544 made up 6.21% of India's total sales of the broader commodity group, which were valued at $32 billion in 2025. This share decreased by 0.246 percentage points from 6.46% in 2024 when total sales were $26 billion. The top export destinations for India's commodity group 8544 in 2025 included the USA (22%, $451 million), the UAE (9.48%, $190 million), the UK (8.32%, $167 million), Australia (4.66%, $93 million), Germany (2.42%, $48 million), France (2.42%, $48 million), Nepal (2.32%, $46 million), Japan (2.21%, $44 million), Spain (1.81%, $36 million), and Italy (1.75%, $35 million).
To get more Insights: Request Free Sample Report
Wires and Cables Market Dynamics
Rising Infrastructure Development in Buildings, Smart Cities, and Urbanization Driving Market Growth
The surge in global infrastructure projects is a significant driver for the wires and cables market. Governments and private sectors are investing heavily in new buildings, smart cities, and urbanization, necessitating robust electrical systems. For instance, Smart homes and buildings require sophisticated wiring systems to support automation, energy management, and enhanced connectivity. Companies that innovate and cater to these smart technology needs capitalize on this growing market segment. This development extends to residential, commercial, and industrial sectors, thereby driving demand for high-quality wiring and cabling solutions to ensure reliable and efficient power distribution.
US Bipartisan Infrastructure Law Fund (Breakdown of Spending under the Infrastructure Investment in 2025 and Jobs Act)
|
Category |
Funding Amount in Bn |
|
Roads and Bridges |
$110B |
|
Rail |
$66B |
|
Power Grid |
$65B |
|
Broadband Internet |
$65B |
|
Drinking Water |
$55B |
|
Resilience |
$50B |
|
Public Transit |
$39B |
|
Airports |
$25B |
|
Pollution Reduction |
$21B |
|
Ports and Waterways |
$17B |
|
Electric Vehicle Charging |
$8B |
Rapid advancements in technology, including the advent of smart grids and the Internet of Things (IoT), are propelling the forward. Innovations in cable materials and designs enhance efficiency, durability, and performance, meeting the evolving needs of modern infrastructure. Additionally, the expansion of renewable energy projects like wind and solar power requires specialized cables, further boosting market growth. Panasonic Life Solutions India is a leading player when it comes to the manufacturing of electrical construction materials (ECM). They are constantly innovating products in the building wires and cables space for both residential and commercial buildings. Their range of wires and cables includes advanced flame retardant, extra-flexible flame retardant, Fire-Guard FRLSH, and two core unsheathed cables. On the industrial front, the multi-core series of cables include both flat and round variants. For communication cables, offer telephone and switchboard cable, UTP 4Pair 6 LAN cable, co-axial cables and CCTV cables.
Telecommunications Sector Growth to Push the Market Forward
The exponential growth of the telecommunications industry, driven by increasing internet penetration and the rollout of 5G networks, is a crucial growth driver. High-speed data transmission and connectivity demand advanced fiber optic cables and other high-performance wiring solutions. This sector's expansion, along with the rise of cloud computing and data centers, significantly fuels the wires and cables market's growth trajectory.
India's internet penetration rate has significantly increased, reaching over 50% of the population as of 2025. This rapid digital expansion drives the demand for wires and cables, essential for supporting the infrastructure of broadband networks. The proliferation of fiber optic cables, crucial for high-speed internet, further boosts the wires and cables industry. Additionally, the government's push toward digital India and the rise in smart city projects amplify this demand, making the industry pivotal to the country's technological advancement.
Digitization and Renewables Projects to Boost the Market Growth
Digitalization is increasingly bringing major transformations in businesses. The transformation is being witnessed across the board, from products, processes, and people, to customer-centricity, governance, and social projects. Bharat Net is the world’s largest rural broadband connectivity program, aimed at connecting all the 2.5 lakh Gram Panchayats (GP) across India. As of June 2021, the Length of OFC Laid was 5,24,686 km, and the number of GPs where optical fiber cable (OFC) Laid was 1,72,941. On the renewables front, by 2040, India is likely to become the second-largest growth market for renewable energy.
Solar PV annual additions could increase by around 40 percent in three years, reaching 150 gigawatts (GW) by 2025. Pradhan Mantri Kisan Urja Suraksha Utthan Mahabhiyaan (PM KUSUM) boost demand for Solar energy equipment to a great extent. Factors like demographic dividend, Rapid urbanization, SMART Cities project, and Policy Initiatives likely drive the demand for wire and cables in the long term and influence Wires and Cables Market growth. Generally, wires consist of a single conductor whereas, cables involve one or more conductors used for the transmission of electricity, data, or signals. Following are the different types of wires and cable applications.

Union Budget 2025 has focused on nation's growth with major policy announcements in the energy, connectivity, and capacity building of the economy that will further contribute to the revival of the economy. One of the biggest drivers for the wires and cables industry is the real estate and infrastructure sectors. With Rs. 48,000 crore allocated to PM Awas Yojana for the year 2025-24, this will help and provide affordable homes to 80 lakh families.
Renewable Energy Expansion to Create Lucrative Opportunity for Wires and Cables Market
The global shift towards renewable energy presents substantial opportunities for the wires and cables market. With governments and organizations striving to reduce carbon emissions and adopt sustainable energy sources, there is a growing need for specialized cables in wind, solar, and hydroelectric projects. These renewable installations require durable and efficient cables for energy transmission and distribution, opening new avenues for market players.
As nations strive to reduce carbon emissions and transition to sustainable energy sources, the demand for renewable energy installations, such as solar and wind farms, has surged. These installations require extensive cabling for power generation, transmission, and distribution, significantly boosting the Wires and Cables Market growth. The development of renewable energy in the power sector is the result of increased policy attention to renewable power. As of 2024, as many as 174 countries had targets for renewable power shares (including 37 countries with targets for 100% renewable electricity), 49 countries had targets for biofuels, and 46 countries had targets for renewable heat, with only 9 and 3 new targets for biofuels and renewable heat, respectively, being announced in 2024. In contrast, more than 25 new targets for renewable power shares and installed capacity were announced in 2025.
Globally, China continued to lead in new renewable energy investments in 2025-24, accounting for 55% of the total. Europe followed with 11%, and the United States with 10%. Africa and the Middle East combined represented only 1.6% of global investment in renewables, indicating the high concentration of this investment in just a few regions. For renewable heat, Europe leads in the modern bioheat market, with a 24% share in 2020, followed by the United States with 13%. 20 China accounted for 73% of the solar water heating market, followed by Türkiye, the United States, Germany and Brazil. Also, the integration of smart grid technologies necessitates advanced cabling solutions to enhance efficiency and reliability. The increasing investment in renewable energy infrastructure propels the demand for high-performance, durable wires and cables, fostering wires and cables market growth.
Total energy investment worldwide is expected to exceed $3 trillion in 2025 for the first time, with some $2 trillion set to go toward clean technologies including renewables, electric vehicles, nuclear power, grids, storage, low-emissions fuels, efficiency improvements and heat pumps according to the latest edition of the IEA’s annual World Energy Investment report. The remainder, slightly over $1 trillion, is going to coal, gas and oil. In 2025, combined investment in renewable power and grids overtook the amount spent on fossil fuels for the first time.
The Wires and Cables Market Faces Several Challenging Factors:
Fluctuating raw material prices, particularly for copper and aluminum, impact production costs and profitability. Additionally, stringent regulatory standards regarding environmental sustainability and safety create compliance challenges for Wires and Cables manufacturers. The rapid pace of technological advancements necessitates continuous investment in research and development, which can strain resources for smaller companies.
Increasing competition from low-cost manufacturers in emerging markets poses pricing pressures, making it difficult for established players to maintain market share. Supply chain disruptions, especially those caused by geopolitical tensions or natural disasters, can affect the availability of materials and timely delivery.
The growing demand for renewable energy solutions requires wires and cables to meet specific performance standards, complicating product development and the shift towards digitalization and smart technologies increases the complexity of wiring systems, necessitating ongoing innovation and adaptation. Collectively, these factors create a dynamic environment that requires agility and strategic planning in the Wires and Cables industry.
Wires and Cables Market Segment Analysis
By Voltage: Based on voltage, the low voltage segment accounted for the largest Wires and Cables Market share in 2025. This is largely due to the extensive use of low-voltage cables in building wires, LAN cables, appliance wires, and distribution networks. These cables are essential for supporting smart grids and enhancing electric supply quality for end consumers. The global energy and power sector is undergoing rapid transformation, with many developing and developed countries experiencing high electricity demand and integrating large-scale renewable resources. In an increasingly digitized world, everything runs on power or electricity. Everyday electronic gadgets, such as laptops, mobile phones, cameras, microwaves, and fans, rely on electric grids and power stations through wires and cables.
Power generation, transmission, and distribution are critical for national security and economic functionality. Different devices have varied energy needs, leading to the use of various transmission forms. High-voltage cables power machines and gadgets demand greater energy but are costly. Conversely, low-voltage cables are affordable, carrying less energy and powering smartphones, laptops, and internet infrastructure. They are crucial for smart homes, sensors, security cameras, alarms, monitors, remote controls, motion sensors, and thermostats. Customizable and scalable, low-voltage cables are suitable for homeowners, small firms, and large MNCs. They offer easier application and greater safety compared to high-voltage cables.
However, the High voltage wires and cables, used for transmitting electricity from 1,000 volts, are insulated with paper and oil to prevent direct contact with individuals or other materials. The quality of these cables is determined by the type of insulation material used. The high demand from end-users in sectors such as power distribution, oil & gas, telecom, aerospace, and defense drives the growth of the high-voltage cable market. This demand is expected to continue growing over the forecast period.
By End Use: In 2024, the energy and power segment dominated the wires and cables market, capturing approximately xx% of the revenue share. This growth is driven by several technological upgrades, including the shift from old transmission lines to high/extra high voltage lines to minimize transmission losses. These changes aim to stabilize the electricity transmission and distribution (T&D) ecosystem against the intermittent nature of renewable energy sources. Also, new methodologies like synchronized charging of electric vehicles and net metering for solar homes have significantly impacted the utility sector. The increasing renewable power capacity and energy generation have heightened the need for countries to interconnect their transmission systems. This integration aims to balance power generation and demand through electricity export and import. As renewable energy generation rises, the electricity trade is expected to increase, leading to the construction of high-capacity interconnection lines, thereby driving the wires and cables market.
Wires and Cables Market Regional Analysis
Asia Pacific region holds a dominant Wires and Cables Market share and is poised for steady growth, driven by significant urbanization and infrastructure development in emerging economies like China and India. This growth is essential for powering buildings, transportation systems, and industries. The region's focus on renewable energy sources has boosted demand for specialized cables used in solar and wind projects, with substantial investments in renewable energy by China and India driving demand for high-quality cables. The development of smart cities and the increasing adoption of the Internet of Things (IoT) are creating opportunities for advanced cables and wiring solutions, necessitating reliable and efficient communication and power infrastructure, thereby fostering innovation in the wires and cables industry.
Major manufacturers, such as Asia Pacific Wire and Cable Corp Ltd., are prominent in distributing and manufacturing telecommunications (copper and fiber optic) and power cables, with a strong presence in China, Thailand, Australia, and Singapore. India's growing population and urbanization are fueling demand for wires and cables in residential, commercial, and industrial applications. Infrastructure developments, such as urban and rural roads, are expected to boost demand for optic fiber cables, telecom, and power cables in the coming years. China’s wire and cable manufacturers thrive in a robust domestic market and have become the world's largest wire and cable exporters.
Government initiatives like “Make in India” and the “Go Green” policy are expected to drive the Indian market. According to the Indian Electrical Equipment Industry Mission Plan 2012-2024, the government aims to establish India as a leading electrical equipment producer, targeting USD 100 billion in productivity by balancing exports and imports, thus boosting cable demand from 2012-2024
North America and Europe are also rapidly growing markets for wires and cables. In the U.S., renewable energy plays a crucial role in energy security and reducing greenhouse gas emissions. Renewable energy reduces dependence on energy imports and fossil fuels, which are the largest sources of U.S. carbon dioxide emissions. In 2025, hydroelectricity accounted for about 6.2% of total U.S. electricity generation and 28.7% of all utility-scale renewable electricity. The average share of hydroelectricity in U.S. electricity generation from 2001 to 2024-23 was around 6.7%. The growing preference for hydroelectricity positively impacts market growth through electricity transmission. Investments in renewable energy and commercial and manufacturing development activities across the U.S. and Canada are driving regional Wires and Cables Market growth. For example, the Canadian energy sector presents significant opportunities for U.S. companies due to existing assets and plans for further development.
Europe boasts abundant renewable energy sources and has become a leader in deploying renewable technologies. Efforts to enhance the sustainability of energy systems in Europe are ongoing, with renewable energy targets set for all European countries. The EU installed 15 gigawatts (GW) of new wind farms in 2025-24, a third more than in 2023. Germany, Sweden, and Finland lead in new capacity installations, followed by Spain and France.
Conclusion: The wires and cables market is poised for substantial growth, driven by factors such as urbanization, infrastructure development, and the increasing demand for renewable energy solutions. With a market valuation of USD 247.6 billion in 2025, the sector is expected to expand at a CAGR of 6.51% through 2034. The rise of smart cities and advancements in technologies like smart grids and the Internet of Things (IoT) are further fueling this demand. Government initiatives, such as the US Bipartisan Infrastructure Law and India’s commitment to renewable energy, play pivotal roles in shaping the market landscape. However, challenges such as fluctuating raw material prices and stringent regulatory requirements necessitate continuous innovation. As the global shift towards sustainable energy continues, specialized cables for solar, wind, and advanced telecommunications are expected to become critical, presenting lucrative opportunities for market players. Overall, the dynamic nature of the wires and cables industry underscores the importance of strategic planning and agility to capitalize on emerging trends and technological advancements.
Wires and Cables Market Scope
|
Wires and Cables Market |
|
|
Market Size in 2025 |
USD 247.6 Bn. |
|
Market Size in 2034 |
USD 436.79 Bn. |
|
CAGR (2026-2034) |
6.51 % |
|
Historic Data |
2020-2025 |
|
Base Year |
2025 |
|
Forecast Period |
2026-2034 |
|
Wires and Cables Market Segments |
By Voltage
|
|
By Installation
|
|
|
By End Use
|
|
|
Regional Scope |
North America – United States, Canada, and Mexico Europe – UK, France, Germany, Italy, Spain, Russia, Austria, and Rest of Europe Asia Pacific – China, India, Japan, South Korea, Australia, ASEAN, Rest of APAC Middle East and Africa – South Africa, GCC, Egypt, Nigeria, Rest of the Middle East and Africa South America – Brazil, Argentina, Rest of South America |
Wires and Cables Key players
North America Wires and Cables Manufacturers
- Southwire (USA)
- NEMA (USA)
- TPC Wire & Cable (USA)
- Encore Wire (USA)
- Arrow Electronics, Inc. (Centennial, Colorado, United States)
Europe Wires and Cables Leading Players
- NKT (Denmark)
- Prysmian (Italy)
- Nexans S.A. (France)
- Leoni AG (Germany)
Asia Pacific Wires and Cables Key Companies
- Sumitomo Electric Industries (Japan)
- LS Cable & System (South Korea)
- Furukawa Electric (Japan)
- Polycab (India)
- CMI (India)
- Havells (India)
- HENGTONG GROUP (China)
- Finolex (India)
- KEI Industries (India)
- Jiangnan Group LLC (China)
- Hitachi Metals Ltd (Japan)
- Far East Cable Co., Ltd (China)
- Bahra Advanced Cable (Saudi Arabia)
Frequently Asked Questions
Ans. Asia Pacific is expected to dominate the Wires and Cables market during the forecast period.
Ans. The Wires and Cables market size is expected to reach USD 436.79 Bn by 2034.
Ans. The major top players in the Global Wires and Cables Market are Southwire (USA), NEMA (USA), and others.
Ans. Rising Infrastructure Development in Buildings, Smart Cities, and Urbanization Driving Market Growth.
1. Research Methodology
1.1 Research Data
1.1.1. Primary Data
1.1.2. Secondary Data
1.2. Market Size Estimation
1.2.1. Bottom-Up Approach
1.2.2. Top-Down Approach
1.3. Market Breakdown and Data Triangulation
1.4. Research Assumption
2. Wires and Cables Market: Executive Summary
2.1. Market Overview
2.2. Market Size (2025) and Forecast (2026– 2034) and Y-O-Y%
2.3. Market Size (USD) and Market Share (%) – By Segments and Regions
3. Global Wires and Cables Market: Competitive Landscape
3.1. SMR Competition Matrix
3.2. Key Players Benchmarking
3.2.1. Company Name
3.2.2. Headquarter
3.2.3. Product Segment
3.2.4. End-user Segment
3.2.5. Y-O-Y%
3.2.6. Revenue (2025)
3.2.7. Profit Margin
3.2.8. Market Share
3.2.9. Company Locations
3.3. Market Structure
3.3.1. Market Leaders
3.3.2. Market Followers
3.3.3. Emerging Players
3.4. Consolidation of the Market
3.4.1. Strategic Initiatives and Developments
3.4.2. Mergers and Acquisitions
3.4.3. Collaborations and Partnerships
3.4.4. Product Launches
4. Wires and Cables Market: Dynamics
4.1. Wires and Cables Market Trends by Region
4.1.1. North America
4.1.2. Europe
4.1.3. Asia Pacific
4.1.4. Middle East and Africa
4.1.5. South America
4.2. Wires and Cables Market Drivers
4.3. Wires and Cables Market Restraints
4.4. Wires and Cables Market Opportunities
4.5. Wires and Cables Market Challenges
4.6. PORTER’s Five Forces Analysis
4.6.1. Intensity of the Rivalry
4.6.2. Threat of New Entrants
4.6.3. Bargaining Power of Suppliers
4.6.4. Bargaining Power of Buyers
4.6.5. Threat of Substitutes
4.7. PESTLE Analysis
4.7.1. Political Factors
4.7.2. Economic Factors
4.7.3. Social Factors
4.7.4. Technological Factor
4.7.5. Legal Factors
4.7.6. Environmental Factors
4.8. Technological Analysis
4.8.1. Wire Drawing
4.8.2. Annealing
4.8.3. Twisting and Stranding
4.8.4. Extrusion
4.8.5. Cabling
4.8.6. 3D-Printied Wires and Nanotechnology
4.8.7. Smart Wires & Cables
4.8.8. Technological Roadmap
4.9. Value Chain Analysis
4.10. Regulatory Landscape
4.10.1. Market Regulation by Region
4.10.1.1. North America
4.10.1.2. Europe
4.10.1.3. Asia Pacific
4.10.1.4. Middle East and Africa
4.10.1.5. South America
4.10.2. Impact of Regulations on Market Dynamics
4.10.3. Government Schemes and Initiatives
5. Wires and Cables Market: Global Market Size and Forecast by Segmentation (by Value in USD Billion) (2026-2034)
5.1. Wires and Cables Market Size and Forecast, by Voltage (2026-2034)
5.1.1. Low
5.1.2. High
5.1.3. Extra high
5.2. Wires and Cables Market Size and Forecast, by Installation (2026-2034)
5.2.1. Overhead
5.2.2. Underground
5.3. Wires and Cables Market Size and Forecast, by End Use (2026-2034)
5.3.1. Energy & Power
5.3.2. Aerospace & Defence
5.3.3. Automotive
5.3.4. Building & Construction
5.3.5. Oil & Gas
5.3.6. IT & Telecommunication
5.3.7. Others
5.4. Wires and Cables Market Size and Forecast, by Region (2026-2034)
5.4.1. North America
5.4.2. Europe
5.4.3. Asia Pacific
5.4.4. Middle East and Africa
5.4.5. South America
6. North America Wires and Cables Market Size and Forecast by Segmentation (by Value in USD Billion) (2026-2034)
6.1. North America Wires and Cables Market Size and Forecast, by Voltage (2026-2034)
6.1.1. Low
6.1.2. High
6.1.3. Extra high
6.2. North America Wires and Cables Market Size and Forecast, by Installation (2026-2034)
6.2.1. Overhead
6.2.2. Underground
6.3. North America Wires and Cables Market Size and Forecast, by End Use (2026-2034)
6.3.1. Energy & Power
6.3.2. Aerospace & Defence
6.3.3. Automotive
6.3.4. Building & Construction
6.3.5. Oil & Gas
6.3.6. IT & Telecommunication
6.3.7. Others
6.4. North America Wires and Cables Market Size and Forecast, by Country (2026-2034)
6.4.1. United States
6.4.2. Canada
6.4.3. Mexico
7. Europe Wires and Cables Market Size and Forecast by Segmentation (by Value in USD Billion) (2026-2034)
7.1. Europe Wires and Cables Market Size and Forecast, by Voltage (2026-2034)
7.2. Europe Wires and Cables Market Size and Forecast, by Installation (2026-2034)
7.3. Europe Wires and Cables Market Size and Forecast, by End Use (2026-2034)
7.4. Europe Wires and Cables Market Size and Forecast, by Country (2026-2034)
7.4.1. United Kingdom
7.4.2. France
7.4.3. Germany
7.4.4. Italy
7.4.5. Spain
7.4.6. Sweden
7.4.7. Russia
7.4.8. Rest of Europe
8. Asia Pacific Wires and Cables Market Size and Forecast by Segmentation (by Value in USD Billion) (2026-2034)
8.1. Asia Pacific Wires and Cables Market Size and Forecast, by Voltage (2026-2034)
8.2. Asia Pacific Wires and Cables Market Size and Forecast, by Installation (2026-2034)
8.3. Asia Pacific Wires and Cables Market Size and Forecast, by End Use (2026-2034)
8.4. Asia Pacific Wires and Cables Market Size and Forecast, by Country (2026-2034)
8.4.1. China
8.4.2. India
8.4.3. Japan
8.4.4. South Korea
8.4.5. Australia
8.4.6. ASEAN
8.4.7. Rest of Asia Pacific
9. Middle East and Africa Wires and Cables Market Size and Forecast by Segmentation (by Value in USD Billion) (2026-2034)
9.1. Middle East and Africa Wires and Cables Market Size and Forecast, by Voltage (2026-2034)
9.2. Middle East and Africa Wires and Cables Market Size and Forecast, by Installation (2026-2034)
9.3. Middle East and Africa Wires and Cables Market Size and Forecast, by End Use (2026-2034)
9.4. Middle East and Africa Wires and Cables Market Size and Forecast, by Country (2026-2034)
9.4.1. South Africa
9.4.2. GCC
9.4.3. Egypt
9.4.4. Nigeria
9.4.5. Rest of the Middle East and Africa
10. South America Wires and Cables Market Size and Forecast by Segmentation (by Value in USD Billion) (2026-2034)
10.1. South America Wires and Cables Market Size and Forecast, by Voltage (2026-2034)
10.2. South America Wires and Cables Market Size and Forecast, by Installation (2026-2034)
10.3. South America Wires and Cables Market Size and Forecast, by End Use (2026-2034)
10.4. South America Wires and Cables Market Size and Forecast, by Country (2026-2034)
10.4.1. Brazil
10.4.2. Argentina
10.4.3. Rest Of South America
11. Company Profile: Key Players
11.1. Southwire (USA)
11.1.1. Company Overview
11.1.2. Product Portfolio
11.1.2.1. Product Name
11.1.2.2. Product Details (Price, Features, etc.)
11.1.3. Financial Overview
11.1.3.1. Total Revenue
11.1.3.2. Segment Revenue
11.1.3.3. Regional Revenue
11.1.4. SWOT Analysis
11.1.5. Strategic Analysis
11.1.6. Recent Developments
11.2. NEMA (USA)
11.3. TPC Wire & Cable (USA)
11.4. Encore Wire (USA)
11.5. Arrow Electronics, Inc. (Centennial, Colorado, United States)
11.6. NKT (Denmark)
11.7. Prysmian (Italy)
11.8. Nexans S.A. (France)
11.9. Leoni AG (Germany)
11.10. Sumitomo Electric Industries (Japan)
11.11. LS Cable & System (South Korea)
11.12. Furukawa Electric (Japan)
11.13. Polycab (India)
11.14. CMI (India)
11.15. Havells (India)
11.16. HENGTONG GROUP (China)
11.17. Finolex (India)
11.18. KEI Industries (India)
11.19. Jiangnan Group LLC (China)
11.20. Hitachi Metals Ltd (Japan)
11.21. Far East Cable Co., Ltd (China)
11.22. Bahra Advanced Cable (Saudi Arabia)
12. Key Findings
13. Analyst Recommendations
13.1. Strategic Recommendations
13.2. Future Outlook