Virtual Tour Market Size, Share & Trends Analysis Report by Type, Technology, Application, Region and Global Forecasts (2026-2032)
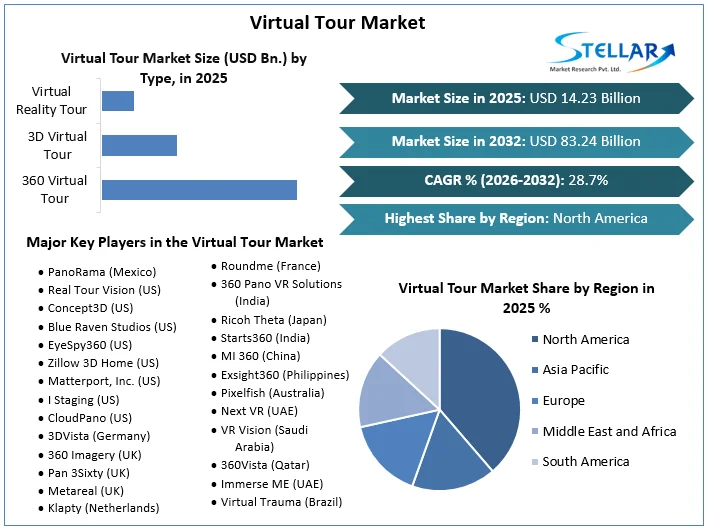
The Virtual Tour Market size was valued at USD 14.23 billion in 2025, and the total Virtual Tour Market revenue is expected to grow at a CAGR of 28.7% from 2026 to 2032, reaching nearly USD 83.24 billion.
Virtual Tour Market Overview:
A virtual tour is an immersive digital simulation of a real-world location, typically used in real estate, tourism, education, and retail sectors, allowing users to experience spaces remotely through 360-degree visuals, 3D mapping, and interactive media. It enhances user engagement, provides cost-effective site visits, and supports decision-making in both B2B and B2C applications.
The virtual tour market is experiencing rapid growth due to the increasing demand for contact-free experiences, which has been accelerated by the COVID-19 pandemic, and there is an increase in remote services across various industries. Real estate firms use virtual tourism to demonstrate properties without physical trips, while educational institutions and Museums are adopting them for interactive learning. Progress in VR/AR technologies, cloud computing, and 5G connectivity further enhances user experience and access. For example, Matterport's AI-powered 3D capture platform enables scalable virtual tours to the platform real estate and commercial purposes. Governments are also investing in virtual tourism initiative to revive travel interest by reducing carbon emissions from traditional travel.
Global trade policies and regional regulations are influencing market access and technology deployment. The EU’s Digital Services Act promotes content transparency and fair platform use, aiding smaller virtual tour providers. Meanwhile, U.S. tech export controls and data privacy laws affect cloud service operations, and India's Digital India initiative supports virtual infrastructure for educational and tourism uses. These shifts are prompting increased investment in localized virtual content, expected to raise platform subscription pricing by 7–10% short term while promoting innovation in lightweight, mobile-compatible virtual tour solutions for remote customer engagement.
To get more Insights: Request Free Sample Report
Virtual Tour Market Dynamics:
Technological Progress and Growing Virtual Reality tools to Drive the Virtual Tour Market
Integration of enhanced and virtual reality techniques has enhanced the application of virtual reality in various industrial functions. One of the growing applications of virtual reality is a virtual tour software that supports destination-based marketing. Many industries, such as education, motor vehicle, manufacturing, security, real estate, tourism and hospitality, are adopting this software prominently as a new marketing strategy to enhance the busyness of the customer. The marketing strategy is expected to improve customer experience and promote interactive sessions through virtual solutions. For example, In March 2022, Intel Corporation introduced its virtual Intel Museums in California for people around the world. The company implemented a 3D interactive virtual tour for a remote visitor to detect Museums materials, the floor of the Ambal Museums and to interact with demonstrations.
Lack of Awareness and Information about Services to Restrain the growth of Virtual Tour Market
The software allows all potential customers to browse and access information. However, the final-user, such as educational institutions, real estate, tourism and hospitality, can show limited data to customers. Customers may restrain access to data from surrounding locations. Tour providers may be unable to provide or restrict the areas they do not want to show, this can affect the market growth negatively.
Virtual Tour Market Segment Analysis:
Based on Type, the 3D virtual tour segment dominated the Global Virtual Tour Market in 2025 and the same trend is expected to continue during the forecast period. 3D virtual tours can be made with beautiful details and crowds of interactive options. They can be deployed on the web or packed in the app for mobile, desktop and other platforms. Due to the emergence of the Internet, people have been intensely on social media sites. People first browse through websites, collect detailed information, and review the required product or service before shopping. In addition, social media such as Facebook, Twitter and travel blogs have become a common medium to discuss travel plans for people. Consumers are experiencing 3D virtual tour for various applications such as tourism, real estate, Museums.
Based on Technology, the largest market share in the Semi and Fully Immersive segment was in 2025, due to progress in virtual reality (VR) and augmented reality (AR), the growing requirement of innovative marketing strategies, and desire to provide interactive experience to customers, and for the desire to improve VR and AR technologies to the desire and virtual tourism.
The non-immersive segment is expected to witness a notable growth from during forecast period, which is inspired by the increasing requirement to eliminate the need for expensive hardware, which is more accessible to the widespread viewers, increasing demand for small and medium-sized enterprises to offer virtual experiences without significant investment.

Based on Application, the largest market share in the real estate segment was in 2025, which allows potential buyers to detect remote spaces, due to increasing the virtual tour software for 360-degrees ideas of properties, the growing demand for the increased assets, and the growing property list, all this needs to be detected by potential buyers remotely.
Tourism and hospitality segments are expected to register the fastest growth during forecast period, which is inspired by the increasing requirement of destination, hotels, resorts, and attraction before booking, still a growing requirement of more attractive and interactive methods to promote destinations and housing than images and text details.
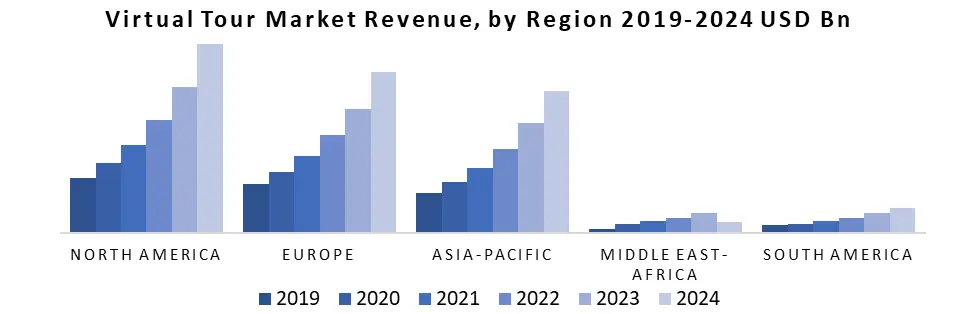
Virtual Tour Market Regional Insights:
In 2025, North America had a major market share in the virtual tour market. This prominence is largely by a strong technical infrastructure and a high degree of digital literacy among its population. The market leadership of the region is carried forward with the presence of major players in the virtual tour technology sector, which continuously innovate and invest in new features and capabilities.
Market dominance in North America is also supported by adequate investment in virtual and enhanced reality areas, especially in the United States and Canada, where VR and AR solutions have a significant appearance of technical giants and startups. These companies are constantly innovating and expanding virtual tourism applications beyond traditional places such as real estate and tourism.
The strong economic environment of the region and the desire to connect with consumers' interactive and immersive digital experiences leads to the development of the virtual tour market. In addition, the ongoing expansion of the 5G network in North America, increases the quality and access of the virtual tour, which promises more and more market development and consumer in the coming years.
Virtual Tour Market Competitive Landscape:
- Kula is an expert at providing LLC Virtual Tour Creation tools, allowing users to make, share, and interact with 360-degree photos and virtual tours. The platform is designed to serve both individual users and businesses in various industries. Kula offers a web-based platform to create and publish interactive virtual tours using 360-degree images. Users can upload their own 360-degree photos or capture the new content using a 360- degree cameras. The company offers more advanced features from a free version for personal use, from a free version for more advanced features for businesses and professionals, increased adaptation, cloud storage and more advanced features with high-quality images.
- 360-degree in the round is expert at providing a platform to create and share and share virtual tours. The company enables users to create interactive virtual experiences for various types of applications including real estate, tourism, photography and events. The 360-degree provides a spontaneous platform to create a 360-degree virtual tour. Users can upload their 360-degree images and combine them together to create a virtual experience. The company offers hosting for the virtual tour, allowing users to easily share their works through embedded links or social media. The company supports both public and private virtual tours, providing a flexible solution for personal or commercial use.
Virtual Tour Market Recent Developments:
- January 2024, Planitar Inc. A solution designed to replace the Real Estate Photography Industry in an inexpensive and fast way to generate 3D virtual tours and interactive floor plans. This solution is aimed at real estate photographers, allowing them to produce high-quality virtual tourism and floor schemes, which often occur within a few minutes of capturing property data.
- July 2023, RTV Inc. launched a new membership-based pricing model. This flexible pricing structure is particularly beneficial for real estate agents and brokers, allowing them to select schemes that align with their specific requirements and budgets, making them more accessible and cost -effective for professionals in the industry.
- In February 2023, Matterport Inc. launched an all-in-one marketing solution for Digital Pro, real estate agents. Matterport's 3D digital twin technique allows real estate professionals to create virtual models of properties, allowing potential buyers to be able to find out and interact with remote listings. It provides a wide, realistic approach to immersive experience assets, helping buyers to make informed decisions without traveling in person.
- In June 2022, Concept 3D, Inc. announced a partnership with Higher Education Engagement Hub, Path to offer a campus tour through virtual mapping.
- In April 2022, Washington-based Mass interacted with full measurement education to offer virtual tour solutions to increase campus visits. The aim of the partnership is to improve student enrolment and retention, corresponding virtual experience, and more.
- March 2022, Concept 3D, Inc. announced a strategic cooperation with a software development company, Platform Q Education, a software development company to integrate Concept 3D and Platform Q solution capabilities.
|
Virtual Tour Market Scope |
|
|
Market Size in 2025 |
USD 14.23 Bn. |
|
Market Size in 2032 |
USD 83.24 Bn. |
|
CAGR (2026-2032) |
28.7% |
|
Historic Data |
2020-2025 |
|
Base Year |
2025 |
|
Forecast Period |
2026-2032 |
|
Segments |
By Type 360 Virtual Tour 3D Virtual Tour Virtual Reality Tour |
|
By Technology Non-Immersive Semi and Fully Immersive |
|
|
By Application Real Estate Tourism and Hospital Art Galleries and Museums Others |
|
|
Regional Scope |
North America- United States, Canada, and Mexico Europe – UK, France, Germany, Italy, Spain, Sweden, Russia, and Rest of Europe Asia Pacific – China, India, Japan, South Korea, Australia, Malaysia, Vietnam, Thailand, Philippines, Indonesia, Rest of Asia-Pacific Middle East and Africa - South Africa, GCC, Egypt, Nigeria, Rest of the Middle East and Africa South America – Brazil, Argentina, Rest of South America
|
Key Players in the Virtual Tour Market:
North America
- PanoRama (Mexico)
- Real Tour Vision (US)
- Concept3D (US)
- Blue Raven Studios (US)
- EyeSpy360 (US)
- Zillow 3D Home (US)
- Matterport, Inc. (US)
- I Staging (US)
- CloudPano (US)
Europe
- 3DVista (Germany)
- 360 Imagery (UK)
- Pan 3Sixty (UK)
- Metareal (UK)
- Klapty (Netherlands)
- Roundme (France)
Asia-Pacific
- 360 Pano VR Solutions (India)
- Ricoh Theta (Japan)
- Starts360 (India)
- MI 360 (China)
- Exsight360 (Philippines)
- Pixelfish (Australia)
Middle East & Africa
- Next VR (UAE)
- VR Vision (Saudi Arabia)
- 360Vista (Qatar)
- Immerse ME (UAE)
South America
- Virtual Trauma (Brazil)
- Afri360 (South Africa)
- Egypt 360 Tours (Egypt)
Frequently Asked Questions
Real estate, tourism, and education sectors are the primary users of virtual tours for showcasing spaces and improving experiences.
The virtual tour market is primarily driven by progress in virtual reality and promoted reality technologies, making virtual tours more immersive and accessible.
North America leads due to advanced tech and strong digital infrastructure; Asia-Pacific is growing fast with rising digitalization.
The Ricoh Company (Japan), Matterport Inc. (US), Real Tour Vision, Inc. (US), Concept3D, Inc. (US), Cloud Pano (US), Eyespy360 (UK) are some of the key players of the Virtual Tour Market.
1. Virtual Tour Market Introduction
1.1. Study Assumption and Market Definition
1.2. Scope of the Study
1.3. Executive Summary
2. Global Virtual Tour Market: Competitive Landscape
2.1. Ecosystem Analysis
2.2. SMR Competition Matrix
2.3. Competitive Landscape
2.4. Key Players Benchmarking
2.4.1. Company Name
2.4.2. Business Segment
2.4.3. End-user Segment
2.4.4. Revenue (2025)
2.4.5. Company Locations
2.5. Market Structure
2.5.1. Market Leaders
2.5.2. Market Followers
2.5.3. Emerging Players
2.6. Mergers and Acquisitions Details
3. Virtual Tour Market: Dynamics
3.1. Virtual Tour Market Trends by Region
3.1.1. North America Virtual Tour Market Trends
3.1.2. Europe Virtual Tour Market Trends
3.1.3. Asia Pacific Virtual Tour Market Trends
3.1.4. Middle East and Africa Virtual Tour Market Trends
3.1.5. South America Virtual Tour Market Trends
3.2. Virtual Tour Market Dynamics
3.2.1. Global Virtual Tour Market Drivers
3.2.2. Global Virtual Tour Market Restraints
3.2.3. Global Virtual Tour Market Opportunities
3.2.4. Global Virtual Tour Market Challenges
3.3. PORTER’s Five Forces Analysis
3.4. PESTLE Analysis
3.5. Technology Analysis
3.6. Pricing Analysis
3.6.1. Average Selling Price Trend of key players, by Component
3.6.2. Average Selling Price Trend, by Region
3.7. Regulatory Landscape by Region
3.7.1. North America
3.7.2. Europe
3.7.3. Asia Pacific
3.7.4. Middle East and Africa
3.7.5. South America
3.8. Key Opinion Leader Analysis for Virtual Tour Industry
4. Virtual Tour Market: Global Market Size and Forecast by Segmentation (by Value in USD Billion) (2025-2032)
4.1 Virtual Tour Market Size and Forecast, By Type (2025-2032)
4.1.1. 360 Virtual Tour
4.1.2. 3D Virtual Tour
4.1.3. Virtual Reality Tour
4.2. Virtual Tour Market Size and Forecast, By Technology (2025-2032)
4.2.1. Non-Immersive
4.2.2. Semi and Fully Immersive
4.3. Virtual Tour Market Size and Forecast, By Application (2025-2032)
4.3.1. Real Estate
4.3.2. Tourism and Hospitality
4.3.3. Art Galleries and Museums
4.3.4. Others
4.4. Virtual Tour Market Size and Forecast, by Region (2025-2032)
4.4.1. North America
4.4.2. Europe
4.4.3. Asia Pacific
4.4.4. Middle East and Africa
4.4.5. South America
5. North America Virtual Tour Market Size and Forecast by Segmentation (by Value in USD Billion) (2025-2032)
5.1. North America Virtual Tour Market Size and Forecast, By Type (2025-2032)
5.1.1. 360 Virtual Tour
5.1.2. 3D Virtual Tour
5.1.3. Virtual Reality Tour
5.2. North America Virtual Tour Market Size and Forecast, By Technology (2025-2032)
5.2.1. Non-Immersive
5.2.2. Semi and Fully Immersive
5.3. North America Virtual Tour Market Size and Forecast, By Application (2025-2032)
5.3.1. Real Estate
5.3.2. Tourism and Hospitality
5.3.3. Art Galleries and Museums
5.3.4. Others
5.4. North America Virtual Tour Market Size and Forecast, by Country (2025-2032)
5.4.1. United States
5.4.1.1. United States Virtual Tour Market Size and Forecast, By Type (2025-2032)
5.4.2. 360 Virtual Tour
5.4.3. 3D Virtual Tour
5.4.4. Virtual Reality Tour
5.4.4.1. United States Virtual Tour Market Size and Forecast, By Technology (2025-2032)
5.4.5. Non-Immersive
5.4.6. Semi and Fully Immersive
5.4.6.1. United States Virtual Tour Market Size and Forecast, By Application (2025-2032)
5.4.7. Real Estate
5.4.8. Tourism and Hospitality
5.4.9. Art Galleries and Museums
5.4.10. Others
5.4.10.1. Canada Virtual Tour Market Size and Forecast, By Type (2025-2032)
5.4.11. 360 Virtual Tour
5.4.12. 3D Virtual Tour
5.4.13. Virtual Reality Tour
5.4.13.1. Canada Virtual Tour Market Size and Forecast, By Technology (2025-2032)
5.4.14. Non-Immersive
5.4.15. Semi and Fully Immersive
5.4.16. Canada Virtual Tour Market Size and Forecast, By Application (2025-2032)
5.4.17. Real Estate
5.4.18. Tourism and Hospitality
5.4.19. Art Galleries and Museums
5.4.20. Others
5.4.21. Mexico
5.4.21.1. Mexico Virtual Tour Market Size and Forecast, By Type (2025-2032)
5.4.22. 360 Virtual Tour
5.4.23. 3D Virtual Tour
5.4.24. Virtual Reality Tour
5.4.24.1. Mexico Virtual Tour Market Size and Forecast, By Technology (2025-2032)
5.4.25. Non-Immersive
5.4.26. Semi and Fully Immersive
5.4.26.1. Mexico Virtual Tour Market Size and Forecast, By Application (2025-2032)
5.4.27. Real Estate
5.4.28. Tourism and Hospitality
5.4.29. Art Galleries and Museums
5.4.30. Others
6. Europe Virtual Tour Market Size and Forecast by Segmentation (by Value in USD Billion) (2025-2032)
6.1. Europe Virtual Tour Market Size and Forecast, By Type (2025-2032)
6.2. Europe Virtual Tour Market Size and Forecast, By Technology (2025-2032)
6.3. Europe Virtual Tour Market Size and Forecast, By Application (2025-2032)
6.4. Europe Virtual Tour Market Size and Forecast, by Country (2025-2032)
6.4.1. United Kingdom
6.4.1.1. United Kingdom Virtual Tour Market Size and Forecast, By Type (2025-2032)
6.4.1.2. United Kingdom Virtual Tour Market Size and Forecast, By Technology (2025-2032)
6.4.1.3. United Kingdom Virtual Tour Market Size and Forecast, By Application (2025-2032)
6.4.2. France
6.4.2.1. France Virtual Tour Market Size and Forecast, By Type (2025-2032)
6.4.2.2. France Virtual Tour Market Size and Forecast, By Technology (2025-2032)
6.4.2.3. France Virtual Tour Market Size and Forecast, By Application (2025-2032)
6.4.3. Germany
6.4.3.1. Germany Virtual Tour Market Size and Forecast, By Type (2025-2032)
6.4.3.2. Germany Virtual Tour Market Size and Forecast, By Technology (2025-2032)
6.4.3.3. Germany Virtual Tour Market Size and Forecast, By Application (2025-2032)
6.4.4. Italy
6.4.4.1. Italy Virtual Tour Market Size and Forecast, By Type (2025-2032)
6.4.4.2. Italy Virtual Tour Market Size and Forecast, By Technology (2025-2032)
6.4.4.3. Italy Virtual Tour Market Size and Forecast, By Application (2025-2032)
6.4.5. Spain
6.4.5.1. Spain Virtual Tour Market Size and Forecast, By Type (2025-2032)
6.4.5.2. Spain Virtual Tour Market Size and Forecast, By Technology (2025-2032)
6.4.5.3. Spain Virtual Tour Market Size and Forecast, By Application (2025-2032)
6.4.6. Sweden
6.4.6.1. Sweden Virtual Tour Market Size and Forecast, By Type (2025-2032)
6.4.6.2. Sweden Virtual Tour Market Size and Forecast, By Technology (2025-2032)
6.4.6.3. Sweden Virtual Tour Market Size and Forecast, By Application (2025-2032)
6.4.7. Austria
6.4.7.1. Austria Virtual Tour Market Size and Forecast, By Type (2025-2032)
6.4.7.2. Austria Virtual Tour Market Size and Forecast, By Technology (2025-2032)
6.4.7.3. Austria Virtual Tour Market Size and Forecast, By Application (2025-2032)
6.4.8. Rest of Europe
6.4.8.1. Rest of Europe Virtual Tour Market Size and Forecast, By Type (2025-2032)
6.4.8.2. Rest of Europe Virtual Tour Market Size and Forecast, By Technology (2025-2032)
6.4.8.3. Rest of Europe Virtual Tour Market Size and Forecast, By Application (2025-2032)
7. Asia Pacific Virtual Tour Market Size and Forecast by Segmentation (by Value in USD Billion) (2025-2032)
7.1. Asia Pacific Virtual Tour Market Size and Forecast, By Type (2025-2032)
7.2. Asia Pacific Virtual Tour Market Size and Forecast, By Technology (2025-2032)
7.3. Asia Pacific Virtual Tour Market Size and Forecast, By Application (2025-2032)
7.4. Asia Pacific Virtual Tour Market Size and Forecast, by Country (2025-2032)
7.4.1. China
7.4.1.1. China Virtual Tour Market Size and Forecast, By Type (2025-2032)
7.4.1.2. China Virtual Tour Market Size and Forecast, By Technology (2025-2032)
7.4.1.3. China Virtual Tour Market Size and Forecast, By Application (2025-2032)
7.4.2. S Korea
7.4.2.1. S Korea Virtual Tour Market Size and Forecast, By Type (2025-2032)
7.4.2.2. S Korea Virtual Tour Market Size and Forecast, By Technology (2025-2032)
7.4.2.3. S Korea Virtual Tour Market Size and Forecast, By Application (2025-2032)
7.4.3. Japan
7.4.3.1. Japan Virtual Tour Market Size and Forecast, By Type (2025-2032)
7.4.3.2. Japan Virtual Tour Market Size and Forecast, By Technology (2025-2032)
7.4.3.3. Japan Virtual Tour Market Size and Forecast, By Application (2025-2032)
7.4.4. India
7.4.4.1. India Virtual Tour Market Size and Forecast, By Type (2025-2032)
7.4.4.2. India Virtual Tour Market Size and Forecast, By Technology (2025-2032)
7.4.4.3. India Virtual Tour Market Size and Forecast, By Application (2025-2032)
7.4.5. Australia
7.4.5.1. Australia Virtual Tour Market Size and Forecast, By Type (2025-2032)
7.4.5.2. Australia Virtual Tour Market Size and Forecast, By Technology (2025-2032)
7.4.5.3. Australia Virtual Tour Market Size and Forecast, By Application (2025-2032)
7.4.6. Indonesia
7.4.6.1. Indonesia Virtual Tour Market Size and Forecast, By Type (2025-2032)
7.4.6.2. Indonesia Virtual Tour Market Size and Forecast, By Technology (2025-2032)
7.4.6.3. Indonesia Virtual Tour Market Size and Forecast, By Application (2025-2032)
7.4.7. Malaysia
7.4.7.1. Malaysia Virtual Tour Market Size and Forecast, By Type (2025-2032)
7.4.7.2. Malaysia Virtual Tour Market Size and Forecast, By Technology (2025-2032)
7.4.7.3. Malaysia Virtual Tour Market Size and Forecast, By Application (2025-2032)
7.4.8. Vietnam
7.4.8.1. Vietnam Virtual Tour Market Size and Forecast, By Type (2025-2032)
7.4.8.2. Vietnam Virtual Tour Market Size and Forecast, By Technology (2025-2032)
7.4.8.3. Vietnam Virtual Tour Market Size and Forecast, By Application (2025-2032)
7.4.9. Thailand
7.4.9.1. Thailand Virtual Tour Market Size and Forecast, By Type (2025-2032)
7.4.9.2. Thailand Virtual Tour Market Size and Forecast, By Technology (2025-2032)
7.4.9.3. Thailand Virtual Tour Market Size and Forecast, By Application (2025-2032)
7.4.10. Philippines
7.4.10.1. Philippines Virtual Tour Market Size and Forecast, By Type (2025-2032)
7.4.10.2. Philippines Virtual Tour Market Size and Forecast, By Technology (2025-2032)
7.4.10.3. Philippines Virtual Tour Market Size and Forecast, By Application (2025-2032)
7.4.11. Rest of Asia Pacific
7.4.11.1. Rest of Asia Pacific Virtual Tour Market Size and Forecast, By Type (2025-2032)
7.4.11.2. Rest of Asia Pacific Virtual Tour Market Size and Forecast, By Technology (2025-2032)
7.4.11.3. Rest of Asia Pacific Virtual Tour Market Size and Forecast, By Application (2025-2032)
8. Middle East and Africa Virtual Tour Market Size and Forecast by Segmentation (by Value in USD Billion) (2025-2032)
8.1. Virtual Tour Market Middle East and Africa Market Size and Forecast, By Technology (2025-2032)
8.2. Middle East and Africa Virtual Tour Market Size and Forecast, By Application (2025-2032)
8.3. Middle East and Africa Virtual Tour Market Size and Forecast, by Country (2025-2032)
8.3.1. South Africa
8.3.1.1. South Africa Virtual Tour Market Size and Forecast, By Type (2025-2032)
8.3.1.2. South Africa Virtual Tour Market Size and Forecast, By Technology (2025-2032)
8.3.1.3. South Africa Virtual Tour Market Size and Forecast, By Application (2025-2032)
8.3.2. GCC
8.3.2.1. GCC Virtual Tour Market Size and Forecast, By Type (2025-2032)
8.3.2.2. GCC Virtual Tour Market Size and Forecast, By Technology (2025-2032)
8.3.2.3. GCC Virtual Tour Market Size and Forecast, By Application (2025-2032)
8.3.3. Nigeria
8.3.3.1. Nigeria Virtual Tour Market Size and Forecast, By Type (2025-2032)
8.3.3.2. Nigeria Virtual Tour Market Size and Forecast, By Technology (2025-2032)
8.3.3.3. Nigeria Virtual Tour Market Size and Forecast, By Application (2025-2032)
8.3.4. Rest of ME&A
8.3.4.1. Rest of ME&A Virtual Tour Market Size and Forecast, By Type (2025-2032)
8.3.4.2. Rest of ME&A Virtual Tour Market Size and Forecast, By Technology (2025-2032)
8.3.4.3. Rest of ME&A Virtual Tour Market Size and Forecast, By Application (2025-2032)
9. South America Lubricants Market Size and Forecast by Segmentation (by Value in USD Billion) (2025-2032)
9.1. South America Virtual Tour Market Size and Forecast, By Type (2025-2032)
9.2. South America Virtual Tour Market Size and Forecast, By Technology (2025-2032)
9.3. South America Virtual Tour Market Size and Forecast, By Application (2025-2032)
9.4. South America Virtual Tour Market Size and Forecast, by Country (2025-2032)
9.4.1. Brazil
9.4.1.1. Brazil Virtual Tour Market Size and Forecast, By Type (2025-2032)
9.4.1.2. Brazil Virtual Tour Market Size and Forecast, By Technology (2025-2032)
9.4.1.3. Brazil Virtual Tour Market Size and Forecast, By Application (2025-2032)
9.4.2. Argentina
9.4.2.1. Argentina Virtual Tour Market Size and Forecast, By Type (2025-2032)
9.4.2.2. Argentina Virtual Tour Market Size and Forecast, By Technology (2025-2032)
9.4.2.3. Argentina Virtual Tour Market Size and Forecast, By Application (2025-2032)
9.4.3. Rest of South America
9.4.3.1. Rest of South America Virtual Tour Market Size and Forecast, By Type (2025-2032)
9.4.3.2. Rest of South America Virtual Tour Market Size and Forecast, By Technology (2025-2032)
9.4.3.3. Rest of South America Virtual Tour Market Size and Forecast, By Application (2025-2032)
10. Company Profile: Key Players
10.1. The Ricoh company (Japan)
10.1.1. Company Overview
10.1.2. Business Portfolio
10.1.3. Financial Overview
10.1.4. SWOT Analysis
10.1.5. Strategic Analysis
10.1.6. Recent Developments
10.2. PanoRama (Mexico)
10.3. Real Tour Vision (US)
10.4. Concept3D (US)
10.5. Blue Raven Studios (US)
10.6. EyeSpy360 (US)
10.7. Zillow 3D Home (US)
10.8. Matterport, Inc. (US)
10.9. I Staging (US)
10.10. CloudPano (US)
10.11. 3DVista (Germany)
10.12. 360 Imagery (UK)
10.13. Pan 3Sixty (UK)
10.14. Metareal (UK)
10.15. Klapty (Netherlands)
10.16. Roundme (France)
10.17. 360 Pano VR Solutions (India)
10.18. Starts360 (India)
10.19. MI 360 (China)
10.20. Exsight360 (Philippines)
10.21. Pixelfish (Australia)
10.22. Next VR (UAE)
10.23. VR Vision (Saudi Arabia)
10.24. 360Vista (Qatar)
10.25. Immerse ME (UAE)
10.26. Virtual Trauma (Brazil)
10.27. Afri360 (South Africa)
10.28. Egypt 360 Tours (Egypt)
11. Key Findings
12. Analyst Recommendations
13. Virtual Tour Market: Research Methodology