UV Coatings Market Global Industry Analysis and Forecast (2026-2032) by Composition, Formulation, Resin, Substrate, End-Use Industry, and Region.
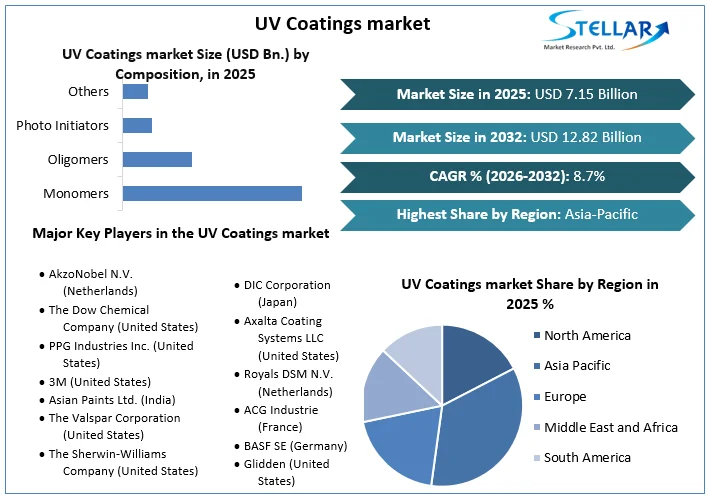
UV Coatings market size was valued at US$ 7.15 Billion in 2025 and the UV Coatings Market revenue is expected to grow at 8.70% through 2026 to 2032, reaching nearly US$ 12.82 Billion.
UV Coatings Market Overview:
A UV coating (or, more broadly, radiation cured coating) is a surface treatment that either cures or protects the underlying material from the detrimental effects of ultraviolet radiation. The rising construction industry, as well as consumer awareness of eco-friendly products, are the primary drivers of this industry's growth. Another major factor is that it outperforms other coatings in terms of performance. A formulation of many ingredients is toughened by ultraviolet radiation, which creates free radicals, which then initiates the light-induced polymerization process of the reactive double bonds in the coating formulation, resulting in UV cured coating. The global report on UV Coatings Market provides the segment analysis based on the basis of composition, formulation, resin, substrate, end use industry and region. while doing the market study and analysis we have considered end use industries as Aerospace & Defense, Automotive, Construction, Industrial, Electronics, Textile, Printing, Architecture, Food & Beverage, Marine, Graphic Arts, Packaging, Consumer Goods and Others.
To get more Insights: Request Free Sample Report
This is a type of surface treatment that may be applied to a wide range of substrates, including plastic, paper, glass, wood, metals, and more. The use of 100% solids UV, which are a combination of monomers, oligomers, and photoinitiators that do not require carrier fluids to flash throughout the drying and curing process, is becoming more popular. UV coatings are known for their outstanding features, which include a glossy finish, great clarity, quick-drying, abrasion resistance, adaptability, and speed of drying. Because of these features, they are finding new uses in a variety of industries.
UV Coatings Market Dynamics:
Raising Environmental Awareness:
The businesses must comply with stringent rules and regulations relating to air pollution, waste disposal, and safety and health which leads the UV coatings market growth. UV coatings technology has two key advantages that have led to its designation as "green." To begin with, most UV coating formulations are devoid of large amounts of volatile organic compounds (VOCs) or dangerous air pollutants (HAPs). Second, the energy required to dry a UV coating is significantly less than that required to dry a traditional solvent or even a water-based coating.
Because fossil fuels account for a large portion of global energy production, lowering energy consumption equates to lowering greenhouse gas emissions. Businesses may rely on UV coatings as an essential tool to help decrease their environmental footprint by decreasing both air pollution and overall greenhouse gas emissions, especially as new measures to limit greenhouse gas emissions loom on the horizon. During the forecast period, this has a favorable impact on the UV Coatings Market.
Smart Coatings:
In this sector, plenty of research initiatives is targeted at developing new and improved functions. Nanotechnology is crucial in this regard. Typically, filled nanocapsules are added to self-healing coatings. These nanocapsules release polymerizable chemicals into the fillers that self-repair if the coating is physically disturbed or destroyed. During the pandemic, there was an increased need for biocidal coatings. The coatings are still being researched to make them resistant to a wide spectrum of microorganisms. All of these variables have the potential to considerably drive market growth.
High cost of UV Coating:
When compared to other coating processes, UV coatings are more expensive. As a result, traditional coating procedures are used instead, which are less expensive. UV coating, on the other hand, is more efficient and uses less energy. Because the substrate is not exposed to high temperatures, it enables a high degree of crosslinking on temperature-sensitive items. The procedure is almost instantaneous, and the equipment takes up less room. UV coatings are the most expensive green coatings on the market, costing more than US $18000 a tonne. This factor may limit the UV coatings market growth.
UV Coatings Market Segmentation:
Based on Composition:
In 2025, the monomers segment had the highest market share of the UV coatings market, accounting for more than 40%. Monomers are molecules with a low molecular weight that reduce the viscosity of a solution. They're also non-flammable and have a mild odor. Acrylic acid esters and simple monofunctional/multifunctional polyols are examples of monomers.
The functionality of the monomer has a big impact on the cured coating's qualities. Monomers are often chosen based on the acrylic functional groups they contain. Monomer mixtures are commonly used to improve the performance of a product. During the forecast period, all of these factors may drive the monomer segment of the UV coatings market.

Based on Formulation:
In 2025, the water-based coatings segment accounted for more than 38% of the UV coatings market. The fundamental reason for this is that water-based UV coatings may be cleaned with water instead of using costly chemicals. Water-based coatings are also popular thanks to their lack of flammability. Coating technology market prospects reflect environmental concerns and, as a result, are governed by legislation.
According to the regulations, the market share of solvent-based coatings is continuously dropping, while the market share of alternative environmentally friendly coatings, particularly water-based coatings, is steadily growing. During the forecast period, this tendency is likely to continue. Water-based coatings are becoming more popular in the automotive sector. Because UV coatings cure quickly, they are used as filler primers. Water-based UV coatings can also coat 3D objects due to their physical drying. Water-based coatings have benefited from the Deco paint directive in Europe and regulatory restrictions in North America.
Based on Resin:
Polyesters, epoxies, urethanes, silicones, and acrylates are just a few of the UV-curable resins on the UV coatings market. The majority of these resins are acrylic-functionalized free-radical curing oligomers that cure in a couple of seconds. Acrylic resins are resistant to hydrolysis, weathering, and glare. They can also coat solutions with a lot of colors. Acrylic coatings are mostly used in the construction industry for high-finishing in rods, bridges, floors, decks, and other surfaces.
Acrylic-based coatings are also used on marine vessels and buildings, machinery, and other metal products. These resins are used to minimize VOC emissions in water-based paints. UV resins have grown in popularity as a result of their high productivity, simplicity of application, and low environmental impact. They're frequently used when quick drying and curing are required. As a result of all of these reasons, the acrylic segment is likely to grow by 8.50% over the forecast period.
Detailed analysis of each segment mentioned in the scope table is covered in the SMR’s report.
UV Coatings Market Regional Insights:
Thanks to the region's construction industries, the Asia-Pacific region held a 42% share of the UV coatings market in 2025. The automotive industry is another element driving the growth of the UV coatings market in this region. Japan's, India's, China's, and Malaysia's economies are rapidly industrializing and urbanizing. The building & construction industry in India is the backbone of the economy. Between April 2000 and December 2020, FDIs in the construction development industry and construction activities totaled US $25.93 billion and US $23.99 billion, respectively, according to the Indian Department for Promotion of Industry and Internal Trade (DPIIT).
Even in the face of the pandemic, the Asia Pacific region has continued to grow. In terms of volume, China has surpassed the United States as the world's largest coatings market. In the foreseeable term, all of these growth tendencies are expected to continue.
The objective of the report is to present a comprehensive analysis of the UV Coatings Market to the stakeholders in the industry. The report provides trends that are most dominant in the UV Coatings Market and how these trends will influence new business investments and market development throughout the forecast period. The report also aids in the comprehension of the UV Coatings Market dynamics and competitive structure of the market by analyzing market leaders, market followers, and regional players.
The qualitative and quantitative data provided in the UV Coatings Market report is to help understand which market segments, regions are expected to grow at higher rates, factors affecting the market, and key opportunity areas, which will drive the industry and market growth through the forecast period. The report also includes the competitive landscape of key players in the industry along with their recent developments in the market. The report studies factors such as company size, market share, market growth, revenue, production volume, and profits of the key players in the market.
The report provides Porter's Five Force Model, which helps in designing the business strategies in the market. The report helps in identifying how many rivals are existing, who they are, and how their product quality is in the Market. The report also analyses if the UV Coatings Market is easy for a new player to gain a foothold in the market, do they enter or exit the market regularly if the market is dominated by a few players, etc.
The report also includes a PESTEL Analysis, which aids in the development of company strategies. Political variables help in figuring out how much a government can influence the Market. Economic variables aid in the analysis of economic performance drivers that have an impact on the Market. Understanding the impact of the surrounding environment and the influence of environmental concerns on the UV Coatings Market is aided by legal factors.
UV Coatings Market Scope:
|
UV Coating Market |
|
|
Market Size in 2025 |
USD 7.15 Bn. |
|
Market Size in 2032 |
USD 12.82 Bn. |
|
CAGR (2026-2032) |
8.70 % |
|
Historic Data |
2020-2025 |
|
Base Year |
2025 |
|
Forecast Period |
2026-2032 |
|
Segment Scope |
By Composition
|
|
By Formulation
|
|
|
By Resin
|
|
|
By Substrate
|
|
|
|
By End-Use Industry • Aerospace & Defense • Automotive • Construction • Industrial • Electronics • Textile • Printing • Architecture • Food & Beverage • Marine • Graphic Arts • Packaging • Consumer Goods • Others |
|
Regional Scope |
North America- United States, Canada, and Mexico Europe – UK, France, Germany, Italy, Spain, Sweden, Austria, and Rest of Europe Asia Pacific – China, India, Japan, South Korea, Australia, ASEAN, Rest of APAC Middle East and Africa - South Africa, GCC, Egypt, Nigeria, Rest of the Middle East and Africa South America – Brazil, Argentina, Rest of South America |
UV Coatings Market Players:
- AkzoNobel N.V. (Netherlands)
- The Dow Chemical Company (United States)
- PPG Industries Inc. (United States)
- 3M (United States)
- Asian Paints Ltd. (India)
- The Valspar Corporation (United States)
- The Sherwin-Williams Company (United States)
- DIC Corporation (Japan)
- Axalta Coating Systems LLC (United States)
- Royals DSM N.V. (Netherlands)
- ACG Industrie (France)
- BASF SE (Germany)
- Glidden (United States)
- Others
Regional Breakdown:
North America UV Coatings Market: Emerging Opportunities and Market Forecast (2024-2030)
Europe UV Coatings Market: Growth Potential and Industry Analysis (2024-2030)
Frequently Asked Questions
The European region has the highest growth rate in the UV Coatings market.
AkzoNobel N.V. (Netherlands), The Dow Chemical Company (United States), PPG Industries Inc. (United States), 3M (United States), Asian Paints Ltd. (India), The Valspar Corporation (United States), The Sherwin-Williams Company (United States), DIC Corporation (Japan), Axalta Coating Systems LLC (United States), Royals DSM N.V. (Netherlands), ACG Industrie (France), BASF SE (Germany), Glidden (United States), and Others are the top players in the UV Coatings market.
The Asia Pacific region held almost 42% of the overall market share.
1. UV Coatings Market: Research Methodology
1.1. Research Data
1.1.1. Primary Data
1.1.2. Secondary Data
1.2. Market Size Estimation
1.2.1. Top-Down Approach
1.2.2. Bottom-Up Approach
1.3. Research Assumptions
2. UV Coatings Market Introduction
2.1. Study Assumption and Market Definition
2.2. Scope of the Study
2.3. Executive Summary
3. Global UV Coatings Market: Competitive Landscape
3.1. SMR Competition Matrix
3.2. Key Players Benchmarking
3.2.1. Company Name
3.2.2. Product Segment
3.2.3. End-user Segment
3.2.4. Revenue (2025)
3.2.5. Company Headquarter
3.3. Market Structure
3.3.1. Market Leaders
3.3.2. Market Followers
3.3.3. Emerging Players
3.4. Mergers and Acquisitions Details
4. UV Coatings Market: Dynamics
4.1. Trends
4.2. Drivers
4.3. Restraints
4.4. Opportunities
4.5. Challenges
4.6. PORTER’s Five Forces Analysis
4.7. PESTLE Analysis
4.8. Technological Roadmap
4.9. Value Chain Analysis
4.10. Ecosystem Mapping
4.10.1. Upstream
4.10.2. Downstream
4.10.2.1. Regulatory Bodies
4.11. Regulatory Landscape by Region
4.11.1. North America
4.11.2. Europe
4.11.3. Asia Pacific
4.11.4. Middle East and Africa
4.11.5. South America
5. Global UV Coatings Market: Global Market Size and Forecast (Value in USD Million) (2025-2032)
5.1. Global UV Coatings Market Size and Forecast, By Composition (2025-2032)
5.1.1. Monomers
5.1.2. Oligomers
5.1.3. Photo Initiators
5.1.4. Others
5.2. Global UV Coatings Market Size and Forecast, By Formulation (2025-2032)
5.2.1. Solids
5.2.2. Water-based
5.2.3. Solvent-based
5.3. Global UV Coatings Market Size and Forecast, By Resin (2025-2032)
5.3.1. Acrylic
5.3.2. Polyester
5.3.3. Polyurethane
5.3.4. Silicone
5.3.5. Epoxy
5.3.6. Others
5.4. Global UV Coatings Market Size and Forecast, By Substrate (2025-2032)
5.4.1. Paper
5.4.2. Wood
5.4.3. Glass
5.4.4. Plastic
5.4.5. Metals
5.4.6. Others
5.5. Global UV Coatings Market Size and Forecast, By End-Use Industry (2025-2032)
5.5.1. Aerospace & Defense
5.5.2. Automotive
5.5.3. Construction
5.5.4. Industrial
5.5.5. Electronics
5.5.6. Textile
5.5.7. Printing
5.5.8. Architecture
5.5.9. Food & Beverage
5.5.10. Marine
5.5.11. Graphic Arts
5.5.12. Packaging
5.5.13. Consumer Goods
5.5.14. Others
5.6. Global UV Coatings Market Size and Forecast, By Region (2025-2032)
5.6.1. North America
5.6.2. Europe
5.6.3. Asia Pacific
5.6.4. Middle East and Africa
5.6.5. South America
6. North America UV Coatings Market Size and Forecast by Segmentation (Value in USD Million) (2025-2032)
6.1. North America UV Coatings Market Size and Forecast, By Composition (2025-2032)
6.1.1. Monomers
6.1.2. Oligomers
6.1.3. Photo Initiators
6.1.4. Others
6.2. North America UV Coatings Market Size and Forecast, By Formulation (2025-2032)
6.2.1. Solids
6.2.2. Water-based
6.2.3. Solvent-based
6.3. North America UV Coatings Market Size and Forecast, By Resin (2025-2032)
6.3.1. Acrylic
6.3.2. Polyester
6.3.3. Polyurethane
6.3.4. Silicone
6.3.5. Epoxy
6.3.6. Others
6.4. North America UV Coatings Market Size and Forecast, By Substrate (2025-2032)
6.4.1. Paper
6.4.2. Wood
6.4.3. Glass
6.4.4. Plastic
6.4.5. Metals
6.4.6. Others
6.5. North America UV Coatings Market Size and Forecast, By End-Use Industry (2025-2032)
6.5.1. Aerospace & Defense
6.5.2. Automotive
6.5.3. Construction
6.5.4. Industrial
6.5.5. Electronics
6.5.6. Textile
6.5.7. Printing
6.5.8. Architecture
6.5.9. Food & Beverage
6.5.10. Marine
6.5.11. Graphic Arts
6.5.12. Packaging
6.5.13. Consumer Goods
6.5.14. Others
6.6. North America UV Coatings Market Size and Forecast, by Country (2025-2032)
6.6.1. United States
6.6.2. Canada
6.6.3. Mexico
7. Europe UV Coatings Market Size and Forecast by Segmentation (Value in USD Million) (2025-2032)
7.1. Europe UV Coatings Market Size and Forecast, By Composition (2025-2032)
7.2. Europe UV Coatings Market Size and Forecast, By Formulation (2025-2032)
7.3. Europe UV Coatings Market Size and Forecast, By Resin (2025-2032)
7.4. Europe UV Coatings Market Size and Forecast, By Substrate (2025-2032)
7.5. Europe UV Coatings Market Size and Forecast, By End-Use Industry (2025-2032)
7.6. Europe UV Coatings Market Size and Forecast, by Country (2025-2032)
7.6.1. United Kingdom
7.6.2. France
7.6.3. Germany
7.6.4. Italy
7.6.5. Spain
7.6.6. Sweden
7.6.7. Russia
7.6.8. Rest of Europe
8. Asia Pacific UV Coatings Market Size and Forecast by Segmentation (Value in USD Million) (2025-2032)
8.1. Asia Pacific UV Coatings Market Size and Forecast, By Composition (2025-2032)
8.2. Asia Pacific UV Coatings Market Size and Forecast, By Formulation (2025-2032)
8.3. Asia Pacific UV Coatings Market Size and Forecast, By Resin (2025-2032)
8.4. Asia Pacific UV Coatings Market Size and Forecast, By Substrate (2025-2032)
8.5. Asia Pacific UV Coatings Market Size and Forecast, By End-Use Industry (2025-2032)
8.6. Asia Pacific UV Coatings Market Size and Forecast, by Country (2025-2032)
8.6.1. China
8.6.2. S Korea
8.6.3. Japan
8.6.4. India
8.6.5. Australia
8.6.6. ASEAN
8.6.7. Rest of Asia Pacific
9. Middle East and Africa UV Coatings Market Size and Forecast by Segmentation (Value in USD Million) (2025-2032)
9.1. Middle East and Africa UV Coatings Market Size and Forecast, by Composition (2025-2032)
9.2. Middle East and Africa UV Coatings Market Size and Forecast, By Formulation (2025-2032)
9.3. Middle East and Africa UV Coatings Market Size and Forecast, By Resin (2025-2032)
9.4. Middle East and Africa UV Coatings Market Size and Forecast, By Substrate (2025-2032)
9.5. Middle East and Africa UV Coatings Market Size and Forecast, By End-Use Industry (2025-2032)
9.6. Middle East and Africa UV Coatings Market Size and Forecast, by Country (2025-2032)
9.6.1. South Africa
9.6.2. GCC
9.6.3. Nigeria
9.6.4. Rest of ME&A
10. South America UV Coatings Market Size and Forecast by Segmentation (Value in USD Million) (2025-2032)
10.1. South America UV Coatings Market Size and Forecast, By Composition (2025-2032)
10.2. South America UV Coatings Market Size and Forecast, By Formulation (2025-2032)
10.3. South America UV Coatings Market Size and Forecast, By Resin (2025-2032)
10.4. South America UV Coatings Market Size and Forecast, By Substrate (2025-2032)
10.5. South America UV Coatings Market Size and Forecast, By End-Use Industry (2025-2032)
10.6. South America UV Coatings Market Size and Forecast, by Country (2025-2032)
10.6.1. Brazil
10.6.2. Argentina
10.6.3. Rest Of South America
11. Company Profile: Key Players
11.1. AkzoNobel N.V. (Netherlands)
11.1.1. Company Overview
11.1.2. Business Portfolio
11.1.3. Financial Overview
11.1.3.1. Total Revenue
11.1.3.2. Segment Revenue
11.1.3.3. Regional Revenue
11.1.4. SWOT Analysis
11.1.5. Strategic Analysis
11.1.6. Recent Developments
11.2. The Dow Chemical Company (United States)
11.3. PPG Industries Inc. (United States)
11.4. 3M (United States)
11.5. Asian Paints Ltd. (India)
11.6. The Valspar Corporation (United States)
11.7. The Sherwin-Williams Company (United States)
11.8. DIC Corporation (Japan)
11.9. Axalta Coating Systems LLC (United States)
11.10. Royals DSM N.V. (Netherlands)
11.11. ACG Industrie (France)
11.12. BASF SE (Germany)
11.13. Glidden (United States)
11.14. Others
12. Key Findings
13. Industry Recommendations