Soft Drinks Market Industry Analysis and Forecast (2026-2032)
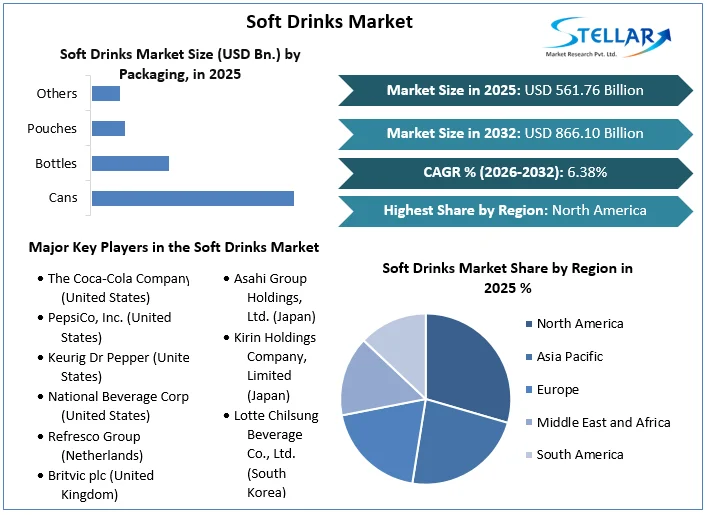
The Soft Drinks Market size was valued at USD 561.76 Bn. in 2025 and the total Global Soft Drinks revenue is expected to grow at a CAGR of 6.38% from 2026 to 2032, reaching nearly USD 866.10 Bn. by 2032.
Soft Drinks Market Overview:
The soft drinks industry faced a challenging year in 2025, as sharply increasing retail prices led to flat or declining volumes in key mature markets including America and Europe. This trend highlights the global challenge of balancing volume growth with profitability, especially amidst commitments to sustainability and public health. However, amidst these challenges, value-seeking consumers demonstrated new behaviors, favoring regional value brands and discounter channels over private labels.
Price inflation in the Americas and Europe in 2022 and the first half of 2023 pushed consumers to cut back, but this did not result in an instant increase in private-label drinks. Instead, locally created and regional B-brands have benefited when big international companies raise prices and limit package mix. Hard discounter chains and warehouse clubs have also taken advantage, driving impulse-driven sectors such as energy drinks and sports drinks to modify their available SKUs.
Social media and digital marketing emerged as crucial platforms for engaging consumers, particularly younger demographics, with digitally native products and viral campaigns making a significant impact on the global soft drinks market. Furthermore, the industry witnessed a shift towards embracing flavored ready-to-drink (RTD) and co-branded alcoholic beverages, with major players like Coca-Cola and PepsiCo investing in alcohol distribution capacity. Despite these shifts, functional drinks, particularly energy and hydration beverages, remained central to growth, with innovation accelerating across format types to meet evolving consumer preferences.
Energy drinks remain the fastest-growing segment of non-alcoholic beverages, with a fresh wave of innovation in improved hydration beverages. Non-RTD forms (powder mixes and tablets) and high electrolyte oral replenishment solutions are gaining market share from traditional sports drinks. Sports nutrition and supplement organizations are developing a strong presence in energy drinks.
In 2024, the soft drinks industry is expected to be shaped by several key trends that reflect evolving consumer preferences and market dynamics. Key among these is the emphasis on value maximization, as consumers seek products that offer both affordability and functionality. This trend is driven by the lingering effects of economic challenges, with consumers prioritizing cost-effectiveness without compromising on quality or health benefits. Functional ingredients continue to gain prominence, with a focus on enhancing mental and physical well-being. Brands are responding by offering tailored beverages that cater to specific needs, such as stress management or gut health.
Furthermore, sustainability remains a critical focus area, with consumers increasingly seeking products that align with their ethical and environmental values. This drives demand for transparent, eco-friendly packaging and responsibly sourced ingredients. Additionally, the influence of artificial intelligence (AI) on social media and content creation is reshaping consumer engagement and brand communication strategies, supporting the soft drinks market to grow significantly.
To get more Insights: Request Free Sample Report
India: Lucrative Region for Soft Drinks Manufacturers, Vendors, Key Players, and Investors
“India” is expected to be the potential region for the soft drinks market players during the forecast period. Thanks to evolving consumer preferences, innovative product offerings, and increasing disposable incomes, the India soft drinks industry witnessed significant growth recently. The growing health consciousness among consumers is shifting demand towards beverages that are high in nutritional value and low in sugar and calories. This diverse market includes carbonated soft drinks, energy drinks, flavored water, and fruit juices.
According to MMR analysis, despite being the world’s second-most populous country, India’s per capita consumption of soft drinks remains low at just 12 liters, compared to 79 liters in China and 359 liters in the USA in 2023. India’s per capita annual sales of 21.36 liters in 2018 are much lower than per capita sales in other developing countries like the Philippines which stood at 111.89 liters and Vietnam at about 69.75 liters in the same year. Meanwhile, India’s revenue per person from the sale of such beverages was estimated at USD 8.89 in 2019, much lower compared to markets such as USD 1,030 in the US and USD 67.05 in China.
The sector is also heavily taxed to deter consumers from excessive consumption of sugary beverages. Most non-alcoholic beverages are taxed at a standard rate of 12-18% or the highest rate of 28%. These key findings indicate significant potential for growth, especially due to the affordability of these beverages. The low consumption base suggests ample opportunity for increasing the frequency of consumption, which is expected to drive robust volume growth during the forecast period. The Indian soft drinks market is expected to grow at a CAGR of 10.35% from 2025-2032, according to MMR analysis.
The non-carbonated soft drink segment, including fruit juices and flavored water, is growing at a rate three times faster than carbonated drinks, reflecting the shift towards healthier options. The energy drink segment is also poised for remarkable growth, with a projected CAGR of 42% and an estimated market size of INR 100 billion by 2027. Both premium and affordable segments are witnessing strong growth, indicating broad-based market growth.
The juice market in India is estimated to be worth INR 243.7 billion in 2023 and is expected to achieve double-digit growth in India's soft drinks market during the forecast period. The Flavored Water segment is experiencing substantial growth, with projected CAGRs of XX% in volume and XX% in value terms. Key drivers include rising consumer awareness about water-borne diseases, declining water quality in rural and semi-urban areas, continuous introduction of new flavors, and increasing availability across various retail formats.
Varun Beverages, a strategic franchisee partner of PepsiCo in India, exemplifies the industry’s growth potential. With franchise rights in several countries, Varun Beverages is expanding its product portfolio to include low-calorie and zero-sugar options in carbonated soft drinks, along with non-seasonal products like juices and sports drinks. The company recycles 80% of its plastic waste, aiming for 100% by CY25. Over the period 2022-2024, Varun Beverages is expected to deliver revenue and EBITDA CAGRs of 19.5% and 22.1%, respectively, driven by cost efficiencies, leverage benefits, and enhanced asset utilization. These all factors collectively benefit the India soft drinks market size growth during the forecast period.
Soft Drinks Market Segment Analysis:
High consumption of carbonated soft drinks with a wide range of flavors, supports the global soft drinks industry
Based on Product Type, the Carbonated Soft Drinks (CSD) segment held the largest market share in terms of both value and volume and dominated the global soft drinks market in 2025. The segment is further expected to grow at a CAGR of 6.20% during the forecast period. Carbonated soft drinks are experiencing notable shifts in consumer preferences and consumption patterns, driven by evolving health consciousness, demographic dynamics, and changing market landscapes. While traditional CSD consumption remains ingrained in certain segments, younger and health-focused consumers are spearheading a demand for healthier alternatives and diverse flavor offerings.
The increasing desire for healthier consumption among consumers is expected to be the major factor driving the CDS demand all across the world, thereby supporting the soft drinks market revenue growth. This is evidenced by a decline in CSD consumption frequency, particularly among younger generations, who are gravitating towards sparkling juices and healthier beverage options. Concerns over the perceived unhealthiness of CSD, primarily due to sugar content, are prompting consumers to seek reduced sugar and caffeine-free variants. Health-conscious claims such as GMO-free, vegan, and organic are witnessing growth, reflecting consumers' growing preference for cleaner and more natural ingredients.
Despite these shifts, taste remains a primary driver of CSD consumption, with consumers indulging in CSD throughout the day, from lunch to dinner. To cater to evolving consumer preferences, manufacturers are diversifying their product portfolios, introducing low- and zero-calorie variants, and incorporating natural sweeteners and flavorings. Fruit-flavored sodas, in particular, are expected to witness significant growth, fueled by their alignment with health-conscious trends and consumer demand for diverse taste options.
Additionally, collaborative initiatives and innovative marketing strategies are playing a crucial role in rejuvenating consumer interest in CSD. Collaborations with nostalgic and aspirational brands, as well as digital experiences, are capturing the attention of younger consumers and driving consumption. Furthermore, regulatory measures aimed at reducing sugar consumption, such as taxes on sugary beverages and labeling requirements, are shaping the soft drinks market landscape and influencing consumer behavior.
Soft Drinks Market Regional Analysis:
The United States remains the dominant market in the North America soft drinks industry
North America led the global soft drinks market with the highest share in terms of both value and volume in 2025 and is expected to grow at a significant CAGR during the forecast period. The United States and Canada are positively benefiting the North American soft drinks market revenue growth thanks to the growing production of drinks and investments in developing manufacturing assembly lines and packaging technology. In addition, the presence of globally known brands such as PepsiCo and Coca-Cola in the region is expected to drive the soft drinks industry demand in North America during the forecast period.
The United States is a major global consumer of soft drinks, with a substantial portion of the population regularly enjoying these beverages. The country’s dominance is further led by prominent brands like Coca-Cola, PepsiCo, and Dr. Pepper Snapple Group, which offer a wide range of products catering to diverse consumer preferences. Shifts in consumer lifestyles have significantly influenced the United States soft drinks market. The demand for convenient, on-the-go beverage options has risen, with bottled water, energy drinks, and ready-to-drink teas and coffees meeting these needs.
To maintain consumer interest, soft drink companies continually innovate, introducing new flavors, variations, and packaging designs. This continuous innovation drives soft drinks industry growth by attracting a broader consumer base. In addition, rising disposable income levels also positively impact the soft drinks market. With greater purchasing power, consumers are more inclined to spend on beverages, incorporating them into their daily routines and social activities. Additionally, technological advancements have revolutionized manufacturing processes, packaging solutions, and distribution channels. These improvements enhance operational efficiency, product quality, and market reach.
The top five soft drink companies in the US in 2021 by volume are The Coca-Cola Co, PepsiCo Inc., BlueTriton Brands, Keurig D. Pepper Inc., and Walmart Inc., with a cumulative volume of 87,730 million liters. The Coca-Cola Co. with 27,895 million liters, followed by PepsiCo Inc. with 19,297 million liters, and BlueTriton Brands with 12,859 million liters. The Coca-Cola Co. reported revenues of $43,004 million for FY2022, marking an 11.3% increase over FY2021.
It operates multiple plants and warehouses, along with 1,600 leased retail stores, and employs 82,500 people. PepsiCo Inc, another top soft drink company, reported revenues of $86,392 million for FY2022, up by 8.7% from FY2021, with a global presence spanning over 200 countries and territories and employing 309,000 people. Both companies are engaged in manufacturing, distributing, and marketing a wide range of non-alcoholic beverages and food products, contributing significantly to the consumer packaged goods sector in the US and beyond.
Soft Drinks Market Scope:
|
Soft Drinks Market |
|
|
Market Size in 2025 |
USD 561.76 Billion |
|
Market Size in 2032 |
USD 866.10 Billion |
|
CAGR (2026-2032) |
6.38 % |
|
Historic Data |
2020-2025 |
|
Base Year |
2025 |
|
Forecast Period |
2026-2032 |
|
Segments Covered |
By Product Type Carbonated Soft Drinks Non-carbonated Soft Drinks Fruit Juices Flavored Water Energy Drinks Ready-to-Drinks (RTD) Others |
|
By Packaging Cans Bottles Pouches Others |
|
|
By Distribution Channels Offline Online |
|
|
Regional Scope |
North America- United States, Canada, and Mexico Europe – UK, France, Germany, Italy, Spain, Sweden, Russia, and Rest of Europe Asia Pacific – China, India, Japan, South Korea, Australia, ASEAN, Rest of APAC Middle East and Africa - South Africa, GCC, Rest of the Middle East and Africa South America – Brazil, Argentina, Rest of South America |
Key Players in the Soft Drinks Market
North America
- The Coca-Cola Company (United States)
- PepsiCo, Inc. (United States)
- Keurig Dr Pepper (United States)
- National Beverage Corp. (United States)
- Cott Corporation (Canada)
Europe
- Refresco Group (Netherlands)
- Britvic plc (United Kingdom)
- Eckes-Granini Group (Germany)
- Red Bull GmbH (Germany)
Asia Pacific
- Asahi Group Holdings, Ltd. (Japan)
- Kirin Holdings Company, Limited (Japan)
- Lotte Chilsung Beverage Co., Ltd. (South Korea)
- Fraser and Neave, Limited (Singapore)
- Suntory Holdings Limited (Japan)
Middle East & Africa
- Delta Corporation Limited (Zimbabwe)
- SABMiller Africa (South Africa)
South America
- Embotelladora Andina (Chile)
- AJE Group (Peru)
- Refres Now (Brazil)
Frequently Asked Questions
Emerging flavor trends include peach-inspired products, as influenced by the Pantone color of the year. Additionally, botanical flavors, exotic fruits, and herbal infusions are gaining popularity among consumers seeking unique taste experiences.
AI is transforming marketing and consumer engagement strategies in the soft drinks industry. Brands are leveraging AI-powered analytics to understand consumer preferences, personalize marketing campaigns, and enhance product development.
The soft drinks market is expected to continue evolving with a focus on innovation, sustainability, and health-consciousness. Emerging trends may include personalized nutrition, advanced functional ingredients, and further integration of digital technologies for consumer engagement.
The Soft Drinks Market size was valued at USD 561.76 Billion in 2025 and the total Global Soft Drinks revenue is expected to grow at a CAGR of 6.38% from 2026 to 2032, reaching nearly USD 866.10 Billion by 2032.
1. Soft Drinks Market: Research Methodology
2. Soft Drinks Market Introduction
2.1. Study Assumption and Market Definition
2.2. Scope of the Study
2.3. Executive Summary
3. Global Soft Drinks Market: Competitive Landscape
3.1. SMR Competition Matrix
3.2. Competitive Landscape
3.3. Key Players Benchmarking
3.3.1. Company Name
3.3.2. Headquarter
3.3.3. Product Segment
3.3.4. End-Users Segment
3.3.5. Revenue (2025)
3.3.6. Total Product Sold – By Volume 2025
3.3.7. Company Locations
3.4. Market Structure
3.4.1. Market Leaders
3.4.2. Market Followers
3.4.3. Emerging Players
3.5. Mergers and Acquisitions Details
3.6. Detailed Analysis of Key Players Marketing Channels
4. Soft Drinks Market: Consumer Behaviour Analysis
4.1. Detailed Buyers Preferences and Behavior Analysis
4.2. Buyers Purchasing Pattern Analysis
4.3. Detailed Analysis of Factors Influencing Consumer Purchasing Decisions
5. Soft Drinks Market: Dynamics
5.1. Soft Drinks Market Trends
5.2. Soft Drinks Market Dynamics
5.2.1. Soft Drinks Market Drivers
5.2.2. Soft Drinks Market Restraints
5.2.3. Soft Drinks Market Opportunities
5.2.4. Soft Drinks Market Challenges
5.3. PORTER’s Five Forces Analysis
5.4. PESTLE Analysis
5.5. Value Chain Analysis
5.6. Regulatory Landscape by Region
5.6.1. North America
5.6.2. Europe
5.6.3. Asia Pacific
5.6.4. Middle East and Africa
5.6.5. South America
5.7. Key Opinion Leader Analysis for the Soft Drinks Industry
6. Soft Drinks Market: Quantitative Analysis
6.1. Global Soft Drinks Production By Region
6.2. Per Capita Consumption of Soft Drinks By Region
6.3. Global Import-Export/ Trade Analysis – By Value and Volume (2025-2032)
6.4. Price Trend Analysis
7. Soft Drinks Market: Global Market Size and Forecast by Segmentation (by Value in USD Billion and Volume Units) (2025-2032)
7.1. Soft Drinks Market Size and Forecast, By Product Type (2025-2032)
7.1.1. Carbonated Soft Drinks
7.1.2. Non-carbonated Soft Drinks
7.1.2.1. Fruit Juices
7.1.2.2. Flavored Water
7.1.2.3. Energy Drinks
7.1.2.4. Ready-to-Drinks (RTD)
7.1.2.5. Others
7.2. Soft Drinks Market Size and Forecast, By Packaging (2025-2032)
7.2.1. Cans
7.2.2. Bottles
7.2.3. Pouches
7.2.4. Others
7.3. Soft Drinks Market Size and Forecast, By Distribution Channels (2025-2032)
7.3.1. Offline
7.3.2. Online
7.4. Soft Drinks Market Size and Forecast, by Region (2025-2032)
7.4.1. North America
7.4.2. Europe
7.4.3. Asia Pacific
7.4.4. Middle East and Africa
7.4.5. South America
8. North America Soft Drinks Market Size and Forecast by Segmentation (by Value in USD Billion and Volume Units) (2025-2032)
8.1. North America Soft Drinks Market Size and Forecast, By Product Type (2025-2032)
8.1.1. Carbonated Soft Drinks
8.1.2. Non-carbonated Soft Drinks
8.1.2.1. Fruit Juices
8.1.2.2. Flavored Water
8.1.2.3. Energy Drinks
8.1.2.4. Ready-to-Drinks (RTD)
8.1.2.5. Others
8.2. North America Soft Drinks Market Size and Forecast, By Packaging (2025-2032)
8.2.1. Cans
8.2.2. Bottles
8.2.3. Pouches
8.2.4. Others
8.3. North America Soft Drinks Market Size and Forecast, By Distribution Channels (2025-2032)
8.3.1. Offline
8.3.2. Online
8.4. North America Soft Drinks Market Size and Forecast, by Country (2025-2032)
8.4.1. United States
8.4.2. Canada
8.4.3. Mexico
9. Europe Soft Drinks Market Size and Forecast by Segmentation (by Value in USD Billion and Volume Units) (2025-2032)
9.1. Europe Soft Drinks Market Size and Forecast, By Product Type (2025-2032)
9.2. Europe Soft Drinks Market Size and Forecast, By Packaging (2025-2032)
9.3. Europe Soft Drinks Market Size and Forecast, By Distribution Channels (2025-2032)
9.4. Europe Soft Drinks Market Size and Forecast, by Country (2025-2032)
9.4.1. United Kingdom
9.4.2. France
9.4.3. Germany
9.4.4. Italy
9.4.5. Spain
9.4.6. Sweden
9.4.7. Russia
9.4.8. Rest of Europe
10. Asia Pacific Soft Drinks Market Size and Forecast by Segmentation (by Value in USD Billion and Volume Units) (2025-2032)
10.1. Asia Pacific Soft Drinks Market Size and Forecast, By Product Type (2025-2032)
10.2. Asia Pacific Soft Drinks Market Size and Forecast, By Packaging (2025-2032)
10.3. Asia Pacific Soft Drinks Market Size and Forecast, By Distribution Channels (2025-2032)
10.4. Asia Pacific Soft Drinks Market Size and Forecast, by Country (2025-2032)
10.4.1. China
10.4.2. S Korea
10.4.3. Japan
10.4.4. India
10.4.5. Australia
10.4.6. ASEAN
10.4.7. Rest of Asia Pacific
11. Middle East and Africa Soft Drinks Market Size and Forecast by Segmentation (by Value in USD Billion and Volume Units) (2025-2032)
11.1. Middle East and Africa Soft Drinks Market Size and Forecast, By Product Type (2025-2032)
11.2. Middle East and Africa Soft Drinks Market Size and Forecast, By Packaging (2025-2032)
11.3. Middle East and Africa Soft Drinks Market Size and Forecast, By Distribution Channels (2025-2032)
11.4. Middle East and Africa Soft Drinks Market Size and Forecast, by Country (2025-2032)
11.4.1. South Africa
11.4.2. GCC
11.4.3. Rest of ME&A
12. South America Soft Drinks Market Size and Forecast by Segmentation (by Value in USD Billion and Volume Units) (2025-2032)
12.1. South America Soft Drinks Market Size and Forecast, By Product Type (2025-2032)
12.2. South America Soft Drinks Market Size and Forecast, By Packaging (2025-2032)
12.3. South America Soft Drinks Market Size and Forecast, By Distribution Channel (2025-2032)
12.4. South America Soft Drinks Market Size and Forecast, by Country (2025-2032)
12.4.1. Brazil
12.4.2. Argentina
12.4.3. Rest Of South America
13. Company Profile: Key Players
13.1. The Coca-Cola Company (United States)
13.1.1. Company Overview
13.1.2. Business Portfolio
13.1.3. Financial Overview
13.1.4. SWOT Analysis
13.1.5. Strategic Analysis
13.1.6. Recent Developments
13.2. PepsiCo, Inc. (United States)
13.3. Keurig Dr Pepper (United States)
13.4. National Beverage Corp. (United States)
13.5. Cott Corporation (Canada)
13.6. Refresco Group (Netherlands)
13.7. Britvic plc (United Kingdom)
13.8. Eckes-Granini Group (Germany)
13.9. Red Bull GmbH (Germany)
13.10. Asahi Group Holdings, Ltd. (Japan)
13.11. Kirin Holdings Company, Limited (Japan)
13.12. Lotte Chilsung Beverage Co., Ltd. (South Korea)
13.13. Fraser and Neave, Limited (Singapore)
13.14. Suntory Holdings Limited (Japan)
13.15. Delta Corporation Limited (Zimbabwe)
13.16. SABMiller Africa (South Africa)
13.17. Embotelladora Andina (Chile)
13.18. AJE Group (Peru)
13.19. Refres Now (Brazil)
14. Key Findings
15. Analyst Recommendations