Silicon Photomultiplier Market Industry Overview (2026-2032) by Offering, Type, Application, End-User, and, Region
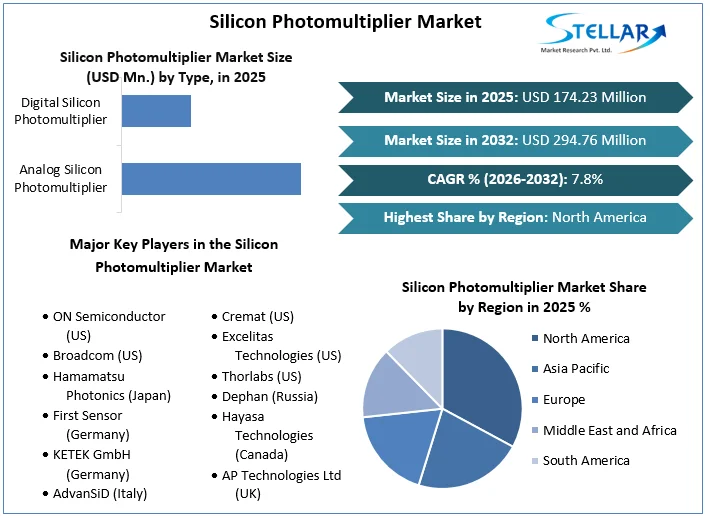
Silicon Photomultiplier Market size was valued at US$ 174.23 Million in 2025 and the total Silicon Photomultiplier revenue is expected to grow at 7.8% through 2026 to 2032, reaching nearly US$ 294.76 Million.
Silicon Photomultiplier Market Overview:
Large gain, reduced voltage functioning, perfect timing reliability, high sensitivity i.e. down to a specific photon, and tolerance to magnetic fields are all advantages of the SiPM. These qualities make it an excellent choice for light detecting applications ranging from single photons to thousands. SiPMs are small electronic devices that can endure physical shocks. Their maximum performance makes them ideal for a variety of photometry i.e. light detection purposes, particularly where accurate sequencing is required.
The analog SiPM is predicted to witness significant increases in single-photon temporal resolution, which is a popular topic of study right now. Photon detecting effectiveness in systems with huge single-photon avalanche cells has already surpassed 75%, and there is limited scope for further improvement in these devices. Nonetheless, research is trending in the direction of lower cell sizes in order to minimize associated distortion and the dynamic range of the SiPM. As a result, photon detection accuracy is still a work in progress, especially in gadgets with tiny cell sizes, where the functional fill factor is critical.
Further development into LIDAR systems with better detection sensitivity for photons in the red to the infrared range is ongoing. On the other hand, spectral band instruments are being enhanced for the measurement of UV light in the hunt for dark matter, which may also be used to monitor fluorescence in scintillators.
The market's growth drivers, as well as the market's segments (Offering, Type, Application, End-User, and, Region), are analyzed in this research. Market participants, regions, and special requirements have all provided data. This market study provides an in-depth look at all of the important advancements that are currently taking place across all industry sectors. Statistics, infographics, and presentations are used to provide key data analysis. The analysis looks at the market's Drivers, Restraints, Opportunities, and Challenges for the Silicon Photomultiplier market. The study aids in the evaluation of market growth drivers and the determination of how to employ these drivers as a tool. The research also aids in the correction and resolution of difficulties with the global Silicon Photomultiplier market.
To get more Insights: Request Free Sample Report
Silicon Photomultiplier Market Dynamics:
-
The rising applications of SiPM in light detection and ranging technologies are the primary drivers of the silicon photomultiplier market.
Vehicle parking, automated braking, and automatic braking bag deployments are all applications of LiDAR technology in autonomous cars. Ethical concerns, as a result of the rising various traffic accidents, have increased competition for this innovation. In areas where it has been applied in automobiles, this technology has had a huge influence. Because of its exceptional reduced illumination sensitivity and ability to create pictures with a large depth of focus, silicon photomultipliers are frequently utilized in LiDAR and mapping technologies. The resulting pictures are incomparable to any other photographic device's 2D images.
-
The key opportunity is the growing demand for radiation observation purposes.
Owing to the nuclear danger and the illicit commerce of nuclear products, several nations throughout the world are accelerating the building of their radiation detection systems across border crossings and maritime transport. Photomultipliers crystalline silicon is a crucial element of scintillation devices. To make perfect radiation sensing devices, they're combined with scintillation cells of various wavelengths over the spectrum of light. SiPMs, when paired with scintillation cells, have a high radiation susceptibility that allows them to detect even the tiniest quantities of radiation across a large region.
-
Silicon scarcity is expected to be the main challenge in the silicon photomultiplier market growth in the forecast period.
Semiconductors are used in a wide range of electrical devices, from automobiles to manufacturing gear to washers and cell phones. More than 150 sectors would be harmed by the worldwide chip deficit in 2020. The fundamental cause of the global chip shortage is the coronavirus outbreak's cascade impact. Chip manufacturing units in Japan and Korea were closed down due to lockdowns during the coronavirus outbreak, resulting in inventory decline. During the outbreak, more individuals studied and worked from home, resulting in increased demand for laptops, screens, connection accessories, and home media online services. This has placed a significant strain on the silicon supply chain, resulting in a significant gap between buyers and sellers of silicon chips throughout the world.
Silicon Photomultiplier Market Segment Analysis:
By Type, the digital silicon multiplier segment in the silicon photomultiplier market is expected to grow at a CAGR of 6.3% throughout the forecast period. Spacious capturing areas and excellent canny edge detection efficiency make digital silicon photomultipliers ideal for purposes like 3D imaging and Infrared Spectrometry. They're also applied in a variety of other industries, including diagnostic imaging and biological cell imaging. The signal-to-noise ratio of most photodiodes is greater than that necessary for cytometry purposes. The grouping of cells throughout bitmap analysis might be hampered by this extra noise.
By End-User, the consumer electronics segment is expected to grow at a CAGR of 7.1% in the forecast period. Over the last decade, the consumer electronics industry has experienced significant growth. The market for consumer electronics soared during the COVID-19 outbreak, resulting in a scarcity of silicon deposits. Silicon photomultipliers are essential in scintillation detectors and brightness detectors, among other measuring instruments. The silicon photomultiplier market in scintillation detectors for radioactivity detection and observation, as well as the growing need for SiPMs for submerged optical signals communication, is predicted to grow at a fast pace.
Silicon Photomultiplier Market Regional Insights:
In 2025, the silicon photomultiplier market was dominated by North America. SiPM has tremendous market potential in North America, with technology in healthcare, automobile, electronic goods and telecommunications, aviation, petroleum & gas, and other industries. In 2025, the United States spent the most on healthcare, accounting for 18.3% of total GDP. Photomultipliers made of silicon are used in scanning equipment such as PET scanners, X-ray equipment, and MRI devices. The costs of medical care drive up demand for medical gadgets and, as a consequence, silicon photomultipliers.
The purpose of this research is to provide stakeholders in the industry with a thorough insight into the Silicon Photomultiplier Market. The study includes an analysis of difficult data in simple language, as well as the industry's historical and current state, as well as anticipated market size and trends. The market report examines all segments of the industry, with a focus on significant players such as market leaders, followers, and new entrants. The report includes a PORTER, PESTEL analysis as well as the possible influence of microeconomic market determinants. External and internal elements that are expected to have a favorable or negative impact on the firm have been examined, providing decision-makers with a clear future vision of the industry. The research also aids in comprehending the Silicon Photomultiplier Market dynamics and structure by studying market segments and forecasting market size. The research is an investor's guide since it depicts the competitive analysis of major competitors in the market by product, price, financial situation, product portfolio, growth plans, and geographical presence.
Breakthroughs in the Silicon Photomultiplier industry are discussed, as well as organic and inorganic growth plans. Various companies are focusing on organic growth strategies such as new product releases, product approvals, and other items such as patents and events. Inorganic growth strategies used in the industry included acquisitions, partnerships, and collaborations.
Silicon Photomultiplier Market Scope:
|
Silicon Photomultiplier Market |
|
|
Market Size in 2025 |
USD 174.23 Million. |
|
Market Size in 2032 |
USD 294.76 Million. |
|
CAGR (2026-2032) |
7.8% |
|
Historic Data |
2020-2025 |
|
Base Year |
2025 |
|
Forecast Period |
2026-2032 |
|
Segment Scope |
by Offering
|
|
by Type
|
|
|
by Application
|
|
|
by End-User
|
|
|
Regional Scope |
North America- United States, Canada, and Mexico Europe – UK, France, Germany, Italy, Spain, Sweden, Austria, and Rest of Europe Asia Pacific – China, India, Japan, South Korea, Australia, ASEAN, Rest of APAC Middle East and Africa - South Africa, GCC, Egypt, Nigeria, Rest of the Middle East and Africa South America – Brazil, Argentina, Rest of South America |
Silicon Photomultiplier Market Players:
- ON Semiconductor (US)
- Broadcom (US)
- Hamamatsu Photonics (Japan)
- First Sensor (Germany)
- KETEK GmbH (Germany)
- AdvanSiD (Italy)
- Cremat (US)
- Excelitas Technologies (US)
- Thorlabs (US)
- Dephan (Russia)
- Hayasa Technologies (Canada)
- AP Technologies Ltd (UK)
Frequently Asked Questions
The rising applications of SiPM in light detection and ranging technologies are the primary drivers of the market.
The key players are Broadcom, First Sensor, etc.
the consumer electronics segment is expected to grow at a CAGR of 7.1% in the forecast period.
1. Research Methodology
1.1 Research Data
1.1.1. Primary Data
1.1.2. Secondary Data
1.2. Market Size Estimation
1.2.1. Bottom-Up Approach
1.2.2. Top-Up Approach
1.3. Market Breakdown and Data Triangulation
1.4. Research Assumption
2. Silicon Photomultiplier Market Executive Summary
2.1. Market Overview
2.2. Market Size (2025) and Forecast (2026– 2032) and Y-O-Y%
2.3. Market Size (USD) and Market Share (%) – By Segments and Regions
3. Global Silicon Photomultiplier Market: Competitive Landscape
3.1. SMR Competition Matrix
3.2. Key Players Benchmarking
3.2.1. Company Name
3.2.2. Headquarter
3.2.3. Product Segment
3.2.4. End-user Segment
3.2.5. Y-O-Y%
3.2.6. Revenue (2025)
3.2.7. Market Share
3.2.8. Company Locations
3.3. Market Structure
3.3.1. Market Leaders
3.3.2. Market Followers
3.3.3. Emerging Players
3.4. Consolidation of the Market
3.4.1. Strategic Initiatives and Developments
3.4.2. Mergers and Acquisitions
3.4.3. Collaborations and Partnerships
3.4.4. Product Launches and Innovations
4. Silicon Photomultiplier Market: Dynamics
4.1. Silicon Photomultiplier Market Trends by Region
4.1.1. North America
4.1.2. Europe
4.1.3. Asia Pacific
4.1.4. Middle East and Africa
4.1.5. South America
4.2. Silicon Photomultiplier Market Drivers
4.3. Silicon Photomultiplier Market Restraints
4.4. Silicon Photomultiplier Market Opportunities
4.5. Silicon Photomultiplier Market Challenges
4.6. PORTER’s Five Forces Analysis
4.6.1. Intensity of the Rivalry
4.6.2. Threat of New Entrants
4.6.3. Bargaining Power of Suppliers
4.6.4. Bargaining Power of Buyers
4.6.5. Threat of Substitutes
4.7. PESTLE Analysis
4.7.1. Political Factors
4.7.2. Economic Factors
4.7.3. Social Factors
4.7.4. Legal Factors
4.7.5. Environmental Factors
4.8. Technological Analysis
4.8.1. Time of Flight (ToF) LiDER
4.8.2. Nuclear Medicine Imagine
4.8.3. Technological Roadmap
4.9. Value Chain Analysis and Supply Chain Analysis
4.10. Pricing Analysis
4.11. Regulatory Landscape by Region
4.11.1. North America
4.11.2. Europe
4.11.3. Asia Pacific
4.11.4. Middle East and Africa
4.11.5. South America
5. Silicon Photomultiplier Market: Global Market Size and Forecast by Segmentation (by Value in USD Million) (2025-2032)
5.1. Silicon Photomultiplier Market Size and Forecast, by Offering (2025-2032)
5.1.1. Near Ultraviolet Silicon Photomultiplier
5.1.2. Red, Green Blue Silicon Photomultiplier
5.2. Silicon Photomultiplier Market Size and Forecast, by Type (2025-2032)
5.2.1. Analog Silicon Photomultiplier
5.2.2. Digital Silicon Photomultiplier
5.3. Silicon Photomultiplier Market Size and Forecast, by Application (2025-2032)
5.3.1. LiDAR And 3D Ranging
5.3.2. BioPhotonics and Medical Imaging
5.3.3. High Energy Physics
5.3.4. Radiation Detection & Monitoring
5.3.5. Flow Cytometry
5.4. Silicon Photomultiplier Market Size and Forecast, by End-User (2025-2032)
5.4.1. Healthcare
5.4.2. Automotive
5.4.3. Consumer Electronics and Telecommunications
5.4.4. Aerospace
5.4.5. Oil & Gas
5.4.6. Other
5.5. Silicon Photomultiplier Market Size and Forecast, by Region (2025-2032)
5.5.1. North America
5.5.2. Europe
5.5.3. Asia Pacific
5.5.4. Middle East and Africa
5.5.5. South America
6. North America Silicon Photomultiplier Market Size and Forecast by Segmentation (by Value in USD Million) (2025-2032)
6.1. North America Silicon Photomultiplier Market Size and Forecast, by Offering (2025-2032)
6.1.1. Near Ultraviolet Silicon Photomultiplier
6.1.2. Red, Green Blue Silicon Photomultiplier
6.2. North America Silicon Photomultiplier Market Size and Forecast, by Type (2025-2032)
6.2.1. Analog Silicon Photomultiplier
6.2.2. Digital Silicon Photomultiplier
6.3. North America Silicon Photomultiplier Market Size and Forecast, by Application (2025-2032)
6.3.1. LiDAR And 3D Ranging
6.3.2. BioPhotonics and Medical Imaging
6.3.3. High Energy Physics
6.3.4. Radiation Detection & Monitoring
6.3.5. Flow Cytometry
6.4. North America Silicon Photomultiplier Market Size and Forecast, by End-User (2025-2032)
6.4.1. Healthcare
6.4.2. Automotive
6.4.3. Consumer Electronics and Telecommunications
6.4.4. Aerospace
6.4.5. Oil & Gas
6.4.6. Other
6.5. North America Silicon Photomultiplier Market Size and Forecast, by Country (2025-2032)
6.5.1. United States
6.5.2. Canada
6.5.3. Mexico
7. Europe Silicon Photomultiplier Market Size and Forecast by Segmentation (by Value in USD Million) (2025-2032)
7.1. Europe Silicon Photomultiplier Market Size and Forecast, by Offering (2025-2032)
7.2. Europe Silicon Photomultiplier Market Size and Forecast, by Type (2025-2032)
7.3. Europe Silicon Photomultiplier Market Size and Forecast, by Application (2025-2032)
7.4. Europe Silicon Photomultiplier Market Size and Forecast, by End-User (2025-2032)
7.5. Europe Silicon Photomultiplier Market Size and Forecast, by Country (2025-2032)
7.5.1. United Kingdom
7.5.2. France
7.5.3. Germany
7.5.4. Italy
7.5.5. Spain
7.5.6. Sweden
7.5.7. Austria
7.5.8. Rest of Europe
8. Asia Pacific Silicon Photomultiplier Market Size and Forecast by Segmentation (by Value in USD Million) (2025-2032)
8.1. Asia Pacific Silicon Photomultiplier Market Size and Forecast, by Offering (2025-2032)
8.2. Asia Pacific Silicon Photomultiplier Market Size and Forecast, by Type (2025-2032)
8.3. Asia Pacific Silicon Photomultiplier Market Size and Forecast, by Application (2025-2032)
8.4. Asia Pacific Silicon Photomultiplier Market Size and Forecast, by End-User (2025-2032)
8.5. Asia Pacific Silicon Photomultiplier Market Size and Forecast, by Country (2025-2032)
8.5.1. China
8.5.2. S Korea
8.5.3. Japan
8.5.4. India
8.5.5. Australia
8.5.6. Indonesia
8.5.7. Malaysia
8.5.8. Vietnam
8.5.9. Taiwan
8.5.10. Rest of Asia Pacific
9. Middle East and Africa Silicon Photomultiplier Market Size and Forecast by Segmentation (by Value in USD Million) (2025-2032)
9.1. Middle East and Africa Silicon Photomultiplier Market Size and Forecast, by Offering (2025-2032)
9.2. Middle East and Africa Silicon Photomultiplier Market Size and Forecast, by Type (2025-2032)
9.3. Middle East and Africa Silicon Photomultiplier Market Size and Forecast, by Application (2025-2032)
9.4. Middle East and Africa Silicon Photomultiplier Market Size and Forecast, by End-User (2025-2032)
9.5. Middle East and Africa Silicon Photomultiplier Market Size and Forecast, by Country (2025-2032)
9.5.1. South Africa
9.5.2. GCC
9.5.3. Nigeria
9.5.4. Rest of ME&A
10. South America Silicon Photomultiplier Market Size and Forecast by Segmentation (by Value in USD Million) (2025-2032)
10.1. South America Silicon Photomultiplier Market Size and Forecast, by Offering (2025-2032)
10.2. South America Silicon Photomultiplier Market Size and Forecast, by Type (2025-2032)
10.3. South America Silicon Photomultiplier Market Size and Forecast, by Application (2025-2032)
10.4. South America Silicon Photomultiplier Market Size and Forecast, by End-User (2025-2032)
10.5. South America Silicon Photomultiplier Market Size and Forecast, by Country (2025-2032)
10.5.1. Brazil
10.5.2. Argentina
10.5.3. Rest Of South America
11. Company Profile: Key Players
11.1. ON Semiconductor (US)
11.1.1. Company Overview
11.1.2. Business Portfolio
11.1.2.1. Product Name
11.1.2.2. Product Details (Price, Features, etc)
11.1.3. Financial Overview
11.1.3.1. Total Revenue
11.1.3.2. Segment Revenue
11.1.3.3. Regional Revenue
11.1.4. SWOT Analysis
11.1.5. Strategic Analysis
11.1.6. Recent Developments
11.2. Broadcom (US)
11.3. Hamamatsu Photonics (Japan)
11.4. First Sensor (Germany)
11.5. KETEK GmbH (Germany)
11.6. AdvanSiD (Italy)
11.7. Cremat (US)
11.8. Excelitas Technologies (US)
11.9. Thorlabs (US)
11.10. Dephan (Russia)
11.11. Hayasa Technologies (Canada)
11.12. AP Technologies Ltd (UK)
12. Key Findings
13. Analyst Recommendations
13.1. Strategic Recommendations
13.2. Future Outlook


