Raman Spectroscopy Market Global Industry Overview (2026-2032) by Instrument, Sampling, Application, and, Region
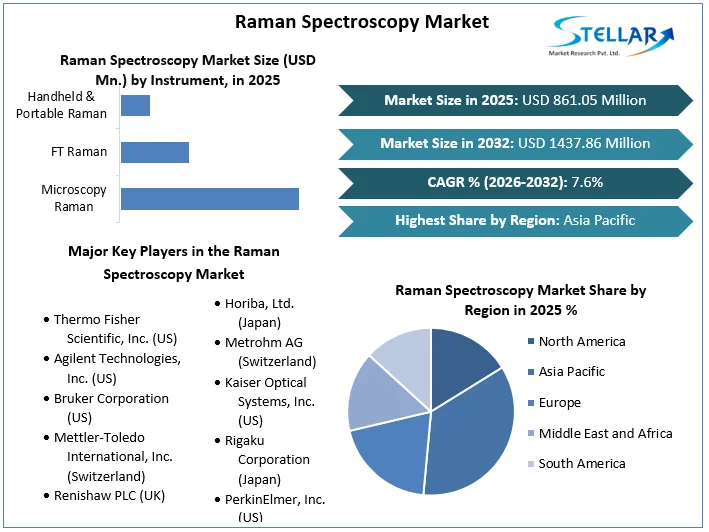
Raman Spectroscopy Market size was valued at US$ 861.05 Million in 2025 and the total Raman Spectroscopy revenue is expected to grow at 7.6% through 2026 to 2032, reaching nearly US$ 1437.86 Million.
Raman Spectroscopy Market Overview:
Raman spectroscopy is a non-invasive scientific analytical technique that yields precise insights into the underlying composition, form and polymorphy, crystalline nature, and chemical nature. It is dependent on light's interplay with chemical reactions within a substance. Raman spectroscopy investigates a material's chemical composition and integrity, phasing and heterogeneity, inherent stress or tension, degradation, and adulteration.
Raman spectroscopy, with a spacing of 0.4-1 micrometer, may be utilized for microscopic examination. A Raman microscope can be used to do such an analysis. A Raman instrument is a device that connects a Raman spectrometer to a regular optical microscope, enabling high-resolution imaging of material as well as Raman examination using a minuscule beam point. Raman micro-analysis is simple; simply put the specimen under the eyepiece, zoom, and evaluate.
The market's growth drivers, as well as the market's segments (Instrument, Sampling, Application, and, Region), are analyzed in this research. Market participants, regions, and special requirements have all provided data. This market study provides an in-depth look at all of the important advancements that are currently taking place across all industry sectors. Statistics, Infographics, and Presentations are used to provide key data analysis. The analysis looks at the market's Drivers, Restraints, Opportunities, and Challenges for the Raman Spectroscopy market. The study aids in the evaluation of market growth drivers and the determination of how to employ these drivers as a tool. The research also aids in the correction and resolution of difficulties with the global Raman Spectroscopy market.
To get more Insights: Request Free Sample Report
Raman Spectroscopy Market Dynamics:
Raman spectroscopy's analytical tools are progressively being used at various phases of drug design. Biochemical verification, molecular genetics research and diagnostic tools, solid form testing, biological analysis, composition insights in late-stage drug research, procedure metrics, quality standards, raw - materials certification, and imitation detection are all examples of this. Initial studies are an important component of clinical development, and they are carried out to understand the physical and chemical properties of prospective medications in order to facilitate synthesis development for preclinical and medical investigations.
Despite its numerous advantages, Raman spectroscopy market has wide demand from variety of fields. The primary cause is the expensive cost of Raman spectrometer equipment. Raman instruments are significantly more costly than their competitors. This is because the illumination laser and detector are quite expensive. Because of beam lifespan and corresponding repairs, Raman devices can be more costly to repair over time. Almost all quantitative Raman instruments are safe Grade I devices. However, because Raman spectrometers are non-invasive and have no contact, they do not necessitate the use of certain items or complicated samples, lowering their total price.
The use of cloud technology for research areas, particularly scientific processes, is progressively gaining traction. The pay-per-product concept and flexibility are two of the cloud's main draws. While the cloud's flexibility can be advantageous for many purposes and use cases, it also creates substantial obstacles in the creation of apps or solutions. Cloud-oriented technologies and incorporated spectroscopic analytical techniques are becoming more popular in facilities. These solutions can link devices, obtain the most recent information to help in the handling of massive and complicated databases, and acquire greater actionable insights quickly and accurately than previously thought possible.
Raman Spectroscopy Market Segment Analysis:
By Instruments, Handheld and Portable Raman instrument segment are expected to witness a CAGR of 5.8% in the raman spectroscopy market.
This increase is related to strong growth from pharma, biological sciences, and material science sectors for biomaterials quantifying, multispectral biomolecular imaging of cellular components, clinical applications, and thorough evaluation of pharmacological raw resources. Because of technological developments in portable and mobile Raman spectroscopy tools, users may now do observations in the open instead of sending all materials to the lab. As a result, by conducting the first assessment of the data, time may be saved for evaluation. Raman spectroscopies, both fixed and movable, are often used to determine or validate the constituents of a material. Medicinal labs, for example, deploy these tools to check the legitimacy of medications and the substances used to make such medications.

By Sampling, the SERS segment of raman spectroscopy market is expected to grow at a CAGR of 4.7% in the same forecast period.
The ongoing technological breakthroughs in nanotech, as well as intensive practical and theoretical study, have greatly extended the scope of SERS and raised its consumption in the medicinal, biological sciences, and mineral research projects. SERS is superior to conventional Raman spectroscopy sampling approaches in various ways. Because of the considerable increase in signal amplitude, a larger calibration curve may be investigated, with initial limits that are much smaller than those of standard Raman scattering methods
Raman Spectroscopy Market Regional Insights:
The Asia Pacific is projected to dominate the Raman spectroscopy market at the end of the forecast period. This growth might be ascribed to the rising demand for medicinal, biological sciences, and advanced materials applications in Japan and South Korea. Additionally, the presence of a multitude of pharma and bioscience firms, as well as multinational pharmaceutical organizations, is supporting the Raman spectroscopy market growth in the region.
The continued involvement of government entities in enhancing the quality of healthcare infrastructure, urbanization, growth of the market’s Gross Domestic Product, and assistance provided by local as well as many companies to broaden the pharma and biosciences sectors in emerging regions can all be credited to the market growth in the region.
The purpose of this research is to provide stakeholders in the industry with a thorough insight into the Raman Spectroscopy Market. The study includes an analysis of difficult data in simple language, as well as the industry's historical and current state, as well as anticipated market size and trends. The market report examines all segments of the industry, with a focus on significant players such as market leaders, followers, and new entrants. The report includes a PORTER, PESTEL analysis as well as the possible influence of microeconomic market determinants. External and internal elements that are expected to have a favorable or negative impact on the firm have been examined, providing decision-makers with a clear future vision of the industry. The research also aids in comprehending the Raman Spectroscopy Market dynamics and structure by studying market segments and forecasting market size. The research is an investor's guide since it depicts the competitive analysis of major competitors in the Raman Spectroscopy Market by product, price, financial situation, product portfolio, growth plans, and geographical presence.
Raman Spectroscopy Market Scope:
|
Raman Spectroscopy Market |
|
|
Market Size in 2025 |
USD 861.05 Million. |
|
Market Size in 2032 |
USD 1437.86 Million. |
|
CAGR (2026-2032) |
7.6% |
|
Historic Data |
2020-2025 |
|
Base Year |
2025 |
|
Forecast Period |
2026-2032 |
|
Segment Scope |
by Instrument
|
|
by Sampling
|
|
|
by Application
|
|
|
Regional Scope |
North America- United States, Canada, and Mexico Europe – UK, France, Germany, Italy, Spain, Sweden, Austria, and Rest of Europe Asia Pacific – China, India, Japan, South Korea, Australia, ASEAN, Rest of APAC Middle East and Africa - South Africa, GCC, Egypt, Nigeria, Rest of the Middle East and Africa South America – Brazil, Argentina, Rest of South America |
Raman Spectroscopy Market Players:
- Thermo Fisher Scientific, Inc. (US)
- Agilent Technologies, Inc. (US)
- Bruker Corporation (US)
- Mettler-Toledo International, Inc. (Switzerland)
- Renishaw PLC (UK)
- Horiba, Ltd. (Japan)
- Metrohm AG (Switzerland)
- Kaiser Optical Systems, Inc. (US)
- Rigaku Corporation (Japan)
- PerkinElmer, Inc. (US)
Frequently Asked Questions
Raman spectroscopy's analytical tools are progressively being used at various phases of drug design.
The key players are Agilent, Horiba, etc.
Handheld and Portable Raman instrument segment are expected to witness a CAGR of 5.8% in the aforementioned forecast period.
1. Research Methodology
1.1 Research Data
1.1.1. Primary Data
1.1.2. Secondary Data
1.2. Market Size Estimation
1.2.1. Bottom-Up Approach
1.2.2. Top-Up Approach
1.3. Market Breakdown and Data Triangulation
1.4. Research Assumption
2. Raman Spectroscopy Market Executive Summary
2.1. Market Overview
2.2. Market Size (2025) and Forecast (2026– 2032) and Y-O-Y%
2.3. Market Size (USD) and Market Share (%) – By Segments and Regions
3. Global Raman Spectroscopy Market: Competitive Landscape
3.1. SMR Competition Matrix
3.2. Key Players Benchmarking
3.2.1. Company Name
3.2.2. Headquarter
3.2.3. Product Segment
3.2.4. End-user Segment
3.2.5. Y-O-Y%
3.2.6. Revenue (2025)
3.2.7. Profit Magin
3.2.8. Market Share
3.2.9. Company Locations
3.3. Market Structure
3.3.1. Market Leaders
3.3.2. Market Followers
3.3.3. Emerging Players
3.4. Consolidation of the Market
3.4.1. Strategic Initiatives and Developments
3.4.2. Mergers and Acquisitions
3.4.3. Collaborations and Partnerships
3.4.4. Product Launches and Innovations
3.5. Raman Spectroscopy Industry Ecosystem
3.5.1. Ecosystem Analysis
3.5.2. Role of the Companies in the Ecosystem
4. Raman Spectroscopy Market: Dynamics
4.1. Raman Spectroscopy Market Trends by Region
4.1.1. North America
4.1.2. Europe
4.1.3. Asia Pacific
4.1.4. Middle East and Africa
4.1.5. South America
4.2. Raman Spectroscopy Market Drivers
4.3. Raman Spectroscopy Market Restraints
4.4. Raman Spectroscopy Market Opportunities
4.5. Raman Spectroscopy Market Challenges
4.6. PORTER’s Five Forces Analysis
4.6.1. Intensity of the Rivalry
4.6.2. Threat of New Entrants
4.6.3. Bargaining Power of Suppliers
4.6.4. Bargaining Power of Buyers
4.6.5. Threat of Substitutes
4.7. PESTLE Analysis
4.7.1. Political Factors
4.7.2. Economic Factors
4.7.3. Social Factors
4.7.4. Legal Factors
4.7.5. Environmental Factors
4.8. Technological Roadmap
4.9. Value Chain Analysis
4.10. Regulatory Landscape
4.10.1. Market Regulation by Region
4.10.1.1. North America
4.10.1.2. Europe
4.10.1.3. Asia Pacific
4.10.1.4. Middle East and Africa
4.10.1.5. South America
4.10.2. Impact of Regulations on Market Dynamics
4.10.3. Government Schemes and Initiatives
5. Raman Spectroscopy Market: Global Market Size and Forecast by Segmentation (by Value in USD Million) (2025-2032)
5.1. Raman Spectroscopy Market Size and Forecast, by Instrument (2025-2032)
5.1.1. Microscopy Raman
5.1.2. FT Raman
5.1.3. Handheld & Portable Raman
5.1.4. Other
5.2. Raman Spectroscopy Market Size and Forecast, by Sampling (2025-2032)
5.2.1. Surface-Enhanced Raman Scattering (SERS)
5.2.2. Tip Enhanced Raman Scattering (TERS)
5.2.3. Other
5.3. Raman Spectroscopy Market Size and Forecast, by Application (2025-2032)
5.3.1. Pharmaceutical
5.3.2. Life Science
5.3.3. Materials Science
5.3.4. Carbon Material
5.3.5. Semiconductor
5.3.6. Other
5.4. Raman Spectroscopy Market Size and Forecast, by Region (2025-2032)
5.4.1. North America
5.4.2. Europe
5.4.3. Asia Pacific
5.4.4. Middle East and Africa
5.4.5. South America
6. North America Raman Spectroscopy Market Size and Forecast by Segmentation (by Value in USD Million) (2025-2032)
6.1. North America Raman Spectroscopy Market Size and Forecast, by Instrument (2025-2032)
6.1.1. Microscopy Raman
6.1.2. FT Raman
6.1.3. Handheld & Portable Raman
6.1.4. Other
6.2. North America Raman Spectroscopy Market Size and Forecast, by Sampling (2025-2032)
6.2.1. Surface-Enhanced Raman Scattering (SERS)
6.2.2. Tip Enhanced Raman Scattering (TERS)
6.2.3. Other
6.3. North America Raman Spectroscopy Market Size and Forecast, by Application (2025-2032)
6.3.1. Pharmaceutical
6.3.2. Life Science
6.3.3. Materials Science
6.3.4. Carbon Material
6.3.5. Semiconductor
6.3.6. Other
6.4. North America Raman Spectroscopy Market Size and Forecast, by Country (2025-2032)
6.4.1. United States
6.4.2. Canada
6.4.3. Mexico
7. Europe Raman Spectroscopy Market Size and Forecast by Segmentation (by Value in USD Million) (2025-2032)
7.1. Europe Raman Spectroscopy Market Size and Forecast, by Instrument (2025-2032)
7.2. Europe Raman Spectroscopy Market Size and Forecast, by Sampling (2025-2032)
7.3. Europe Raman Spectroscopy Market Size and Forecast, by Application (2025-2032)
7.4. Europe Raman Spectroscopy Market Size and Forecast, by Country (2025-2032)
7.4.1. United Kingdom
7.4.2. France
7.4.3. Germany
7.4.4. Italy
7.4.5. Spain
7.4.6. Sweden
7.4.7. Austria
7.4.8. Rest of Europe
8. Asia Pacific Raman Spectroscopy Market Size and Forecast by Segmentation (by Value in USD Million) (2025-2032)
8.1. Asia Pacific Raman Spectroscopy Market Size and Forecast, by Instrument (2025-2032)
8.2. Asia Pacific Raman Spectroscopy Market Size and Forecast, by Sampling (2025-2032)
8.3. Asia Pacific Raman Spectroscopy Market Size and Forecast, by Application (2025-2032)
8.4. Asia Pacific Raman Spectroscopy Market Size and Forecast, by Country (2025-2032)
8.4.1. China
8.4.2. S Korea
8.4.3. Japan
8.4.4. India
8.4.5. Australia
8.4.6. Indonesia
8.4.7. Malaysia
8.4.8. Vietnam
8.4.9. Taiwan
8.4.10. Rest of Asia Pacific
9. Middle East and Africa Raman Spectroscopy Market Size and Forecast by Segmentation (by Value in USD Million) (2025-2032)
9.1. Middle East and Africa Raman Spectroscopy Market Size and Forecast, by Instrument (2025-2032)
9.2. Middle East and Africa Raman Spectroscopy Market Size and Forecast, by Sampling (2025-2032)
9.3. Middle East and Africa Raman Spectroscopy Market Size and Forecast, by Application (2025-2032)
9.4. Middle East and Africa Raman Spectroscopy Market Size and Forecast, by Country (2025-2032)
9.4.1. South Africa
9.4.2. GCC
9.4.3. Nigeria
9.4.4. Rest of ME&A
10. South America Raman Spectroscopy Market Size and Forecast by Segmentation (by Value in USD Million) (2025-2032)
10.1. South America Raman Spectroscopy Market Size and Forecast, by Instrument (2025-2032)
10.2. South America Raman Spectroscopy Market Size and Forecast, by Sampling (2025-2032)
10.3. South America Raman Spectroscopy Market Size and Forecast, by Application (2025-2032)
10.4. South America Raman Spectroscopy Market Size and Forecast, by Country (2025-2032)
10.4.1. Brazil
10.4.2. Argentina
10.4.3. Rest Of South America
11. Company Profile: Key Players
11.1. Thermo Fisher Scientific, Inc. (US)
11.1.1. Company Overview
11.1.2. Business Portfolio
11.1.2.1. Product Name
11.1.2.2. Product Details (Price, Features, etc)
11.1.3. Financial Overview
11.1.3.1. Total Revenue
11.1.3.2. Segment Revenue
11.1.3.3. Regional Revenue
11.1.4. SWOT Analysis
11.1.5. Strategic Analysis
11.1.6. Recent Developments
11.2. Agilent Technologies, Inc. (US)
11.3. Bruker Corporation (US)
11.4. Mettler-Toledo International, Inc. (Switzerland)
11.5. Renishaw PLC (UK)
11.6. Horiba, Ltd. (Japan)
11.7. Metrohm AG (Switzerland)
11.8. Kaiser Optical Systems, Inc. (US)
11.9. Rigaku Corporation (Japan)
11.10. PerkinElmer, Inc. (US)
12. Key Findings
13. Analyst Recommendations
13.1. Strategic Recommendations
13.2. Future Outlook