Parcel Delivery Market Trend Tracking and Forecast Analysis (2026-2032) by Type, Solutions, and Region
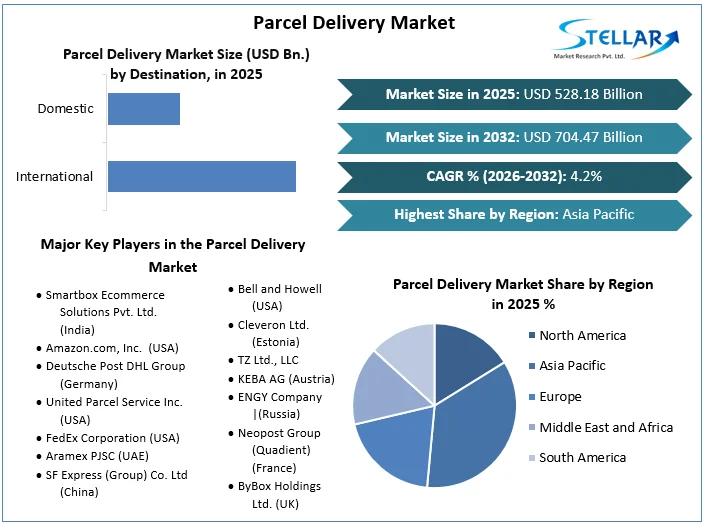
Parcel Delivery Market size was valued at US$ 528.18 Billion in 2025 and the total Parcel Delivery Market revenue is expected to grow at 4.2% through 2026 to 2032, reaching nearly US$ 704.47 Billion.
Parcel Delivery Market Overview:
Products or objects wrapped in paper, sealed in an envelope, or placed in a box are referred to as packages, and parcel delivery refers to the process of conveying a parcel to a certain location by road, rail, or air. Increased internet penetration and the rise of the e-commerce industry have fuelled the parcel delivery market. As internet penetration and client purchasing patterns change, the worldwide parcel delivery industry is predicted to increase at a CAGR of over 4.2% over the forecast period.
To get more Insights: Request Free Sample Report
Parcel Delivery Market Dynamics:
The burgeoning e-commerce sector, as well as cross-border trade, are two major factors driving the growth of the parcel delivery industry. As cross-border trade routes have emerged, especially in emerging economies, acceptance of international trade and B2C exports has grown. Furthermore, rising consumer demand for online purchases through various e-commerce platforms is propelling market expansion. E-commerce companies cooperate with courier service providers to distribute their products across national and international borders.
Merchants are focusing their efforts on getting a complete understanding of procedures such as duty collection, customs clearance, and other minefields, with half of Asia-Pacific internet buyers conducting cross-border purchases. Customers' expectations of what they can get are rising, and technology is allowing them to have more choices about how those products are delivered. Customers are getting more demanding, but they are also becoming more cost conscious, according to past studies, with a low willingness to pay for enhanced convenience. In the medium term, autonomous delivery vehicles (ADVs) will be the dominant technology in last-mile delivery, allowing customers to save both time and money.
Furthermore, technological advancements, such as the utilization of digital technologies in conjunction with crowd-sourced distribution models, are enhancing the market's potential. These technologies assist service providers in increasing their overall operational efficiency and meeting the needs of their customers. Other factors such as rapid urbanization, increasing consumer spending power, and significant industrial sector expansion are likely to boost the market even higher throughout the forecast period.
Significant cost savings will result in a multibillion-euro redistribution of value throughout the industry's core and new segments. In developed economies, cost-effective autonomous technology has the potential to save $20 billion to $25 billion each year. The value redistribution is massive, far exceeding the total profit pool of CEP members in today's industrialized countries. Furthermore, rather than the increasing same-day and instant markets, the lion's share of value redistribution in the last-mile ecosystem ($15 billion to $20 billion) is projected to take place in today's core market. CEP members, autonomous-vehicle developers, and others will most likely share the value.
Despite the significant technological leap necessary, existing CEP providers are still well positioned to control the majority of package volumes in delayed, B2B, and—to a lesser extent—same-day delivery (75 to 80% of the volume in 2025). The capital-intensive nature of sorting and full-scale logistics networks, the nearly-mandatory nationwide service offer, huge economies of scale, and essential client access are enormous barriers to entry for new companies, and will assist existing firms maintain their core dominance. Several very large retailers, on the other hand, may join traditional last-mile delivery (that is, deferred delivery) in specific high-density locations in order to gain control of the consumer touch point and establish synergies with their same-day networks.
CV players will almost certainly play a larger role in last-mile delivery in the future, as they are well-positioned to not just operate autonomous delivery fleets (fleet management), but also to exploit their routing skills. CEP players are well positioned to dominate the essential steps—capacity management, tour optimization and planning, and sorting—because they will continue to compete from a position of strength in the core industry. The parcels' physical administration also gives CEP participants access to and control over the data associated with them, which is an important input for process excellence.
Technological Advancements in the Parcel Delivery Market:
As a result of the world's growing digitization, the delivery sector has gone through numerous stages of innovation, including the use of GPS and RFID technology to track cars and commodities. While the USPS is concerned about the expanding use of electronic mail, courier companies continue to profit from increased online retail sales: Consumers and businesses are increasingly purchasing physical goods online, and these items must be delivered. Furthermore, parcel processing equipment capable of sorting 20,000 shipments in an hour have boosted the efficiency of the sector. Satellite computer systems have also boosted the amount of monitoring of Internet-connected courier fleet trucks.
Because of the development in e-commerce, parcel shipping is booming:
Consumers are ordering more online due to e-commerce expansion and the COVID-19 epidemic, which is fuelling the parcel delivery sector. This resulted in a 37% increase in volume, with 20 billion parcels carried in the United States, and a 29% increase in income, reaching $171 billion in 2020.
During the forecast period, Asia Pacific is expected to have the greatest CAGR. Furthermore, the APAC area's growth is being fuelled by expanding E commerce penetration and commercial advances in the region. Aside from that, improving living standards and disposable income in India, Japan, China, and ASEAN countries are driving the region's economic trend. Furthermore, with leading market players establishing bases in the APAC region in the hopes of future benefits, the industry is likely to grow at a rapid pace. Due to expanding E commerce in the Chinese region and China's booming industrial sector, China leads the APAC region with the biggest market share of 50%.
Technological Roadmap for the Parcel Delivery Market:
- The first wave of technology, which includes electric vehicles (EVs) and the increasing availability of unattended delivery systems, is expected to change last-mile delivery. These technologies are ready for the market and scalable, and each one contributes to cost savings, customer convenience, and regulatory compliance. It's only logical that as cities tighten pollution rules, EV deployment in last-mile delivery will be one of the first technologies to gain popularity.
- By 2030, robots are expected to deliver things right to customers' front doors. By allowing robots to handle the "last ten yards" of delivery, this technology significantly improves the consumer experience. Robot delivery pilots are currently ongoing. However, due to the high cost of this technology, these options are unlikely to be extensively adopted.
- In three to five years, large, semiautonomous delivery vehicles that follow parcel-delivery staff are expected to be the next trend followed by parcel-delivery organizations. This first step toward full automation is expected to help delivery staff and increase output by reducing the time necessary to drive and park vehicles.
The B2B segment dominates the market:
The B2B (Business-to-Business) sector now dominates the Parcel Delivery market and is expected to continue so through 2032. As the number of B2B parcel drops per recipient and special delivery requirements rise, the parcel delivery market is likely to expand. The expansion of e-commerce and online food stores is driving the B2C sector; in 2026-2032, B2C parcel delivery is expected to grow by 7% Y-O-Y. Government regulations, gasoline prices, and transportation are the most significant hurdles to the B2C segment's growth, as well as major challenges for industry leaders.
Parcel Delivery Market Regional Insights:
Consumers are ordering more online due to e-commerce expansion and the COVID-19 epidemic, which is fuelling the parcel delivery sector. This resulted in a 37 percent increase in volume, with 20 billion parcels carried in the United States, and a 29 percent increase in income, reaching $171 billion in 2020.
During the forecast period, Asia Pacific is expected to have the greatest CAGR. Furthermore, the APAC area's growth is being fueled by expanding E commerce penetration and commercial advances in the region. Aside from that, improving living standards and disposable income in India, Japan, China, and ASEAN countries are driving the region's economic trend. Furthermore, with leading market players establishing bases in the APAC region in the hopes of future benefits, the industry is likely to grow at a rapid pace. Due to expanding E commerce in the Chinese region and China's booming industrial sector, China leads the APAC region with the biggest market share of 50%.
The objective of the report is to present a comprehensive analysis of the Parcel Delivery Market to the stakeholders in the industry. The report provides trends that are most dominant in the Parcel Delivery Market and how these trends will influence new business investments and market development throughout the forecast period. The report also aids in the comprehension of the Parcel Delivery Market dynamics and competitive structure of the market by analyzing market leaders, market followers, and regional players.
The qualitative and quantitative data provided in the Parcel Delivery Market report is to help understand which market segments, regions are expected to grow at higher rates, factors affecting the market, and key opportunity areas, which will drive the industry and market growth through the forecast period. The report also includes the competitive landscape of key players in the industry along with their recent developments in the Parcel Delivery Market. The report studies factors such as company size, market share, market growth, revenue, production volume, and profits of the key players in the Parcel Delivery Market.
The report provides Porter's Five Force Model, which helps in designing the business strategies in the market. The report helps in identifying how many rivals are existing, who they are, and how their product quality is in the Market. The report also analyses if the Parcel Delivery Market is easy for a new player to gain a foothold in the market, do they enter or exit the market regularly if the market is dominated by a few players, etc.
The report also includes a PESTEL Analysis, which aids in the development of company strategies. Political variables help in figuring out how much a government can influence the Market. Economic variables aid in the analysis of economic performance drivers that have an impact on the Market. Understanding the impact of the surrounding environment and the influence of environmental concerns on the Parcel Delivery Market is aided by legal factors.
Parcel Delivery Market Scope:
|
Parcel Delivery Market |
|
|
Market Size in 2025 |
USD 528.18 Bn. |
|
Market Size in 2032 |
USD 704.47 Bn. |
|
CAGR (2026-2032) |
4.2% |
|
Historic Data |
2020-2025 |
|
Base Year |
2025 |
|
Forecast Period |
2025-2032 |
|
Segment Scope |
by Destination
|
|
by Business
|
|
|
by End User
|
|
|
Regional Scope |
North America- United States, Canada, and Mexico Europe – UK, France, Germany, Italy, Spain, Sweden, Austria, and Rest of Europe Asia Pacific – China, India, Japan, South Korea, Australia, ASEAN, Rest of APAC Middle East and Africa - South Africa, GCC, Egypt, Nigeria, Rest of the Middle East and Africa South America – Brazil, Argentina, Rest of South America |
Parcel Delivery Market Players:
- Smartbox Ecommerce Solutions Pvt. Ltd. (India)
- Amazon.com, Inc. (USA)
- Deutsche Post DHL Group (Germany)
- United Parcel Service Inc. (USA)
- FedEx Corporation (USA)
- Aramex PJSC (UAE)
- SF Express (Group) Co. Ltd (China)
- Bell and Howell (USA)
- Cleveron Ltd. (Estonia)
- TZ Ltd., LLC
- KEBA AG (Austria)
- ENGY Company |(Russia)
- Neopost Group (Quadient) (France)
- ByBox Holdings Ltd. (UK)
- InPost (Poland)
Frequently Asked Questions
Asia Pacific region have the highest growth rate in the Parcel Delivery market.
Smartbox Ecommerce Solutions Pvt. Ltd. (India), Amazon.com, Inc. (USA), Deutsche Post DHL Group (Germany), United Parcel Service Inc. (USA), FedEx Corporation (USA), Aramex PJSC (UAE), SF Express (Group) Co. Ltd (China), Bell and Howell (USA), Cleveron Ltd. (Estonia), TZ Ltd., LLC, KEBA AG (Austria), ENGY Company (Russia), Neopost Group (Quadient) (France), ByBox Holdings Ltd. (UK), InPost (Poland) and others are the key players in the Parcel Delivery market.
E commerce segment is dominating the marke entering into E coet owing to increasing penetration of smartphones and B2B and B2C market leaders armmerce trade.
1. Research Methodology
1.1 Research Data
1.1.1. Primary Data
1.1.2. Secondary Data
1.2. Market Size Estimation
1.2.1. Bottom-Up Approach
1.2.2. Top-Down Approach
1.3. Market Breakdown and Data Triangulation
1.4. Research Assumption
2. Parcel Delivery Market Executive Summary
2.1. Market Overview
2.2. Market Size (2025) and Forecast (2026– 2032) and Y-O-Y%
2.3. Market Size (USD) and Market Share (%) – By Segments and Regions
3. Global Parcel Delivery Market: Competitive Landscape
3.1. SMR Competition Matrix
3.2. Key Players Benchmarking
3.2.1. Company Name
3.2.2. Headquarter
3.2.3. Business Segment
3.2.4. End-user Segment
3.2.5. Y-O-Y%
3.2.6. Revenue (2025)
3.2.7. Profit Margin
3.2.8. Market Share
3.2.9. Company Locations
3.3. Market Structure
3.3.1. Market Leaders
3.3.2. Market Followers
3.3.3. Emerging Players
3.4. Consolidation of the Market
3.4.1. Strategic Initiatives
3.4.2. Mergers and Acquisitions
3.4.3. Collaborations and Partnerships
3.4.4. Developments and Innovations
4. Parcel Delivery Market: Dynamics
4.1. Parcel Delivery Market Trends by Region
4.1.1. North America
4.1.2. Europe
4.1.3. Asia Pacific
4.1.4. Middle East and Africa
4.1.5. South America
4.2. Parcel Delivery Market Drivers
4.3. Parcel Delivery Market Restraints
4.4. Parcel Delivery Market Opportunities
4.5. Parcel Delivery Market Challenges
4.6. PORTER’s Five Forces Analysis
4.6.1. Intensity of the Rivalry
4.6.2. Threat of New Entrants
4.6.3. Bargaining Power of Suppliers
4.6.4. Bargaining Power of Buyers
4.6.5. Threat of Substitutes
4.7. PESTLE Analysis
4.7.1. Political Factors
4.7.2. Economic Factors
4.7.3. Social Factors
4.7.4. Technological Factors
4.7.5. Legal Factors
4.7.6. Environmental Factors
4.8. Technological Roadmap
4.9. Regulatory Landscape
4.9.1. Market Regulation by Region
4.9.1.1. North America
4.9.1.2. Europe
4.9.1.3. Asia Pacific
4.9.1.4. Middle East and Africa
4.9.1.5. South America
4.9.2. Impact of Regulations on Market Dynamics
4.9.3. Government Schemes and Initiatives
5. Global Parcel Delivery Market: Global Market Size and Forecast by Segmentation (by Value in USD Million) (2025-2032)
5.1. Global Parcel Delivery Market Size and Forecast, by Destination (2025-2032)
5.1.1. International
5.1.2. Domestic
5.2. Global Parcel Delivery Market Size and Forecast, by Business (2025-2032)
5.2.1. B2B
5.2.2. B2C
5.3. Global Parcel Delivery Market Size and Forecast, by End User (2025-2032)
5.3.1. Wholesale and Retail Trade (E-commerce)
5.3.2. Manufacturing, Construction, and Utilities
5.3.3. Primary Industries (Agriculture, and Other Natural Resources)
5.3.4. Services (BFSI (Banking, Financial Services and Insurance)
5.4. Global Parcel Delivery Market Size and Forecast, by Region (2025-2032)
5.4.1. North America
5.4.2. Europe
5.4.3. Asia Pacific
5.4.4. Middle East and Africa
5.4.5. South America
6. North America Parcel Delivery Market Size and Forecast by Segmentation (by Value in USD Million) (2025-2032)
6.1. North America Parcel Delivery Market Size and Forecast, by Destination (2025-2032)
6.1.1. International
6.1.2. Domestic
6.2. North America Parcel Delivery Market Size and Forecast, by Business (2025-2032)
6.2.1. B2B
6.2.2. B2C
6.3. North America Parcel Delivery Market Size and Forecast, by End User (2025-2032)
6.3.1. Wholesale and Retail Trade (E-commerce)
6.3.2. Manufacturing, Construction, and Utilities
6.3.3. Primary Industries (Agriculture, and Other Natural Resources)
6.3.4. Services (BFSI (Banking, Financial Services and Insurance)
6.4. North America Parcel Delivery Market Size and Forecast, by Country (2025-2032)
6.4.1. United States
6.4.2. Canada
6.4.3. Mexico
7. Europe Parcel Delivery Market Size and Forecast by Segmentation (by Value in USD Million) (2025-2032)
7.1. Europe Parcel Delivery Market Size and Forecast, by Destination (2025-2032)
7.2. Europe Parcel Delivery Market Size and Forecast, by Business (2025-2032)
7.3. Europe Parcel Delivery Market Size and Forecast, by End User (2025-2032)
7.4. Europe Parcel Delivery Market Size and Forecast, by Country (2025-2032)
7.4.1. United Kingdom
7.4.2. France
7.4.3. Germany
7.4.4. Italy
7.4.5. Spain
7.4.6. Sweden
7.4.7. Austria
7.4.8. Rest of Europe
8. Asia Pacific Parcel Delivery Market Size and Forecast by Segmentation (by Value in USD Million) (2025-2032)
8.1. Asia Pacific Parcel Delivery Market Size and Forecast, by Destination (2025-2032)
8.2. Asia Pacific Parcel Delivery Market Size and Forecast, by Business (2025-2032)
8.3. Asia Pacific Parcel Delivery Market Size and Forecast, by End User (2025-2032)
8.4. Asia Pacific Parcel Delivery Market Size and Forecast, by Country (2025-2032)
8.4.1. China
8.4.2. S Korea
8.4.3. Japan
8.4.4. India
8.4.5. Australia
8.4.6. Indonesia
8.4.7. Malaysia
8.4.8. Vietnam
8.4.9. Taiwan
8.4.10. Rest of Asia Pacific
9. Middle East and Africa Parcel Delivery Market Size and Forecast by Segmentation (by Value in USD Million) (2025-2032)
9.1. Middle East and Africa Parcel Delivery Market Size and Forecast, by Destination (2025-2032)
9.2. Middle East and Africa Parcel Delivery Market Size and Forecast, by Business (2025-2032)
9.3. Middle East and Africa Parcel Delivery Market Size and Forecast, by End User (2025-2032)
9.4. Middle East and Africa Parcel Delivery Market Size and Forecast, by Country (2025-2032)
9.4.1. South Africa
9.4.2. GCC
9.4.3. Nigeria
9.4.4. Rest of ME&A
10. South America Parcel Delivery Market Size and Forecast by Segmentation (by Value in USD Million) (2025-2032)
10.1. South America Parcel Delivery Market Size and Forecast, by Destination (2025-2032)
10.2. South America Parcel Delivery Market Size and Forecast, by Business (2025-2032)
10.3. South America Parcel Delivery Market Size and Forecast, by End User (2025-2032)
10.4. South America Parcel Delivery Market Size and Forecast, by Country (2025-2032)
10.4.1. Brazil
10.4.2. Argentina
10.4.3. Rest Of South America
11. Company Profile: Key Players
11.1. Smartbox Ecommerce Solutions Pvt. Ltd. (India)
11.1.1. Company Overview
11.1.2. Business Portfolio
11.1.3. Financial Overview
11.1.3.1. Total Revenue
11.1.3.2. Segment Revenue
11.1.3.3. Regional Revenue
11.1.4. SWOT Analysis
11.1.5. Strategic Analysis
11.1.6. Recent Developments
11.2. Amazon.com, Inc. (USA)
11.3. Deutsche Post DHL Group (Germany)
11.4. United Parcel Service Inc. (USA)
11.5. FedEx Corporation (USA)
11.6. Aramex PJSC (UAE)
11.7. SF Express (Group) Co. Ltd (China)
11.8. Bell and Howell (USA)
11.9. Cleveron Ltd. (Estonia)
11.10. TZ Ltd., LLC
11.11. KEBA AG (Austria)
11.12. ENGY Company |(Russia)
11.13. Neopost Group (Quadient) (France)
11.14. ByBox Holdings Ltd. (UK)
11.15. InPost (Poland)
12. Key Findings
13. Analyst Recommendations
13.1. Strategic Recommendations
13.2. Future Outlook