Green Ammonia Market Global Industry Analysis and Forecast (2026-2032) by Technology, End User, and Region
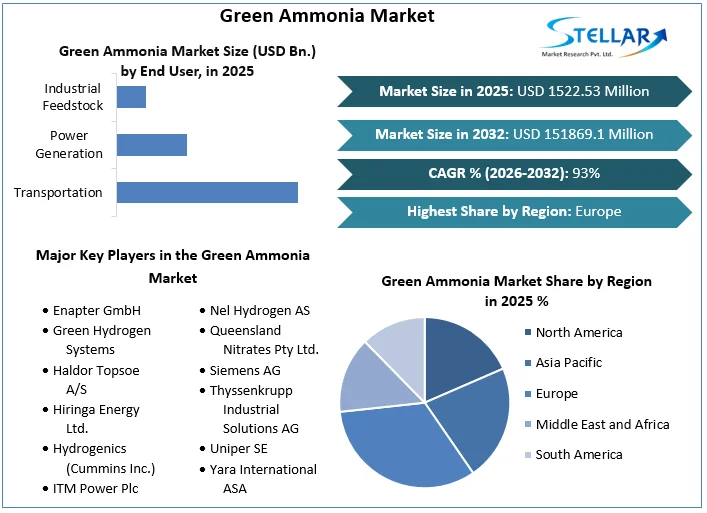
Green Ammonia Market size was valued at US$ 1522.53 Mn. in 2025. Global Green Ammonia Market is estimated to grow at a CAGR of 93% over the forecast period.
Green Ammonia Market Overview:
In an electrochemical Haber-Bosch system, green ammonia is created by combining green hydrogen with nitrogen. Green ammonia is a carbon-free form of ammonia. Electrolyzers are used in the synthesis of green hydrogen and operate in alkaline water, proton exchange membrane, or solid oxide medium. To manufacture green hydrogen, these electrolyzers use power derived from renewable sources such as solar, wind, and tidal. Green Ammonia Market report's segment analysis is provided on the basis of technology, end-user and region.
To get more Insights: Request Free Sample Report
Green Ammonia Market Dynamics:
Growing Demand for Renewable Energy Storage:
In terms of overall capacity addition, renewable energy generation continues to exceed fossil fuel power generation. Global renewable capacity reached 2.79 terawatts (TW) by the end of 2020, which is 10.3% from the previous year. Solar and wind are high-potential renewable energy sources and are expected to dominate the renewable energy sector throughout the forecast period. Global renewable power capacity was 2799 GW by the end of 2020. With a capacity of 1211 GW, hydropower accounted for the biggest percentage of the global. With capabilities of 733 GW and 714 GW, respectively, wind and solar energy contributed to an equal amount of the remaining capacity. This growing demand for renewable energy drives the green ammonia market growth.
Solar and wind energy have grown at a rapid rate than other renewable energy sources, thanks to increased investment and lower power generation costs. The transition to renewables, efficiency, and electrification, according to the Global Renewables Outlook 2020, will promote socio-economic development. As a result, rising renewable energy generation and corresponding storage requirements are expected to propel the green ammonia market growth.
Growing Adoption of Green Ammonia in Marine Industry for Fuel:
The shipping industry is currently responsible for 3% of global greenhouse gas emissions, owing to the high consumption of diesel and high sulfur fuel for ships. Heavy fuel oil, which is obtained as a leftover from crude oil distillation, is the most common type of bunker oil for ships. When oil with such a high sulfur content is burned in a ship engine, toxic SOx is released into the atmosphere. The marine industry is under pressure to reduce emissions by switching to cleaner and renewable energy sources. The sulfur limit in transportation oil used onboard ships operating outside designated emission control areas has been cut to 0.5% m/m under the International Maritime Organization (IMO) 2020 standards (mass by mass). This will lead to a shift toward higher-quality marine fuels, opening up prospects in the green ammonia Market.
According to DNV GL's Energy Transition Outlook, The IMO's 2050 emission reduction goals can be met, by adopting novel ship designs and using ammonia as an alternative fuel. Ammonia is the most efficient hydrogen carrier, which has a high energy density among other gases. As a result, it can power ships. Ammonia has the potential to grab 25% of the marine fuel mix by 2050, according to the IMO.
Low Awareness of Green Ammonia across the Globe:
The use of green ammonia is still in its early stages. Electrochemical synthesis, photochemical synthesis, and chemical looping are all methods for directly synthesizing ammonia from water and nitrogen. However, such methods are fraught with considerable technological difficulties that necessitate time and R&D expenditures. The majority of ammonia producers are using traditional techniques of production.
The major concern with green ammonia is a lack of knowledge among chemical manufacturers. For the production of ammonia, the largest chemical companies in China, Japan, and Russia continue to use natural gas steam methanation technology. TogliattiAzot PetroChina Group, EuroChem, CF Industries, and Rashtriya Chemicals and Fertilizers Ltd. are all major ammonia producers across the globe. The steam methane reforming Haber-Bosh process is used by all of these companies to produce ammonia. However, with increased knowledge of electrolysis technology and lower costs of renewable energy generation, the green ammonia market is expected to gain traction during the forecast period.
High Initial Investment Cost for Green Ammonia Plant Infrastructure:
The capital-intensive nature of green ammonia plants is now the most significant barrier to the green ammonia market's growth. Generally, the average lifespan of a modern ammonia plant is between 15 to 20 years. A Greenfield project's typical CAPEX cost per tonne of ammonia produced ranges between US$ 1,300 and US$ 2,000. Green ammonia plants, on the other hand, are 1.5 times more expensive than natural gas-based ammonia plants. Natural gas or coal, which accounts for 75% of the plant's operating costs, is the major operating cost in ammonia manufacturing. The expense of electrolyzers raises the cost of operations in green ammonia production. As a result, the increased capital intensity of green ammonia plants makes small-scale manufacturing inefficient.
Green Ammonia Market Segment Analysis:
By Technology, the Green Ammonia Market is segmented into Alkaline Water Electrolysis (AWE), Proton Exchange Membrane (PEM), and Solid Oxide Electrolysis (SOE). The Alkaline Water Electrolysis (AWE) segment has dominated the market with a 47.4% share in 2025. The low capital cost of the alkaline water electrolysis system is primarily driving the segment growth. The Solid Oxide Electrolysis (SOE) segment is expected to witness significant growth at a CAGR of 73% during the forecast period. Thanks to its uses in the generation of fuel, the recycling of carbon dioxide, and the synthesis of chemicals as a means of reducing carbon emissions, hydrogen systems are becoming more popular. SOE is a method for producing green hydrogen from excess renewable energy power. Such green hydrogen might be transformed into an ammonia synthesis factory using SOE technology to produce green ammonia. As a result, it's preferred for making green ammonia.

By End User, the Green Ammonia Market is segmented into Transportation, Power Generation, and Industrial Feedstock. The Power Generation segment is expected to grow at a CAGR of 91% during the forecast period. The growing need for energy in many end-use sectors is largely responsible for this segment's rise. Renewable energy can be stored and reused for power generation at consumption sites with green ammonia production. This will improve the efficiency and long-term viability of renewable energy generation.
Green Ammonia Market Regional Insights:
The European region has dominated the market share accounting for 34% in 2025. The presence of green hydrogen projects particularly in Germany and the Netherlands are driving the regional green ammonia market growth. In addition, Supportive government initiatives and policies, which are supporting the production of green hydrogen for achieving its energy transitions goals and maintaining energy-intensive industries to improve the business climate, which has boosted the demand for green ammonia.
The objective of the report is to present a comprehensive analysis of the Global Green Ammonia Market to the stakeholders in the industry. The report provides trends that are most dominant in the Global Green Ammonia Market and how these trends will influence new business investments and market development throughout the forecast period. The report also aids in the comprehension of the global market dynamics and competitive structure of the market by analyzing market leaders, market followers, and regional players.
The qualitative and quantitative data provided in the Global Green Ammonia Market report is to help understand which market segments, regions are expected to grow at higher rates, factors affecting the market, and key opportunity areas, which will drive the industry and market growth through the forecast period. The report also includes the competitive landscape of key players in the industry along with their recent developments in the Global Green Ammonia Market. The report studies factors such as company size, market share, market growth, revenue, production volume, and profits of the key players in the global market.
The report provides Porter's Five Force Model, which helps in designing the business strategies in the market. The report helps in identifying how many rivals are existing, who they are, and how their product quality is in the Global Green Ammonia Market. The report also analyses if the Global Green Ammonia Market is easy for a new player to gain a foothold in the market, do they enter or exit the market regularly if the market is dominated by a few players, etc.
The report also includes a PESTEL Analysis, which aids in the development of company strategies. Political variables help in figuring out how much a government can influence the Global Green Ammonia Market. Economic variables aid in the analysis of economic performance drivers that have an impact on the Global Green Ammonia Market. Understanding the impact of the surrounding environment and the influence of environmental concerns on the Global Green Ammonia Market is aided by legal factors.
Green Ammonia Market Scope:
|
Green Ammonia Market |
|
|
Market Size in 2025 |
USD 1522.53 Mn. |
|
Market Size in 2032 |
USD 151869.1 Mn. |
|
CAGR (2026-2032) |
93% |
|
Historic Data |
2020-2025 |
|
Base Year |
2025 |
|
Forecast Period |
2026-2032 |
|
Segment Scope |
by Technology
|
|
by End User
|
|
|
Regional Scope |
North America- United States, Canada, and Mexico Europe – UK, France, Germany, Italy, Spain, Sweden, Austria, and Rest of Europe Asia Pacific – China, India, Japan, South Korea, Australia, ASEAN, Rest of APAC Middle East and Africa - South Africa, GCC, Egypt, Nigeria, Rest of the Middle East and Africa South America – Brazil, Argentina, Rest of South America |
Green Ammonia Market Key Players:
- Enapter GmbH
- Green Hydrogen Systems
- Haldor Topsoe A/S
- Hiringa Energy Ltd.
- Hydrogenics (Cummins Inc.)
- ITM Power Plc
- Man Energy Solutions SE
- MCPHY Energy SAS
- Nel Hydrogen AS
- Queensland Nitrates Pty Ltd.
- Siemens AG
- Thyssenkrupp Industrial Solutions AG
- Uniper SE
- Yara International ASA
- Proton Ventures BV
- Grieg Edge AS
- CF Industries Holdings, Inc.
Frequently Asked Questions
The Europe is expected to hold the highest share in the Green Ammonia Market.
The market size of the Green Ammonia Market by 2032 is expected to reach at US$ 151869.1 Mn.
The forecast period for the Green Ammonia Market is 2026-2032.
The market size of the Green Ammonia Market in 2025 was valued at US$ 1522.53 Mn.
1. Green Ammonia Market Introduction
1.1. Study Assumption and Market Definition
1.2. Scope of the Study
1.3. Executive Summary
2. Global Green Ammonia Market: Competitive Landscape
2.1. SMR Competition Matrix
2.2. Competitive Landscape
2.3. Key Players Benchmarking
2.3.1. Company Name
2.3.2. Product Segment
2.3.3. End User Segment
2.3.4. Revenue (2025)
2.3.5. Company Locations
2.4. Market Structure
2.4.1. Market Leaders
2.4.2. Market Followers
2.4.3. Emerging Players
2.5. Mergers and Acquisitions Details
3. Green Ammonia Market: Dynamics
3.1. Green Ammonia Market Trends by Region
3.1.1. North America
3.1.2. Europe
3.1.3. Asia Pacific
3.1.4. Middle East and Africa
3.1.5. South America
3.2. Green Ammonia Market Dynamics
3.2.1. Green Ammonia Market Drivers
3.2.2. Green Ammonia Market Restraints
3.2.3. Green Ammonia Market Opportunities
3.2.4. Green Ammonia Market Challenges
3.3. PORTER’s Five Forces Analysis
3.4. PESTLE Analysis
3.5. Technological Roadmap
3.6. Value Chain Analysis
3.7. Regulatory Landscape
3.8. Key Opinion Leaders Analysis for the Green Ammonia Industry
3.9. Analysis of Government Schemes and Initiatives for Green Ammonia Industry
4. Green Ammonia Market: Global Market Size and Forecast by Segmentation (by Value in USD Million and Volume in Million Tonnes) (2025-2032)
4.1. Green Ammonia Market Size and Forecast, by Technology (2025-2032)
4.1.1. Alkaline Water Electrolysis (AWE)
4.1.2. Proton Exchange Membrane (PEM)
4.1.3. Solid Oxide Electrolysis (SOE)
4.2. Green Ammonia Market Size and Forecast, by End User (2025-2032)
4.2.1. Transportation
4.2.2. Power Generation
4.2.3. Industrial Feedstock
4.3. Green Ammonia Market Size and Forecast, by Region (2025-2032)
4.3.1. North America
4.3.2. Europe
4.3.3. Asia Pacific
4.3.4. Middle East and Africa
4.3.5. South America
5. North America Green Ammonia Market Size and Forecast by Segmentation (by Value in USD Million and Volume in Million Tonnes) (2025-2032)
5.1. North America Green Ammonia Market Size and Forecast, by Technology (2025-2032)
5.1.1. Alkaline Water Electrolysis (AWE)
5.1.2. Proton Exchange Membrane (PEM)
5.1.3. Solid Oxide Electrolysis (SOE)
5.2. North America Green Ammonia Market Size and Forecast, by End User (2025-2032)
5.2.1. Transportation
5.2.2. Power Generation
5.2.3. Industrial Feedstock
5.3. North America Green Ammonia Market Size and Forecast, by Country (2025-2032)
5.3.1. United States
5.3.2. Canada
5.3.3. Mexico
6. Europe Green Ammonia Market Size and Forecast by Segmentation (by Value in USD Million and Volume in Million Tonnes) (2025-2032)
6.1. Europe Green Ammonia Market Size and Forecast, by Technology (2025-2032)
6.2. Europe Green Ammonia Market Size and Forecast, by End User (2025-2032)
6.3. Europe Green Ammonia Market Size and Forecast, by Country (2025-2032)
6.3.1. United Kingdom
6.3.2. France
6.3.3. Germany
6.3.4. Italy
6.3.5. Spain
6.3.6. Sweden
6.3.7. Austria
6.3.8. Rest of Europe
7. Asia Pacific Green Ammonia Market Size and Forecast by Segmentation (by Value in USD Million and Volume in Million Tonnes) (2025-2032)
7.1. Asia Pacific Green Ammonia Market Size and Forecast, by Technology (2025-2032)
7.2. Asia Pacific Green Ammonia Market Size and Forecast, by End User (2025-2032)
7.3. Asia Pacific Green Ammonia Market Size and Forecast, by Country (2025-2032)
7.3.1. China
7.3.2. S Korea
7.3.3. Japan
7.3.4. India
7.3.5. Australia
7.3.6. Indonesia
7.3.7. Malaysia
7.3.8. Vietnam
7.3.9. Taiwan
7.3.10. Rest of Asia Pacific
8. Middle East and Africa Green Ammonia Market Size and Forecast by Segmentation (by Value in USD Million and Volume in Million Tonnes) (2025-2032)
8.1. Middle East and Africa Green Ammonia Market Size and Forecast, by Technology (2025-2032)
8.2. Middle East and Africa Green Ammonia Market Size and Forecast, by End User (2025-2032)
8.3. Middle East and Africa Green Ammonia Market Size and Forecast, by Country (2025-2032)
8.3.1. South Africa
8.3.2. GCC
8.3.3. Nigeria
8.3.4. Rest of ME&A
9. South America Green Ammonia Market Size and Forecast by Segmentation (by Value in USD Million and Volume in Million Tonnes) (2025-2032)
9.1. South America Green Ammonia Market Size and Forecast, by Technology (2025-2032)
9.2. South America Green Ammonia Market Size and Forecast, by End User (2025-2032)
9.3. South America Green Ammonia Market Size and Forecast, by Country (2025-2032)
9.3.1. Brazil
9.3.2. Argentina
9.3.3. Rest Of South America
10. Company Profile: Key Players
10.1. Enapter GmbH
10.1.1. Company Overview
10.1.2. Business Portfolio
10.1.3. Financial Overview
10.1.4. SWOT Analysis
10.1.5. Strategic Analysis
10.1.6. Recent Developments
10.2. Green Hydrogen Systems
10.3. Haldor Topsoe A/S
10.4. Hiringa Energy Ltd.
10.5. Hydrogenics (Cummins Inc.)
10.6. ITM Power Plc
10.7. Man Energy Solutions SE
10.8. MCPHY Energy SAS
10.9. Nel Hydrogen AS
10.10. Queensland Nitrates Pty Ltd.
10.11. Siemens AG
10.12. Thyssenkrupp Industrial Solutions AG
10.13. Uniper SE
10.14. Yara International ASA
10.15. Proton Ventures BV
10.16. Grieg Edge AS
10.17. CF Industries Holdings, Inc.
11. Key Findings
12. Industry Recommendations
13. Green Ammonia Market: Research Methodology