Graphite Market Emerging Opportunities and Market Forecast (2026-2032)
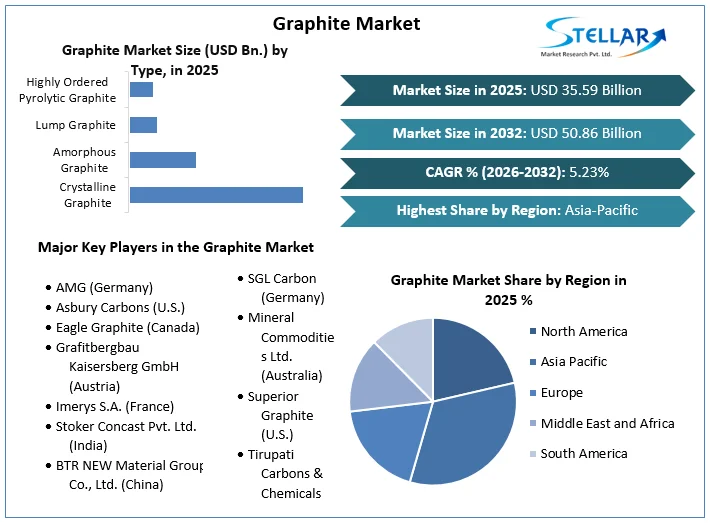
Graphite Market size was valued at US $ 35.59 Billion in 2025 and the Graphite Market revenue is expected to grow at 5.23% through 2026 to 2032, reaching nearly US $ 50.86 Billion. The report analyzes Graphite market dynamics by region and applications.
Graphite Market Overview:
Graphite (also known as plumbago) is a crystalline form of the carbon element with a hexagonal atomic configuration. It is the most stable form of carbon under normal conditions and occurs naturally. At high pressures and temperatures, it transforms into a diamond. It's a mineral that's used to make lubricants and pencils. The report on the Graphite Market by Stellar Market Research provides the PESTLE analysis, PORTER's five force analysis and segment analysis on the basis of type, application and region.
It's a great conductor of electricity and heat. Electrodes, batteries, and solar panels can all benefit from their high conductivity. Graphite market is expected to grow by 500% by 2050, according to the World Bank.
To get more Insights: Request Free Sample Report
Graphite Market Dynamics:
Revolution In Lithium-Ion Battery:
In the future, batteries will be smaller, last longer, and provide more power. In electric autos, power tools, medical equipment, and portable electronic gadgets, batteries that are lightweight, long-lasting, safe, and maybe implanted without needing to be replaced regularly are used. The most modern battery systems are lithium-ion and lithium iron phosphate batteries, both of which use graphite as an anode material. This incearsed demand from lithium-ion battery is driving the growth of graphite Market.
About a quarter of the graphite requirement is met by these batteries. A Li-ion battery requires significantly more graphite than lithium to operate an electric vehicle, making high-quality battery anode materials uncommon. Batteries, as well as fuel cells that create electricity through a chemical process, power cellphones, electric cars, and 3D printers. It's a huge industry that's only going to grow, with lithium-ion battery use expected to increase tenfold by 2029.
Electric Vehicles:
Global EV sales reached a record high of 10 million in 2020, with climate change and carbon dioxide reductions driving global demand for sustainable transportation solutions. Lithium-ion batteries are the gold standard for electric vehicles, bicycles, and other vehicles. Tesla made history in 2016 when it opened the first stage of its Giga factory, to produce enough lithium-ion batteries to power 1,500,000 electric vehicles per year. As of December 2019, there were 115 Giga plants in construction around the world.
Industrial Applications:
Traditional graphite markets are also booming. Graphite has historically been used in pencils and refractory materials for furnaces, kilns, incinerators, and reactors, as well as flame deflector systems for rocket launch structures. Graphite can be found in a variety of products, including automobile parts, inks and coatings, paints, polymers and plastics, lubricants and grease, ceramics, drilling fluids, steel pipe and tubing, fire retardants, and oil spill response solutions. As a result, rising industrial applications are expected to drive graphite market growth throughout the forecast period.
Raising Prices of Graphite:
China controls 70% to 80% of the world's graphite supply. In 2021, graphite prices in China increased nearly every month, as supply disruptions were offset by increased demand. Fast Markets IM prices for 80% grade (fob China) hit US $410/ton in mid-July, up 32% from January and 49% over the previous low in September 2020.
Prices for flake and amorphous graphite soared through Q4 2020 and Q1 2021 as a result of continuing environmental inspections and resulting production plant closures, as well as significant increases in transit costs from China when markets recovered after COVID-19. Some corporations have voluntarily reduced production to avoid fines for failing to fulfill emissions requirements. As a result, the rising price of graphite globally is likely to be a major stumbling block to the graphite market's growth over the forecast period.
|
Graphite Types |
New Price |
Previous Price |
% Change |
|
Graphite flake 94% C, +100 mesh, cif Europe, US $/tonne |
1180 |
1140 |
+ 3.5 |
|
Graphite amorphous 80% C, -200 mesh, fob China, US $/tonne |
450-500 |
400-430 |
+ 14.5 |
|
Graphite amorphous 80% C, -200 mesh, FCL, cif Europe, US $/tonne |
575-670 |
555-670 |
+ 1.6 |
Graphite Market Segmentation:
Based on Type:
Because it is widely used in various industrial applications, the amorphous graphite segment was dominating and had xx% of the overall graphite market share in terms of revenue in 2025. Amorphous graphite is a type of graphite that can be found in seams. It can be found in a range of lubricant products, such as greases and forging lubricants. This type of graphite is a great choice for circumstances when a higher ash content is required or desired.
Graphite Market Regional Insights:
In terms of revenue, the Asia Pacific region was dominating in 2025, accounting for more than xx% of the total market. The presence of key companies in the production of batteries for electric vehicles, as well as a surge in end-use sectors like automotive and electronics, have all contributed to the graphite market's growth in these regions.
Despite the pandemic-related global decrease in car sales, which saw global car sales decline 16% in 2020, according to the International Energy Agency (IEA), there were 10 million electric vehicles on the road throughout the world by the end of 2020, according to the IEA. The market's growth in this region has also been supported by a growing population and increased demand for high-quality items.
In 2025, the North American market accounted for xx% of the total graphite market share, and it is expected to grow at a CAGR of around xx% over the forecast period. Because the region is the world's top buyer of cellphones and electronic equipment for a variety of industrial and domestic applications. Every industry in the region needs electronic equipment in some manner, whether it's defense or manufacturing.
The objective of the report is to present a comprehensive analysis of the Graphite Market to the stakeholders in the industry. The report provides trends that are most dominant in the Graphite Market and how these trends will influence new business investments and market development throughout the forecast period. The report also aids in the comprehension of the market dynamics and competitive structure of the market by analyzing market leaders, market followers, and regional players.
The qualitative and quantitative data provided in the Graphite Market report is to help understand which market segments, regions are expected to grow at higher rates, factors affecting the market, and key opportunity areas, which will drive the industry and market growth through the forecast period. The report also includes the competitive landscape of key players in the industry along with their recent developments in the Graphite Market. The report studies factors such as company size, market share, market growth, revenue, production volume, and profits of the key players in the market.
Graphite Market Scope:
|
Graphite Market |
|
|
Market Size in 2025 |
USD 35.59 Bn. |
|
Market Size in 2032 |
USD 50.86 Bn. |
|
CAGR (2026-2032) |
5.23% |
|
Historic Data |
2020-2025 |
|
Base Year |
2025 |
|
Forecast Period |
2026-2032 |
|
Segment Scope |
by Type
|
|
by Application
|
|
|
Regional Scope |
North America- United States, Canada, and Mexico Europe – UK, France, Germany, Italy, Spain, Sweden, Austria, and Rest of Europe Asia Pacific – China, India, Japan, South Korea, Australia, ASEAN, Rest of APAC Middle East and Africa - South Africa, GCC, Egypt, Nigeria, Rest of the Middle East and Africa South America – Brazil, Argentina, Rest of South America |
Sports Nutrition Market Key Players
- AMG (Germany)
- Asbury Carbons (U.S.)
- Eagle Graphite (Canada)
- Grafitbergbau Kaisersberg GmbH (Austria)
- Imerys S.A. (France)
- Stoker Concast Pvt. Ltd. (India)
- BTR NEW Material Group Co., Ltd. (China)
- Nacional de Grafite (Brazil)
- SGL Carbon (Germany)
- Mineral Commodities Ltd. (Australia)
- Superior Graphite (U.S.)
- Tirupati Carbons & Chemicals Pvt. Ltd. (India)
- GrafTech International Holdings Inc. (U.S.)
- Graphite India Ltd. (India)
- Triton Minerals Ltd. (Australia)
- Mason Graphite, Inc. (Canada)
Frequently Asked Questions
The increasing price of graphite because of the supply-demand gap is the only key factor expected to hinder the growth of the market during the forecast period.
The graphite market is expected to grow at a CAGR of 5.23% during the forecast period (2026-2032).
The growing electronic industry, a revolution in lithium-ion batteries, and the growing craze about electric vehicles across the globe are the key factors expected to drive the growth of the market during the forecast period.
Leading Edge Materials Corp. (Canada), NextSource Materials Inc. (Canada), Syrah Resources Limited. (Australia), Talga Group Ltd. (Australia), Triton Minerals Ltd. (Australia), Indiana Resources (Australia), EcoGraf Limited (Australia), Magnis (Australia), Next Graphite Inc. (United States), and Others are major key players covered.
1. Graphite Market Introduction
1.1. Study Assumption and Market Definition
1.2. Scope of the Study
1.3. Executive Summary
2. Global Graphite Market: Competitive Landscape
2.1. Stellar Competition Matrix
2.2. Competitive Landscape
2.3. Key Players Benchmarking
2.3.1. Company Name
2.3.2. Product Segment
2.3.3. End User Segment
2.3.4. Revenue (2025)
2.3.5. Company Locations
2.4. Market Structure
2.4.1. Market Leaders
2.4.2. Market Followers
2.4.3. Emerging Players
2.5. Mergers and Acquisitions Details
3. Graphite Market: Dynamics
3.1. Graphite Market Trends by Region
3.1.1. North America
3.1.2. Europe
3.1.3. Asia Pacific
3.1.4. Middle East and Africa
3.1.5. South America
3.2. Graphite Market Dynamics
3.2.1. Graphite Market Drivers
3.2.2. Graphite Market Restraints
3.2.3. Graphite Market Opportunities
3.2.4. Graphite Market Challenges
3.3. PORTER’s Five Forces Analysis
3.4. PESTLE Analysis
3.5. Value Chain Analysis
3.6. Trade Analysis
3.7. Regulatory Landscape
3.8. Key Opinion Leaders Analysis for the Graphite Industry
4. Graphite Market: Global Market Size and Forecast by Segmentation (by Value in USD Million and Volume in Kilotons) (2025-2032)
4.1. Graphite Market Size and Forecast, by Type (2025-2032)
4.1.1. Crystalline Graphite
4.1.2. Amorphous Graphite
4.1.3. Lump Graphite
4.1.4. Highly Ordered Pyrolytic Graphite
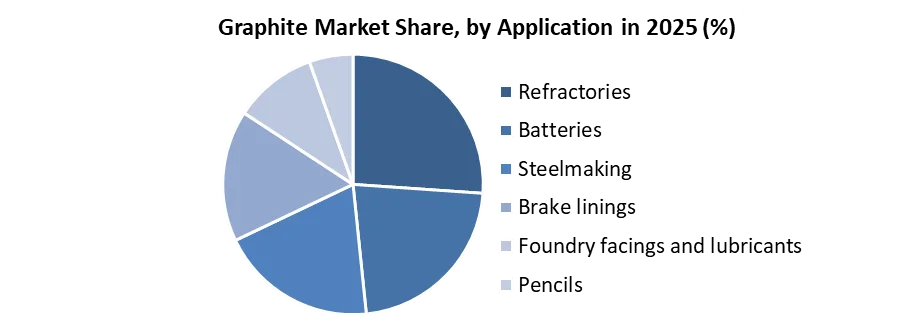
4.2. Graphite Market Size and Forecast, by Application (2025-2032)
4.2.1. Refractories
4.2.2. Batteries
4.2.3. Steelmaking
4.2.4. Brake linings
4.2.5. Foundry facings and lubricants
4.2.6. Pencils
4.2.7. Others
4.3. Graphite Market Size and Forecast, by Region (2025-2032)
4.3.1. North America
4.3.2. Europe
4.3.3. Asia Pacific
4.3.4. Middle East and Africa
4.3.5. South America
5. North America Graphite Market Size and Forecast by Segmentation (by Value in USD Million and Volume in Kilotons) (2025-2032)
5.1. North America Graphite Market Size and Forecast, by Type (2025-2032)
5.1.1. Crystalline Graphite
5.1.2. Amorphous Graphite
5.1.3. Lump Graphite
5.1.4. Highly Ordered Pyrolytic Graphite
5.2. North America Graphite Market Size and Forecast, by Application (2025-2032)
5.2.1. Refractories
5.2.2. Batteries
5.2.3. Steelmaking
5.2.4. Brake linings
5.2.5. Foundry facings and lubricants
5.2.6. Pencils
5.2.7. Others
5.3. North America Graphite Market Size and Forecast, by Country (2025-2032)
5.3.1. United States
5.3.2. Canada
5.3.3. Mexico
6. Europe Graphite Market Size and Forecast by Segmentation (by Value in USD Million and Volume in Kilotons) (2025-2032)
6.1. Europe Graphite Market Size and Forecast, by Type (2025-2032)
6.2. Europe Graphite Market Size and Forecast, by Application (2025-2032)
6.3. Europe Graphite Market Size and Forecast, by Country (2025-2032)
6.3.1. United Kingdom
6.3.2. France
6.3.3. Germany
6.3.4. Italy
6.3.5. Spain
6.3.6. Sweden
6.3.7. Austria
6.3.8. Rest of Europe
7. Asia Pacific Graphite Market Size and Forecast by Segmentation (by Value in USD Million and Volume in Kilotons) (2025-2032)
7.1. Asia Pacific Graphite Market Size and Forecast, by Type (2025-2032)
7.2. Asia Pacific Graphite Market Size and Forecast, by Application (2025-2032)
7.3. Asia Pacific Graphite Market Size and Forecast, by Country (2025-2032)
7.3.1. China
7.3.2. S Korea
7.3.3. Japan
7.3.4. India
7.3.5. Australia
7.3.6. Indonesia
7.3.7. Malaysia
7.3.8. Vietnam
7.3.9. Taiwan
7.3.10. Rest of Asia Pacific
8. Middle East and Africa Graphite Market Size and Forecast by Segmentation (by Value in USD Million and Volume in Kilotons) (2025-2032)
8.1. Middle East and Africa Graphite Market Size and Forecast, by Type (2025-2032)
8.2. Middle East and Africa Graphite Market Size and Forecast, by Application (2025-2032)
8.3. Middle East and Africa Graphite Market Size and Forecast, by Country (2025-2032)
8.3.1. South Africa
8.3.2. GCC
8.3.3. Nigeria
8.3.4. Rest of ME&A
9. South America Graphite Market Size and Forecast by Segmentation (by Value in USD Million and Volume in Kilotons) (2025-2032)
9.1. South America Graphite Market Size and Forecast, by Type (2025-2032)
9.2. South America Graphite Market Size and Forecast, by Application (2025-2032)
9.3. South America Graphite Market Size and Forecast, by Country (2025-2032)
9.3.1. Brazil
9.3.2. Argentina
9.3.3. Rest Of South America
10. Company Profile: Key Players
10.1. AMG (Germany)
10.1.1. Company Overview
10.1.2. Business Portfolio
10.1.3. Financial Overview
10.1.4. SWOT Analysis
10.1.5. Strategic Analysis
10.1.6. Recent Developments
10.2. Asbury Carbons (U.S.)
10.3. Eagle Graphite (Canada)
10.4. Grafitbergbau Kaisersberg GmbH (Austria)
10.5. Imerys S.A. (France)
10.6. Stoker Concast Pvt. Ltd. (India)
10.7. BTR NEW Material Group Co., Ltd. (China)
10.8. Nacional de Grafite (Brazil)
10.9. SGL Carbon (Germany)
10.10. Mineral Commodities Ltd. (Australia)
10.11. Superior Graphite (U.S.)
10.12. Tirupati Carbons & Chemicals Pvt. Ltd. (India)
10.13. GrafTech International Holdings Inc. (U.S.)
10.14. Graphite India Ltd. (India)
10.15. Triton Minerals Ltd. (Australia)
10.16. Mason Graphite, Inc. (Canada)
11. Key Findings
12. Industry Recommendations
13. Graphite Market: Research Methodology