Food Container Market Global Industry Outlook and Forecast (2026-2032) by Product, Material, and Region
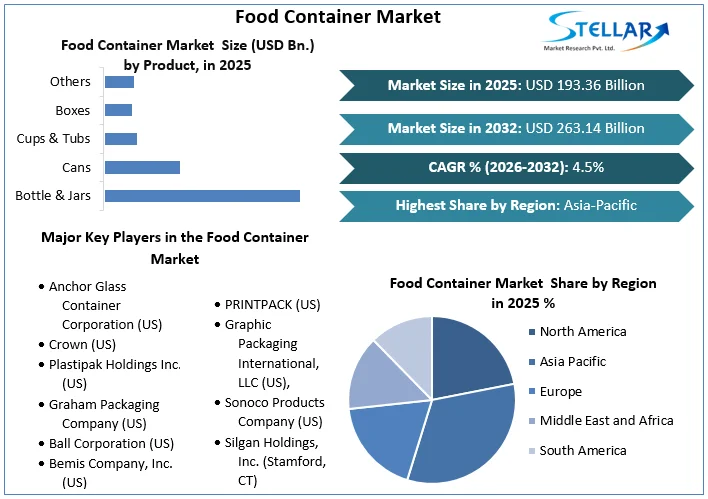
Food Container Market size was valued at US$ 193.36 Bn. in 2025. The Global Food Container Market is estimated to grow at a CAGR of 4.5% over the forecast period.
Food Container Market Definition:
Food is stored in a food storage container at ambient temperature, in the refrigerator, or the freezer. Take into account the kind of storage (room temperature, refrigerated, or frozen), the food is stored, the time of storage, and the amount of storage space available. A plastic bag, a plastic container, or a glass container can all be used as the container. Food storage containers are designed to keep food safe from contamination, which is a critical function.
With features like chemical-resistant and BPA-free plastics and other materials, it can preserve the food and rest certain that it will remain fresh and healthy until eating it again. A food container market is a container that is primarily used for food storage, transportation, and preservation to extend the shelf life of food and provide convenience in handling. This will likewise certify that consumers obtain superior food.
To get more Insights: Request Free Sample Report
Food Container Market Dynamics:
Food quality is maintained through new approaches to promote market expansion which is driving the growth of the market:
The increased desire for novel solutions to maintain food quality is one of the fundamental reasons driving the Food Container market. Food containers keep food fresh and allow it to be transported safely long distances from its point of origin. As a result of expanding populations, urbanisation, and changing lifestyles, the need for food containers has increased. Businesses, on the other hand, are coming up with inventive solutions to the environmental challenges that come with it.
Furthermore, government laws aimed at reducing greenhouse gas emissions in the food and beverage industry are expected to boost demand for sustainable packaging, this factor is propelling the market forward. Advanced Food Products, for example, has implemented sustainability measures aimed at lowering fuel and energy usage, minimising waste through zero-landfill regulations, and reaching 100% recyclable practices. This major factor is witnessing the growth of the food container market.
Due to a scarcity of raw materials as a result of the supply chain disruption, food container production was limited which is hindering the market's expansion:
Containers are a convenient and appealing way to package things, as well as a means of protecting food from environmental impacts and damage during distribution. Product is placed in rigid and semi-rigid containers made of a range of materials, which are then securely closed. Due to a shortage of raw materials as a result of the quantity sequence disruption, food container making was inadequate. In 2020, several significant players will see a decrease in annual revenue. For example, Amcor plc's yearly turnover decreased by around 6% in 2020 compared to 2019. This is due to a shortage of raw material and supply chain disruption into the market, this major factor is hampering the growth of the food container market.
The market is given the huge opportunity by a rise in awareness of sustainability issues:
Food packaging is directly responsible for a variety of environmental problems, including overcrowding at landfills, greenhouse gas emissions, and litter pollution including both on land and in the ocean. People are getting aware of this problem. Furthermore, the ease with which these containers may be used to package, carry, and transport food products is a major element boosting product demand in the market. Ready-to-eat (RTE) meals, RTE convenience foods, frozen dinners, cake mixes, snacks, and desserts are all examples of packaged foods which is giving lucrative growth for the food container market.
Food contamination and poor cleanliness are impeding the market's expansion:
When food is stored in containers for an extended period, it is known to become contaminated. The major challenge for food container constructors is possession up with changing customer flavours. As a result, food container manufacturers must create fresh, leak-proof, airtight, and inventive foods with a pleasing appearance. Furthermore, according to a study by Friends of the Earth, the manufacturing of plastic produces and contributes to about 5% of greenhouse gas emissions.
Food Container Market Segment Analysis:
By Product, the market is segmented as Bottle & Jars, Cans, Cups & Tubs, Boxes and Others. Bottle & Jars Segment dominated the market with a 32.4% share in 2025. In the rigid food container market, bottles and jars are the most extensively used goods. Foods like jam, honey, sauces, cheese, mayonnaise, oil, spreads, syrups, processed vegetables/fruits, and meat are packaged in a variety of glass and plastic jars and bottles.
However, The Cans segment is expected to grow at a CAGR of 4.5% through the forecast period. As a result of increased demand for canned goods and beverages, this segment is expected to grow rapidly through the forecast period. Steel can, often known as a tin can, particularly in British, Australian, Canadian, and South African English, steel packing, or can, is a thin metal container used for the distribution or storage of commodities. Many cans must be opened by cutting the end open others have covers that can be removed.

By Material, the market is segmented as Paperboard, Metal, Glass, Plastic and Others. The Plastic segment dominated the food container market with a 39.4% share in 2025. In 2025, plastic will account for a significant portion of the worldwide market. Plastic accounts for the majority of users in the production of food containers due to its demand, reusability qualities, and cost-efficiency. Plastic is much lighter than other materials and produces relatively little energy. Furthermore, it is quite inexpensive when compared to other materials such as metals and glass.
However, The Glass segment is expected to grow at a CAGR of 4.4% through the forecast period. To keep glass storage containers sealed, they usually have a plastic cover. Glass jars have a higher demand than other types of containers due to their ability to keep food fresh for longer. Transparency in food packaging has been increasingly popular in recent years. In addition to the components listed on the label, consumers want to view the physical product before purchasing it.
Food Container Market Regional Insights:
The Asia Pacific region dominated the market with a 38% share in 2024. This can be attributed to the region's fast-expanding food processing industry, which has benefited from significant government support. Countries like India, China, and Japan are important contributors to the regional market's expansion. According to Invest India, India now has 18 mega food parks in operation and 19 more in the planning stages. Kraft Heinz Company, Danone, Nestle, McCain, and Mars are among the main investors in the Indian food business. Between 2019 and 2020, India exported around 1,290 kilotonnes of seafood worth USD 6.68 billion. Thus according to these factors, this is the main reason for driving the growth of Asia Pacific food container market.
However, the North American region is expected to grow at a CAGR of 5.4% through the forecast period. This explains the rise in packaged food consumption, waste minimization, and the expanding use of small food containers in families, as well as the demand for fresh food. Furthermore, rising personal wealth, urbanisation, and increased interest in packaged goods are all driving factors in the business in this region.
In addition, increased demand for canned foods in the United States, such as tinned fish and meat is fuelling the growth of this market. Because of the substantial growth of the food and beverage industry, which is one of the key drivers of the regional market, the United States was the leading revenue provider in North America. Demand for bio plastic packaging is being driven by regulations demanding recycling and material sustainability to maintain environmental balance. According to the USDA, the food retailing industry rose by roughly 7% between 2019 and 2020.
The objective of the report is to present a comprehensive analysis of the Global Food Container market to the stakeholders in the industry. The report provides trends that are most dominant in the Global Food Container market and how these trends will influence new business investments and market development throughout the forecast period. The report also aids in the comprehension of the Global Food Container Market dynamics and competitive structure of the market by analyzing market leaders, market followers, and regional players.
The qualitative and quantitative data provided in the Global Food Container market report is to help understand which market segments, regions are expected to grow at higher rates, factors affecting the market, and key opportunity areas, which will drive the industry and market growth through the forecast period. The report also includes the competitive landscape of key players in the industry along with their recent developments in the Global Food Container market. The report studies factors such as company size, market share, market growth, revenue, production volume, and profits of the key players in the Global Food Container market.
Food Container Market Scope:
|
Food Container Market |
|
|
Market Size in 2025 |
USD 193.36 Bn. |
|
Market Size in 2032 |
USD 263.14 Bn. |
|
CAGR (2026-2032) |
4.5% |
|
Historic Data |
2020-2025 |
|
Base Year |
2025 |
|
Forecast Period |
2026-2032 |
|
Segment Scope |
By Product
|
|
By Material
|
|
|
Regional Scope |
North America- United States, Canada, and Mexico Europe – UK, France, Germany, Italy, Spain, Sweden, Austria, and Rest of Europe Asia Pacific – China, India, Japan, South Korea, Australia, ASEAN, Rest of APAC Middle East and Africa - South Africa, GCC, Egypt, Nigeria, Rest of the Middle East and Africa South America – Brazil, Argentina, Rest of South America |
Food Container Key Players:
- Anchor Glass Container Corporation (US)
- Crown (US)
- Plastipak Holdings Inc. (US)
- Graham Packaging Company (US)
- Ball Corporation (US)
- Bemis Company, Inc. (US)
- Berry Plastics Corporation (US)
- Constar International UK Ltd. (UK)
- PRINTPACK (US)
- Graphic Packaging International, LLC (US),
- Sonoco Products Company (US)
- Silgan Holdings, Inc. (Stamford, CT)
- Weener Plastics (Germany)
- Tetra Pak (Switzerland)
- Ardagh Group (Luxembourg)
Frequently Asked Questions
The Asia Pacific region is expected to hold the highest share in the Food Container Market.
The market size of the Food Container Market is expected to be 263.14 Bn by 2032.
The forecast period for the Food Container Market is 2026-2032.
The market size of the Food Container Market in 2025 was US$ 193.36 Bn.
Chapter 1 Scope of the Report
Chapter 2 Research Methodology
2.1.Research Process
2.2.Global Food Container Market: Target Audience
2.3.Global Food Container Market: Primary Research (As per Client Requirement)
2.4.Global Food Container Market: Secondary Research
Chapter 3 Executive Summary
Chapter 4 Competitive Landscape
4.1.Market Share Analysis, By Value,2025-2032
4.1.1.Market Share Analysis, By Region, By Value,2025-2032 (In %)
4.1.1.1.North America Market Share Analysis, By Value,2025-2032 (In %)
4.1.1.2.Europe Market Share Analysis, By Value,2025-2032 (In %)
4.1.1.3.Asia Pacific Market Share Analysis, By Value,2025-2032 (In %)
4.1.1.4.South America Market Share Analysis, By Value,2025-2032 (In %)
4.1.1.5.Middle East and Africa Market Share Analysis, By Value,2025-2032 (In %)
4.1.2.Market Share Analysis, By Product, By Value,2025-2032 (In %)
4.1.2.1.North America Market Share Analysis, By Product, By Value,2025-2032 (In %)
4.1.2.1.1.USA Market Share Analysis, By Product, By Value,2025-2032 (In %)
4.1.2.1.2.Canada Market Share Analysis, By Product, By Value,2025-2032 (In %)
4.1.2.1.3.Mexico Market Share Analysis, By Product, By Value,2025-2032 (In %)
4.1.2.2. Europe Market Share Analysis, By Product, By Value,2025-2032 (In %)
4.1.2.2.1.UK Market Share Analysis, By Product, By Value,2025-2032 (In %)
4.1.2.2.2.France Market Share Analysis, By Product, By Value,2025-2032 (In %)
4.1.2.2.3.Germany Market Share Analysis, By Product, By Value,2025-2032 (In %)
4.1.2.2.4.Italy Market Share Analysis, By Product, By Value,2025-2032 (In %)
4.1.2.2.5.Spain Market Share Analysis, By Product, By Value,2025-2032 (In %)
4.1.2.2.6.Sweden Market Share Analysis, By Product, By Value,2025-2032 (In %)
4.1.2.2.7.Austria Market Share Analysis, By Product, By Value,2025-2032 (In %)
4.1.2.2.8.Rest of Europe Market Share Analysis, By Product, By Value,2025-2032 (In %)
4.1.2.3. Asia Pacific Market Share Analysis, By Product, By Value,2025-2032 (In %)
4.1.2.3.1.China Market Share Analysis, By Product, By Value,2025-2032 (In %)
4.1.2.3.2.India Market Share Analysis, By Product, By Value,2025-2032 (In %)
4.1.2.3.3.Japan Market Share Analysis, By Product, By Value,2025-2032 (In %)
4.1.2.3.4.South Korea Market Share Analysis, By Product, By Value,2025-2032 (In %)
4.1.2.3.5.Australia Market Share Analysis, By Product, By Value,2025-2032 (In %)
4.1.2.3.6.ASEAN Market Share Analysis, By Product, By Value,2025-2032 (In %)
4.1.2.3.7.Rest of APAC Market Share Analysis, By Product, By Value,2025-2032 (In %)
4.1.2.4.South America Market Share Analysis, By Product, By Value,2025-2032 (In %)
4.1.2.4.1.Brazil Market Share Analysis, By Product, By Value,2025-2032 (In %)
4.1.2.4.2.Argentina Market Share Analysis, By Product, By Value,2025-2032 (In %)
4.1.2.4.3.Rest of South America Market Share Analysis, By Product, By Value,2025-2032 (In %)
4.1.2.5. Middle East and Africa Market Share Analysis, By Product, By Value,2025-2032 (In %)
4.1.2.5.1.South Africa Market Share Analysis, By Product, By Value,2025-2032 (In %)
4.1.2.5.2.GCC Market Share Analysis, By Product, By Value,2025-2032 (In %)
4.1.2.5.3.Egypt Market Share Analysis, By Product, By Value,2025-2032 (In %)
4.1.2.5.4.Nigeria Market Share Analysis, By Product, By Value,2025-2032 (In %)
4.1.2.5.5.Rest of Middle East and Africa Market Share Analysis, By Product, By Value,2025-2032 (In %)
4.1.3.Market Share Analysis, By Material, By Value,2025-2032 (In %)
4.1.4.North America Market Share Analysis, By Material, By Value,2025-2032 (In %)
4.1.4.1.1.USA Market Share Analysis, By Material, By Value,2025-2032 (In %)
4.1.4.1.2.Canada Market Share Analysis, By Material, By Value,2025-2032 (In %)
4.1.4.1.3.Mexico Market Share Analysis, By Material, By Value,2025-2032 (In %)
4.1.4.2.Europe Market Share Analysis, By Material, By Value,2025-2032 (In %)
4.1.4.2.1.UK Market Share Analysis, By Material, By Value,2025-2032 (In %)
4.1.4.2.2.France Market Share Analysis, By Material, By Value,2025-2032 (In %)
4.1.4.2.3.Germany Market Share Analysis, By Material, By Value,2025-2032 (In %)
4.1.4.2.4.Italy Market Share Analysis, By Material, By Value,2025-2032 (In %)
4.1.4.2.5.Spain Market Share Analysis, By Material, By Value,2025-2032 (In %)
4.1.4.2.6.Sweden Market Share Analysis, By Material, By Value,2025-2032 (In %)
4.1.4.2.7.Austria Market Share Analysis, By Material, By Value,2025-2032 (In %)
4.1.4.2.8.Rest of Europe Market Share Analysis, By Material, By Value,2025-2032 (In %)
4.1.4.3. Asia Pacific Market Share Analysis, By Material, By Value,2025-2032 (In %)
4.1.4.3.1.China Market Share Analysis, By Material, By Value,2025-2032 (In %)
4.1.4.3.2.India Market Share Analysis, By Material, By Value,2025-2032 (In %)
4.1.4.3.3.Japan Market Share Analysis, By Material, By Value,2025-2032 (In %)
4.1.4.3.4.South Korea Market Share Analysis, By Material, By Value,2025-2032 (In %)
4.1.4.3.5.Australia Market Share Analysis, By Material, By Value,2025-2032 (In %)
4.1.4.3.6.ASEAN Market Share Analysis, By Material, By Value,2025-2032 (In %)
4.1.4.3.7.Rest of APAC Market Share Analysis, By Material, By Value,2025-2032 (In %)
4.1.4.4. South America Market Share Analysis, By Material, By Value,2025-2032 (In %)
4.1.4.4.1.Brazil Market Share Analysis, By Material, By Value,2025-2032 (In %)
4.1.4.4.2.Argentina Market Share Analysis, By Material, By Value,2025-2032 (In %)
4.1.4.4.3.Rest of South America Market Share Analysis, By Material, By Value,2025-2032 (In %)
4.1.4.5. Middle East and Africa Market Share Analysis, By Material, By Value,2025-2032 (In %)
4.1.4.5.1.South Africa Market Share Analysis, By Material, By Value,2025-2032 (In %)
4.1.4.5.2.GCC Market Share Analysis, By Material, By Value,2025-2032 (In %)
4.1.4.5.3.Egypt Market Share Analysis, By Material, By Value,2025-2032 (In %)
4.1.4.5.4.Nigeria Market Share Analysis, By Material, By Value,2025-2032 (In %)
4.1.4.5.5.Rest of Middle East and Africa Market Share Analysis, By Material, By Value, 2022-24.2. Stellar Competition matrix
4.2.1.Global Stellar Competition Matrix
4.2.2.North America Stellar Competition Matrix
4.2.3.Europe Stellar Competition Matrix
4.2.4.Asia Pacific Stellar Competition Matrix
4.2.5.South America Stellar Competition Matrix
4.2.6.Middle East and Africa Stellar Competition Matrix
4.3. Key Players Benchmarking
4.3.1.Key Players Benchmarking by Product, Pricing, Market Share, Investments, Expansion Plans, Physical Presence and Presence in the Market.
4.4. Mergers and Acquisitions in Industry
4.4.1.M&A by Region, Value and Strategic Intent
4.5. Market Dynamics
4.5.1.Market Drivers
4.5.2.Market Restraints
4.5.3.Market Opportunities
4.5.4.Market Challenges
4.5.5.PESTLE Analysis
4.5.6.PORTERS Five Force Analysis
4.5.7.Value Chain Analysis
Chapter 5 Global Food Container Market Segmentation: By Product Type
5.1.Global Food Container Market, By Product Type, Overview/Analysis,2025-2032
5.2.Global Food Container Market, By Product Type, By Value, Market Share (%),2025-2032 (USD Million)
5.3.Global Food Container Market, By Product Type, By Value, -
5.3.1.Bottle & Jars
5.3.2.Cans
5.3.3.Cups & Tubs
5.3.4.Boxes
5.3.5.Others
Chapter 6 Global Food Container Market Segmentation: By Material
6.1.Global Food Container Market, By Material, Overview/Analysis,2025-2032
6.2.Global Food Container Market Size, By Material, By Value, Market Share (%),2025-2032 (USD Million)
6.3.Global Food Container Market, By Material, By Value, -
6.3.1.Paperboard
6.3.2.Metal
6.3.3.Glass
6.3.4.Plastic
6.3.5.Others
Chapter 7 Global Food Container Market Segmentation: By Region
7.1.Global Food Container Market, By Region – North America
7.1.1.North America Food Container Market Size, By Product Type, By Value,2025-2032 (USD Million)
7.1.2.North America Food Container Market Size, By Material, By Value,2025-2032 (USD Million)
7.1.3.By Country – U.S.
7.1.3.1.U.S. Food Container Market Size, By Product Type, By Value, 2025-2032 (USD Million)
7.1.3.2.U.S. Food Container Market Size, By Material, By Value,2025-2032 (USD Million)
7.1.3.3.Canada Food Container Market Size, By Value,2025-2032 (USD Million)
7.1.3.4.Mexico Food Container Market Size, By Value,2025-2032 (USD Million)
7.2. Europe Food Container Market Size, By Value,2025-2032 (USD Million)
7.2.1.UK
7.2.2.France
7.2.3.Germany
7.2.4.Italy
7.2.5.Spain
7.2.6.Sweden
7.2.7.Austria
7.2.8.Rest of Europe
7.3. Asia Pacific Food Container Market Size, By Value,2025-2032 (USD Million)
7.3.1.China
7.3.2.India
7.3.3.Japan
7.3.4.South Korea
7.3.5.Australia
7.3.6.ASEAN
7.3.7.Rest of APAC
7.4. Middle East and Africa Food Container Market Size, By Value,2025-2032 (USD Million)
7.4.1.South Africa
7.4.2.GCC
7.4.3.Egypt
7.4.4.Nigeria
7.4.5.Rest of Middle East and Africa
7.5. South America Food Container Market Size, By Value,2025-2032 (USD Million)
7.5.1.Brazil
7.5.2.Argentina
7.5.3.Rest of South America
Chapter 8 Company Profiles
8.1.Key Players
8.1.1.Anchor Glass Container Corporation (US)
8.1.1.1.Company Overview
8.1.1.2.Product Portfolio
8.1.1.3.Financial Overview
8.1.1.4.Business Strategy
8.1.1.5.Key Developments
8.1.2.Crown (US)
8.1.3.Plastipak Holdings Inc. (US)
8.1.4.Graham Packaging Company (US)
8.1.5.Ball Corporation (US)
8.1.6.Bemis Company, Inc. (US)
8.1.7.Berry Plastics Corporation (US)
8.1.8.Constar International UK Ltd. (UK)
8.1.9.PRINTPACK (US)
8.1.10.Graphic Packaging International, LLC (US),
8.1.11.Sonoco Products Company (US)
8.1.12.Silgan Holdings, Inc. (Stamford, CT)
8.1.13.Weener Plastics (Germany)
8.1.14.Tetra Pak (Switzerland)
8.1.15.Ardagh Group (Luxembourg)
8.2.Key Findings
8.3.Recommendations