Disposable Plastic Blood Bag Market Future of Blood Collection and Market Analysis (2026-2032)
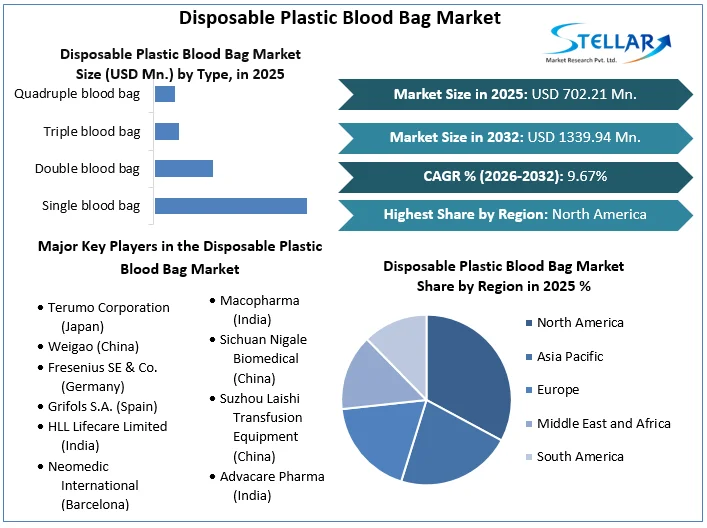
Disposable Plastic Blood Bag Market size was valued at US$ 702.21 Million in 2025 and the Disposable Plastic Blood Bag Market revenue is expected to grow at 9.67% through 2026 to 2032, reaching nearly US $ 1339.96 Million. The report analyzes Disposable Plastic Blood Bag Market dynamics by region and end-use.
Disposable Plastic Blood Bag Market Overview:
Blood and blood products are stored for transfusion in disposable plastic (PVC) bags, which replaced reusable glass bottles in the 1970s. Plastic bags made of plasticized PVC changed the way blood products were separated and used to treat a variety of hematological illnesses, including anemia, hemochromatosis, leucocytosis, and others, as well as being more convenient. After the introduction of PVC bags in the 1970s, blood transfusions became much safer. In glass bottles, separating platelets, plasma, and cryoprecipitate proved laborious, prone to bacterial contamination, and inconsistent. The report on the disposable plastic blood bag market is come up with the PESTLE analysis, PORTER's five force analysis and segment analysis on the basis of type, end-use and region.
Plastic bags have made blood separation easier, allowing for more targeted treatment of conditions including anemia and bleeding problems. Until the invention of disposable blood bags, it was difficult to separate platelets from whole blood. The availability of platelets for transfusion has supported the development of more harsh chemotherapy and bone marrow transplantation for the treatment of leukemia and lymphoma patients, saving many lives.
To get more Insights: Request Free Sample Report
Disposable Plastic Blood Bag Market Dynamics:
Programs for blood donation and government initiatives:
Demand for disposable blood bags is likely to be driven by government and private-sector blood donation efforts. Unpaid blood donors are helping the community by donating blood. Blood can also be given to hospitals, blood banks, or recipients. The Indian government, for example, was striving toward the World Health Organization's 2020 objective of 100% self-sufficiency and voluntary blood donation. In India, however, only about 11 million blood donations are collected each year, compared to the required 13.5 million for the country's 1.35 billion people (1%) population, leaving a deficit of about 2 million. The government initiatives and the changing awareness in the society is main growth driving factor for disposable plastic blood bag market
Globally, road accidents and injuries are on the rise:
The demand in the disposable plastic blood bag market is likely to rise during the forecast period thanks to an increase in the number of road traffic incidents. Each year, over 1.25 million people die in automobile accidents, according to the World Health Organization (WHO). Among people aged 15 to 29, automobile accidents are the leading cause of death. Over 90% of worldwide mortality occurs in low- and middle-income nations such as Uganda, Malawi, Vietnam, Egypt, India, Georgia, Indonesia, and others. Road traffic accidents are likely to become the world's sixth-leading cause of death by 2030 unless continued regulation and restrictions are adopted.
Risks associated with plastic bags:
When plastic bags are used in an unequal or contaminated manner, the risk of HIV transmission, hepatitis B or C, and sepsis is raised. Hepatitis C, for example, is an infectious liver disease caused by the hepatitis C virus (HCV). Hepatitis C is the most prevalent chronic bloodborne infection acquired through blood transfusion in the United States. 3.2 million people in the United States have chronic Hepatitis C, with the majority of them unaware of their condition.
All of these factors combine to make a patient reluctant to use disposable plastic bags. They prefer fresh blood from donors to disposable blood bags. This is a significant impediment to the disposable plastic blood bag market's growth. A drop in blood donations in developing and undeveloped regions such as South Africa, Angola, the Philippines, the Russian Federation, and others have also impacted the industry.
Ongoing research and development:
During the forecast period, the disposable plastic blood bag market is likely to benefit from continuing research and development by major key players and institutions in the market to develop safe and advanced blood collection, transportation, and storage technologies. For example, Johns Hopkins University recently conducted a study into the use of drones to transport blood.
It studies whether or not using drones to transport blood is feasible. These methods are also an efficient, safe, and speedy way to carry blood products to remote accident or natural disaster sites, as well as other time-sensitive places. This may very certainly support the growth of the disposable plastic blood bag market.
Ongoing Key Trends:
The use of modern technologies such as RFID (Radio Frequency Identification) is on the rise:
The primary trend is the rising adoption of RFID by major disposable plastic blood bag market participants. RFID technology can quickly and precisely identify large volumes of tagged blood bags, which is especially useful when blood bags are stacked or kept in any orientation. By eliminating manual records and transcripts, this system reduced reliance on human data entry.
Key Features of RFID:
Interaction with data.
All data can be sent in real-time through wireless networks to the backend system, giving hospital administrators real-time visibility over blood inventory.
Traceability and tracking:
The movement of each blood bag can be tracked from the donor to the end receiver.
Unique information:
Each eligible blood bag is labeled with a unique barcode or RFID tag that contains identifying information such as blood type, storage location, collection date, and expiration date, among other things.
Disposable Plastic Blood Bag Market Segment Analysis:
Based on End-use:
In 2025, the Blood banks segment was dominant and held xx% of the disposable plastic blood bag market share in terms of storage and the segment is expected to be dominant growing with a CAGR of xx% during the forecast period.

Disposable Plastic Blood Bag Market Regional Insights:
Because of an increase in blood-related illnesses in this region, the North American region dominated the market in 2025, accounting for approximately xx% of the overall market share in terms of revenue. China, the world's second-largest economy, is expected to grow at a CAGR of xx% to reach a market size of US $xx billion by 2032. Japan and Canada, for example, are likely to grow at xx% and xx%, respectively, throughout the forecast period. Within Europe, Germany is likely to grow at a CAGR of roughly xx%.
The objective of the report is to present a comprehensive analysis of the Disposable Plastic Blood Bag Market to the stakeholders in the industry. The report provides trends that are most dominant in the Disposable Plastic Blood Bag Market and how these trends will influence new business investments and market development throughout the forecast period. The report also aids in the comprehension of the market dynamics and competitive structure of the market by analyzing market leaders, market followers, and regional players.
The qualitative and quantitative data provided in the Disposable Plastic Blood Bag Market report is to help understand which market segments, regions are expected to grow at higher rates, factors affecting the market, and key opportunity areas, which will drive the industry and market growth through the forecast period. The report also includes the competitive landscape of key players in the industry along with their recent developments in the Disposable Plastic Blood Bag Market. The report studies factors such as company size, market share, market growth, revenue, production volume, and profits of the key players in the market.
The report provides Porter's Five Force Model, which helps in designing the business strategies in the market. The report helps in identifying how many rivals are existing, who they are, and how their product quality is in the Market. The report also analyses if the Disposable Plastic Blood Bag Market is easy for a new player to gain a foothold in the market, do they enter or exit the market regularly if the market is dominated by a few players, etc.
The report also includes a PESTEL Analysis, which aids in the development of company strategies. Political variables help in figuring out how much a government can influence the Market. Economic variables aid in the analysis of economic performance drivers that have an impact on the Market. Understanding the impact of the surrounding environment and the influence of environmental concerns on the Disposable Plastic Blood Bag Market is aided by legal factors.
Disposable Plastic Blood Bag Market Scope:
|
Disposable Plastic Blood Bag Market |
|
|
Market Size in 2025 |
USD 702.21 Mn. |
|
Market Size in 2032 |
USD 1339.94 Mn. |
|
CAGR (2026-2032) |
9.67% |
|
Historic Data |
2020-2025 |
|
Base Year |
2025 |
|
Forecast Period |
2026-2032 |
|
Segment Scope |
by Type
|
|
by End-Use
|
|
|
Regional Scope |
North America- United States, Canada, and Mexico Europe – UK, France, Germany, Italy, Spain, Sweden, Austria, and Rest of Europe Asia Pacific – China, India, Japan, South Korea, Australia, ASEAN, Rest of APAC Middle East and Africa - South Africa, GCC, Egypt, Nigeria, Rest of the Middle East and Africa South America – Brazil, Argentina, Rest of South America |
Disposable Plastic Blood Bag Market Key Players
- Terumo Corporation (Japan)
- Weigao (China)
- Fresenius SE & Co. (Germany)
- Grifols S.A. (Spain)
- HLL Lifecare Limited (India)
- Neomedic International (Barcelona)
- Haemonetics (United States)
- Macopharma (India)
- Sichuan Nigale Biomedical (China)
- Suzhou Laishi Transfusion Equipment (China)
- Advacare Pharma (India)
- Halyard Health (United States)
- Velico Medical Inc. (United States)
- Megacare International Inc. (India)
- Poly Medicure Limited (India)
- Innvol Medical India Limited (India)
- Others
Frequently Asked Questions
The risks of using plastic blood bags in an uneven and contaminated way leading to the transmission of fatal infections like HIV, HCV, and others is the only key factor expected to challenge the growth of the market during the forecast period.
The Disposable Plastic Blood Bag Market is expected to grow at a CAGR of 9.67% during the forecast period (2026-2032).
The growing number of traffic accidents and increasing government initiatives about blood donation are the key factor expected to drive the growth of the disposable plastic blood bag market during the forecast period.
Terumo Corporation (Japan), Weigao (China), Fresenius SE & Co. (Germany), Grifols S.A. (Spain), HLL Lifecare Limited (India), Neomedic International (Barcelona), Haemonetics (United States), Macopharma (India), Sichuan Nigale Biomedical (China), Suzhou Laishi Transfusion Equipment (China), Advacare Pharma (India), Halyard Health (United States), Velico Medical Inc. (United States), Megacare International Inc. (India), Poly Medicure Limited (India), Innvol Medical India Limited (India), and Others are key players covered.
Chapter 1 Scope of the Report
Chapter 2 Research Methodology
2.1.Research Process
2.2.Global Disposable Plastic Blood Bag Market: Target Audience
2.3.Global Disposable Plastic Blood Bag Market: Primary Research (As per Client Requirement)
2.4.Global Disposable Plastic Blood Bag Market: Secondary Research
Chapter 3 Executive Summary
Chapter 4 Competitive Landscape
4.1.Market Share Analysis, By Value, 2025-2032
4.1.1.Market Share Analysis, By Region, By Value, 2025-2032 (In %)
4.1.1.1.North America Market Share Analysis, By Value, 2025-2032 (In %)
4.1.1.2.Europe Market Share Analysis, By Value, 2025-2032 (In %)
4.1.1.3.Asia Pacific Market Share Analysis, By Value, 2025-2032 (In %)
4.1.1.4.South America Market Share Analysis, By Value, 2025-2032 (In %)
4.1.1.5.Middle East and Africa Market Share Analysis, By Value, 2025-2032 (In %)
4.1.2.Market Share Analysis, By Type, By Value, 2025-2032 (In %)
4.1.2.1.North America Market Share Analysis, By Type, By Value, 2025-2032 (In %)
4.1.2.1.1.USA Market Share Analysis, By Type, By Value, 2025-2032 (In %)
4.1.2.1.2.Canada Market Share Analysis, By Type, By Value, 2025-2032 (In %)
4.1.2.1.3.Mexico Market Share Analysis, By Type, By Value, 2025-2032 (In %)
4.1.2.2.Europe Market Share Analysis, By Type, By Value, 2025-2032 (In %)
4.1.2.2.1.UK Market Share Analysis, By Type, By Value, 2025-2032 (In %)
4.1.2.2.2.France Market Share Analysis, By Type, By Value, 2025-2032 (In %)
4.1.2.2.3.Germany Market Share Analysis, By Type, By Value, 2025-2032 (In %)
4.1.2.2.4.Italy Market Share Analysis, By Type, By Value, 2025-2032 (In %)
4.1.2.2.5.Spain Market Share Analysis, By Type, By Value, 2025-2032 (In %)
4.1.2.2.6.Sweden Market Share Analysis, By Type, By Value, 2025-2032 (In %)
4.1.2.2.7.Austria Market Share Analysis, By Type, By Value, 2025-2032 (In %)
4.1.2.2.8.Rest of Europe Market Share Analysis, By Type, By Value, 2025-2032 (In %)
4.1.2.3.Asia Pacific Market Share Analysis, By Type, By Value, 2025-2032 (In %)
4.1.2.3.1.China Market Share Analysis, By Type, By Value, 2025-2032 (In %)
4.1.2.3.2.India Market Share Analysis, By Type, By Value, 2025-2032 (In %)
4.1.2.3.3.Japan Market Share Analysis, By Type, By Value, 2025-2032 (In %)
4.1.2.3.4.South Korea Market Share Analysis, By Type, By Value, 2025-2032 (In %)
4.1.2.3.5.Australia Market Share Analysis, By Type, By Value, 2025-2032 (In %)
4.1.2.3.6.ASEAN Market Share Analysis, By Type, By Value, 2025-2032 (In %)
4.1.2.3.7.Rest of APAC Market Share Analysis, By Type, By Value, 2025-2032 (In %)
4.1.2.4.South America Market Share Analysis, By Type, By Value, 2025-2032 (In %)
4.1.2.4.1.Brazil Market Share Analysis, By Type, By Value, 2025-2032 (In %)
4.1.2.4.2.Argentina Market Share Analysis, By Type, By Value, 2025-2032 (In %)
4.1.2.4.3.Rest of South America Market Share Analysis, By Type, By Value, 2025-2032 (In %)
4.1.2.5.Middle East and Africa Market Share Analysis, By Type, By Value, 2025-2032 (In %)
4.1.2.5.1.South Africa Market Share Analysis, By Type, By Value, 2025-2032 (In %)
4.1.2.5.2.GCC Market Share Analysis, By Type, By Value, 2025-2032 (In %)
4.1.2.5.3.Egypt Market Share Analysis, By Type, By Value, 2025-2032 (In %)
4.1.2.5.4.Nigeria Market Share Analysis, By Type, By Value, 2025-2032 (In %)
4.1.2.5.5.Rest of Middle East and Africa Market Share Analysis, By Type, By Value, 2025-2032 (In %)
4.1.3.Market Share Analysis, By End-Use, By Value, 2025-2032 (In %)
4.1.4.North America Market Share Analysis, By End-Use, By Value, 2025-2032 (In %)
4.1.4.1.1.USA Market Share Analysis, By End-Use, By Value, 2025-2032 (In %)
4.1.4.1.2.Canada Market Share Analysis, By End-Use, By Value, 2025-2032 (In %)
4.1.4.1.3.Mexico Market Share Analysis, By End-Use, By Value, 2025-2032 (In %)
4.1.4.2.Europe Market Share Analysis, By End-Use, By Value, 2025-2032 (In %)
4.1.4.2.1.UK Market Share Analysis, By End-Use, By Value, 2025-2032 (In %)
4.1.4.2.2.France Market Share Analysis, By End-Use, By Value, 2025-2032 (In %)
4.1.4.2.3.Germany Market Share Analysis, By End-Use, By Value, 2025-2032 (In %)
4.1.4.2.4.Italy Market Share Analysis, By End-Use, By Value, 2025-2032 (In %)
4.1.4.2.5.Spain Market Share Analysis, By End-Use, By Value, 2025-2032 (In %)
4.1.4.2.6.Sweden Market Share Analysis, By End-Use, By Value, 2025-2032 (In %)
4.1.4.2.7.Austria Market Share Analysis, By End-Use, By Value, 2025-2032 (In %)
4.1.4.2.8.Rest of Europe Market Share Analysis, By End-Use, By Value, 2025-2032 (In %)
4.1.4.3. Asia Pacific Market Share Analysis, By End-Use, By Value, 2025-2032 (In %)
4.1.4.3.1.China Market Share Analysis, By End-Use, By Value, 2025-2032 (In %)
4.1.4.3.2.India Market Share Analysis, By End-Use, By Value, 2025-2032 (In %)
4.1.4.3.3.Japan Market Share Analysis, By End-Use, By Value, 2025-2032 (In %)
4.1.4.3.4.South Korea Market Share Analysis, By End-Use, By Value, 2025-2032 (In %)
4.1.4.3.5.Australia Market Share Analysis, By End-Use, By Value, 2025-2032 (In %)
4.1.4.3.6.ASEAN Market Share Analysis, By End-Use, By Value, 2025-2032 (In %)
4.1.4.3.7.Rest of APAC Market Share Analysis, By End-Use, By Value, 2025-2032 (In %)
4.1.4.4.South America Market Share Analysis, By End-Use, By Value, 2025-2032 (In %)
4.1.4.4.1.Brazil Market Share Analysis, By End-Use, By Value, 2025-2032 (In %)
4.1.4.4.2.Argentina Market Share Analysis, By End-Use, By Value, 2025-2032 (In %)
4.1.4.4.3.Rest of South America Market Share Analysis, By End-Use, By Value, 2025-2032 (In %)
4.1.4.5.Middle East and Africa Market Share Analysis, By End-Use, By Value, 2025-2032 (In %)
4.1.4.5.1.South Africa Market Share Analysis, By End-Use, By Value, 2025-2032 (In %)
4.1.4.5.2.GCC Market Share Analysis, By End-Use, By Value, 2025-2032 (In %)
4.1.4.5.3.Egypt Market Share Analysis, By End-Use, By Value, 2025-2032 (In %)
4.1.4.5.4.Nigeria Market Share Analysis, By End-Use, By Value, 2025-2032 (In %)
4.1.4.5.5.Rest of Middle East and Africa Market Share Analysis, By End-Use, By Value, 2025-2032 (In %)
4.2.Stellar Competition matrix
4.2.1.Global Stellar Competition Matrix
4.2.2.North America Stellar Competition Matrix
4.2.3.Europe Stellar Competition Matrix
4.2.4.Asia Pacific Stellar Competition Matrix
4.2.5.South America Stellar Competition Matrix
4.2.6.Middle East and Africa Stellar Competition Matrix
4.3. Key Players Benchmarking
4.3.1.Key Players Benchmarking by Type, Pricing, Market Share, Investments, Expansion Plans, Physical Presence and Presence in the Market.
4.4. Mergers and Acquisitions in Industry
4.4.1.M&A by Region, Value and Strategic Intent
4.5.Market Dynamics
4.5.1.Market Drivers
4.5.2.Market Restraints
4.5.3.Market Opportunities
4.5.4.Market Challenges
4.5.5.PESTLE Analysis
4.5.6.PORTERS Five Force Analysis
4.5.7.Value Chain Analysis
Chapter 5 Global Disposable Plastic Blood Bag Market Segmentation: By Type
5.1.Global Disposable Plastic Blood Bag Market, By Type, Overview/Analysis, 2025-2032
5.2.Global Disposable Plastic Blood Bag Market, By Type, By Value, Market Share (%), 2025-2032 (USD Billion)
5.3.Global Disposable Plastic Blood Bag Market, By Type, By Value, -
5.3.1.Single blood bag
5.3.2.Double blood bag
5.3.3.Triple blood bag
5.3.4.Quadruple blood bag
Chapter 6 Global Disposable Plastic Blood Bag Market Segmentation: By End-Use
6.1.Global Disposable Plastic Blood Bag Market, By End-Use, Overview/Analysis, 2025-2032
6.2.Global Disposable Plastic Blood Bag Market Size, By End-Use, By Value, Market Share (%), 2025-2032 (USD Billion)
6.3.Global Disposable Plastic Blood Bag Market, By End-Use, By Value, -
6.3.1.Hospitals
6.3.2.NGOs (Non-Government Organization)
6.3.3.Blood Banks
6.3.4.Home Healthcare
Chapter 7 Global Disposable Plastic Blood Bag Market Segmentation: By Region
7.1. Global Disposable Plastic Blood Bag Market, By Region – North America
7.1.1.North America Disposable Plastic Blood Bag Market Size, By Type, By Value, 2025-2032 (USD Billion)
7.1.2.North America Disposable Plastic Blood Bag Market Size, By End-Use, By Value, 2025-2032 (USD Billion)
7.1.3.By Country – U.S.
7.1.3.1. U.S. Disposable Plastic Blood Bag Market Size, By Type, By Value, 2025-2032 (USD Billion)
7.1.3.2. U.S. Disposable Plastic Blood Bag Market Size, By End-Use, By Value, 2025-2032 (USD Billion)
7.1.3.3. Canada Disposable Plastic Blood Bag Market Size, By Value, 2025-2032 (USD Billion)
7.1.3.4. Mexico Disposable Plastic Blood Bag Market Size, By Value, 2025-2032 (USD Billion)
7.2. Europe Disposable Plastic Blood Bag Market Size, By Value, 2025-2032 (USD Billion)
7.2.1.UK
7.2.2.France
7.2.3.Germany
7.2.4.Italy
7.2.5.Spain
7.2.6.Sweden
7.2.7.Austria
7.2.8.Rest of Europe
7.3. Asia Pacific Disposable Plastic Blood Bag Market Size, By Value, 2025-2032 (USD Billion)
7.3.1.China
7.3.2.India
7.3.3.Japan
7.3.4.South Korea
7.3.5.Australia
7.3.6.ASEAN
7.3.7.Rest of APAC
7.4. Middle East and Africa Disposable Plastic Blood Bag Market Size, By Value, 2025-2032 (USD Billion)
7.4.1.South Africa
7.4.2.GCC
7.4.3.Egypt
7.4.4.Nigeria
7.4.5.Rest of Middle East and Africa
7.5. South America Disposable Plastic Blood Bag Market Size, By Value, 2025-2032 (USD Billion)
7.5.1.Brazil
7.5.2.Argentina
7.5.3.Rest of South America
Chapter 8 Company Profiles
8.1.Key Players
8.1.1.Terumo Corporation (Japan)
8.1.1.1.Company Overview
8.1.1.2.Type Portfolio
8.1.1.3.Financial Overview
8.1.1.4.Business Strategy
8.1.1.5.Key Developments
8.1.2.Weigao (China)
8.1.3.Fresenius SE & Co. (Germany)
8.1.4.Grifols S.A. (Spain)
8.1.5.HLL Lifecare Limited (India)
8.1.6.Neomedic International (Barcelona)
8.1.7.Haemonetics (United States)
8.1.8.Macopharma (India)
8.1.9.Sichuan Nigale Biomedical (China)
8.1.10.Suzhou Laishi Transfusion Equipment (China)
8.1.11.Advacare Pharma (India)
8.1.12.Halyard Health (United States)
8.1.13.Velico Medical Inc. (United States)
8.1.14.Megacare International Inc. (India)
8.1.15.Poly Medicure Limited (India)
8.1.16.Innvol Medical India Limited (India)
8.1.17.Others
8.2. Key Findings
8.3. Recommendations