Consumer Audio Market Industry Forecast (2026-2032) by Product, Equipment, Application and, Region
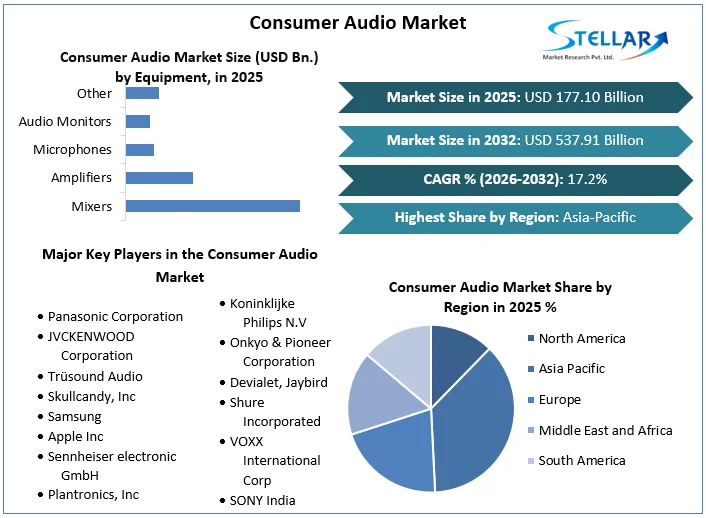
Consumer Audio Market size was valued at US$ 177.10 Bn. in 2025 and the total Consumer Audio revenue is expected to grow at 17.2% through 2026 to 2032, reaching nearly US$ 537.91 Bn.
Consumer Audio Market Overview:
Any electronic device used to transmit, recreate, or capture audio, such as turntables, mixers, MP3 players, radio, mics, and speakers, is referred to as audio and sound equipment. The consumer audio market is part of the consumer electronics sector, although it can also contain other product categories like hi-fi. Hi-fi stands for higher fidelity, a phrase that refers to high-resolution audio and sound systems that try to duplicate the original piece as accurately as possible.
The growing trend of increasing spending on international festivals and music events is predicted to drive demand for consumer audio market. With an increase in the number of trade exhibits, motion films, exhibitions, music performances, and sporting events, demand for various creative audio amplifiers is likely to surge. According to Billboard magazine, over 30 million people in the United States attend at least one music festival each year.
Due to the COVID-19 epidemic, there have been countrywide lockdown limitations, limiting the use of audio equipment for commercial purposes. The closure of colleges and educational institutions, museums and galleries, the postponing of musical performances and other gatherings, and a variety of other limitations are projected to have a detrimental influence on the consumer audio market for commercial applications.
To get more Insights: Request Free Sample Report
Consumer Audio Market Dynamics:
A major driver of the consumer audio market is the rapid surge in demand for entertainment devices. The need for mobile accessories has expanded significantly as a result of the introduction of portable entertainment devices such as computers, cell phones, and i-pads. For data transmission and music streaming, smartphones employ wireless audio technologies e.g. Bluetooth and Wi-Fi. These wireless technologies allow smartphones to broadcast music to wireless speakers or headphones simply and conveniently. As a result, the growth of the consumer audio market is driven by the rising usage of smartphones.
The key opportunity in the consumer audio market is that the manufacturers are trying to extend their business segments beyond audio. Most headphone manufacturers are now concentrating on enhancing the quality of their devices' audio output to capture a substantial portion of the consumer audio device market. Manufacturers of wireless audio devices, on the other hand, are anticipated to shift their attention away from audio in the future. Manufacturers are now employing smart wearables to measure health metrics, thanks to the advancement of smart gadgets. Businesses are working on several smart audio gadgets that can not only provide entertainment but also monitor health and measure various human body metrics.
The main challenge in the consumer audio market is the bandwidth constraints resulting in the loss of audio quality. Engineers working on wireless audio devices generally assure that they offer high-quality audio in real-time. The quality of audio produced by wireless audio devices is influenced by bandwidth limits, encoding delays, and error bits. Through advancements in wireless technologies e.g. Bluetooth and Wi-Fi provide benefits in terms of receiving digital audio wherever and whenever it is needed, the convergence of audio and video in consumer devices creates difficulties for device makers.
Consumer Audio Market Segment Analysis:
By Product, the Microphone segment of the consumer audio market is expected to grow at the fastest CAGR of 10.3% in the forecast period. This can be attributed to increased microphone applications in day-to-day life. Shure released the MV5C Home Office Microphone in October 2020, which is geared for professionals and executives who work from home. In introducing the new mic, the business asserted that it will meet the demands of experts of all sorts in the new era of virtual collaboration with a device that prioritizes the user's voice above the surroundings, resulting in excellent audio quality. The MV5C is a directional mic with Shure's Speech Enhancement Mode, which enhances the user's speech during audio or video chats. It works with Mac and Windows systems with USB-A and USB-C ports.
Furthermore, audio accessories are responding to the market's growing needs. The goods specified for professional audio reproduction in setup, broadcast, film, and outdoor applications include miniature microphones and accessories. As demand grows, players are investing in widening their technologies. For example, BnH revealed in April 2019 that Shure TwinPlex series mics may be available shortly, and this product line offers a significant advancement in compact microphones built for theatre, stage, and cinema.
Consumer Audio Market Regional Insights:
Due to rising technical innovation, the existence of some of the largest audio equipment suppliers, e.g. Yamaha Corporation, and fast industrialization, Asia-Pacific is likely to grab a significant portion of the consumer audio market in the forecast period. Furthermore, owing to the area's numerous potential prospects, various global market players are swiftly developing and increasing their market position in the region. This region's market is likewise growing as a result of new technologies. An example of this would be in August 2019, Denon, a Japanese sound brand purchased by Sound United, a corporation with a portfolio of sound brands which include Definitive Technology, Boston Acoustics, etc. launched this intriguing pairing of an amplifier and CD player that provides excellent audio performance at a reasonable rate.
China is renowned as the world's manufacturer. However, the area has witnessed the fury of the COVID-19 outbreak, which has halted all economic operations and enforced draconian lockdowns in nations e.g. China, India, and Australia. This has had an impact on the consumer audio market as a whole. Concerns about increased illnesses and the allocation of funding for healthcare also had an impact on consumer spending. The region's market for smart Screens, wireless audio devices, professional audio systems, and other linked electronic items has seen a considerable drop in sales. The lack of microchips and other components has also resulted in a decrease in consumer electronics device output. The increased consumer spending and vengeance purchasing in the second half of 2023 have led to increased sales of wireless audio items.
The purpose of this research is to provide stakeholders in the industry with a thorough insight into the Consumer Audio market. The study includes an analysis of difficult data in simple language, as well as the industry's historical and current state, as well as anticipated market size and trends. The market report examines all segments of the industry, with a focus on significant players such as market leaders, followers, and new entrants. The report includes a PORTER, PESTEL analysis as well as the possible influence of microeconomic market determinants. External and internal elements that are expected to have a favorable or negative impact on the firm have been examined, providing decision-makers with a clear future vision of the industry. The research also aids in comprehending the Consumer Audio market dynamics and structure by studying market segments and forecasting market size. The research is an investor's guide since it depicts the competitive analysis of major competitors in the Consumer Audio market by product, price, financial situation, product portfolio, growth plans, and geographical presence.
Breakthroughs in the Consumer Audio industry are discussed, as well as organic and inorganic growth plans. Various companies are focusing on organic growth strategies such as new product releases, product approvals, and other items such as patents and events. Inorganic growth strategies used in the industry included acquisitions, partnerships, and collaborations.
Consumer Audio Market Scope:
|
Consumer Audio Market |
|
|
Market Size in 2025 |
USD 177.10 Bn. |
|
Market Size in 2032 |
USD 537.91 Bn. |
|
CAGR (2026-2032) |
17.2% |
|
Historic Data |
2020-2025 |
|
Base Year |
2025 |
|
Forecast Period |
2026-2032 |
|
Segment Scope |
By Product
|
|
By Equipment
|
|
|
By Application
|
|
|
Regional Scope |
North America- United States, Canada, and Mexico Europe – UK, France, Germany, Italy, Spain, Sweden, Austria, and Rest of Europe Asia Pacific – China, India, Japan, South Korea, Australia, ASEAN, Rest of APAC Middle East and Africa - South Africa, GCC, Egypt, Nigeria, Rest of the Middle East and Africa South America – Brazil, Argentina, Rest of South America |
Consumer Audio Market Players
- Panasonic Corporation
- JVCKENWOOD Corporation
- Trüsound Audio
- Skullcandy, Inc
- Samsung
- Apple Inc
- Sennheiser electronic GmbH
- Plantronics, Inc
- Koninklijke Philips N.V
- Onkyo & Pioneer Corporation
- Devialet, Jaybird
- Shure Incorporated
- VOXX International Corp
- SONY India
- Zebronics India Pvt. Ltd
- Bose Corporation
Frequently Asked Questions
A major driver of the consumer audio market is the rapid surge in demand for entertainment devices.
The growing trend of increasing spending on international festivals and music events is predicted to drive demand for consumer audio equipment.
Consumer Audio Market size was valued at US$ 177.10 Bn. in 2025 and the total Consumer Audio revenue is expected to grow at 17.2% through 2026 to 2032, reaching nearly US$ 537.91 Bn.
The segments covered are Product, Equipment, Application and, Region.
1. Consumer Audio Market: Research Methodology
1.1. Research Data
1.1.1. Primary Data
1.1.2. Secondary Data
1.2. Market Size Estimation
1.2.1. Bottom-Up Approach
1.2.2. Top-Down Approach
1.3. Market breakdown and Data Triangulation
1.4. Assumptions
2. Consumer Audio Market: Executive Summary
2.1. Market Overview
2.2. Market Size (2025) and Forecast (2026– 2032) and Y-O-Y%
2.3. Market Size (USD) and Market Share (%) – By Segments and Regions
3. Consumer Audio Market: Competitive Landscape
3.1. Stellar Competition Matrix
3.2. Key Players Benchmarking
3.2.1. Company Name
3.2.2. Headquarter
3.2.3. Product Segment
3.2.4. End-user Segment
3.2.5. Y-O-Y%
3.2.6. Revenue (2025)
3.2.7. Profit Margin
3.2.8. Market Share
3.2.9. Company Locations
3.3. Market Structure
3.3.1. Market Leaders
3.3.2. Market Followers
3.3.3. Emerging Players
3.4. Consolidation of the Market
3.4.1. Strategic Initiatives and Developments
3.4.2. Mergers and Acquisitions
3.4.3. Collaborations and Partnerships
3.4.4. Product Launches and Innovations
4. Consumer Audio Market: Dynamics
4.1. Market Trends by Region
4.1.1. North America
4.1.2. Europe
4.1.3. Asia Pacific
4.1.4. Middle East and Africa
4.1.5. South America
4.2. Market Drivers
4.3. Market Restraints
4.4. Market Opportunities
4.5. Market Challenges
4.6. PORTER’s Five Forces Analysis
4.6.1. Intensity of the Rivalry
4.6.2. Threat of New Entrants
4.6.3. Bargaining Power of Suppliers
4.6.4. Bargaining Power of Buyers
4.6.5. Threat of Substitutes
4.7. PESTLE Analysis
4.7.1. Political Factors
4.7.2. Economic Factors
4.7.3. Social Factors
4.7.4. Legal Factors
4.7.5. Environmental Factors
4.8. Technological Roadmap
4.9. Value Chain Analysis
4.10. Regulatory Landscape by Region
4.10.1. North America
4.10.2. Europe
4.10.3. Asia Pacific
4.10.4. Middle East and Africa
4.10.5. South America
5. Consumer Audio Market Size and Forecast by Segments (by Value USD Million)
5.1. Consumer Audio Market Size and Forecast, By Product (2025-2032)
5.1.1. Earphones
5.1.2. Headphones
5.1.3. True Wireless Earbuds
5.1.4. Speaker Systems
5.1.5. Soundbars
5.1.6. Headsets
5.1.7. Microphones
5.2. Consumer Audio Market Size and Forecast, By Equipment (2025-2032)
5.2.1. Mixers
5.2.2. Amplifiers
5.2.3. Microphones
5.2.4. Audio Monitors
5.2.5. Other
5.3. Consumer Audio Market Size and Forecast, By Application (2025-2032)
5.3.1. Education
5.3.2. Government
5.3.3. Commercial
5.3.4. Industrial
5.3.5. Retail
5.3.6. Hospitality
5.4. Consumer Audio Market Size and Forecast, by Region (2025-2032)
5.4.1. North America
5.4.2. Europe
5.4.3. Asia Pacific
5.4.4. Middle East and Africa
5.4.5. South America
6. North America Consumer Audio Market Size and Forecast (by Value USD Million)
6.1. North America Consumer Audio Market Size and Forecast, By Product (2025-2032)
6.1.1. Earphones
6.1.2. Headphones
6.1.3. True Wireless Earbuds
6.1.4. Speaker Systems
6.1.5. Soundbars
6.1.6. Headsets
6.1.7. Microphones
6.2. North America Consumer Audio Market Size and Forecast, By Equipment (2025-2032)
6.2.1. Mixers
6.2.2. Amplifiers
6.2.3. Microphones
6.2.4. Audio Monitors
6.2.5. Other
6.3. North America Consumer Audio Market Size and Forecast, By Application (2025-2032)
6.3.1. Education
6.3.2. Government
6.3.3. Commercial
6.3.4. Industrial
6.3.5. Retail
6.3.6. Hospitality
6.4. North America Consumer Audio Market Size and Forecast, by Country (2025-2032)
6.4.1. United States
6.4.2. Canada
6.4.3. Mexico
7. Europe Consumer Audio Market Size and Forecast (by Value USD Million)
7.1. Europe Consumer Audio Market Size and Forecast, By Product (2025-2032)
7.2. Europe Consumer Audio Market Size and Forecast, By Equipment (2025-2032)
7.3. Europe Consumer Audio Market Size and Forecast, By Application (2025-2032)
7.4. Europe Consumer Audio Market Size and Forecast, by Country (2025-2032)
7.4.1. UK
7.4.2. France
7.4.3. Germany
7.4.4. Italy
7.4.5. Spain
7.4.6. Sweden
7.4.7. Austria
7.4.8. Rest of Europe
8. Asia Pacific Consumer Audio Market Size and Forecast (by Value USD Million)
8.1. Asia Pacific Consumer Audio Market Size and Forecast, By Product (2025-2032)
8.2. Asia Pacific Consumer Audio Market Size and Forecast, By Equipment (2025-2032)
8.3. Asia Pacific Consumer Audio Market Size and Forecast, By Application (2025-2032)
8.4. Asia Pacific Consumer Audio Market Size and Forecast, by Country (2025-2032)
8.4.1. China
8.4.2. S Korea
8.4.3. Japan
8.4.4. India
8.4.5. Australia
8.4.6. Indonesia
8.4.7. Malaysia
8.4.8. Vietnam
8.4.9. Taiwan
8.4.10. Bangladesh
8.4.11. Pakistan
8.4.12. Rest of Asia Pacific
9. Middle East and Africa Consumer Audio Market Size and Forecast (by Value USD Million)
9.1. Middle East and Africa Consumer Audio Market Size and Forecast, By Product (2025-2032)
9.2. Middle East and Africa Consumer Audio Market Size and Forecast, By Equipment (2025-2032)
9.3. Middle East and Africa Consumer Audio Market Size and Forecast, By Application (2025-2032)
9.4. Middle East and Africa Consumer Audio Market Size and Forecast, by Country (2025-2032)
9.4.1. South Africa
9.4.2. GCC
9.4.3. Egypt
9.4.4. Nigeria
9.4.5. Rest of ME&A
10. South America Consumer Audio Market Size and Forecast (by Value USD Million)
10.1. South America Consumer Audio Market Size and Forecast, By Product (2025-2032)
10.2. South America Consumer Audio Market Size and Forecast, By Equipment (2025-2032)
10.3. South America Consumer Audio Market Size and Forecast, By Application (2025-2032)
10.4. South America Consumer Audio Market Size and Forecast, by Country (2025-2032)
10.4.1. Brazil
10.4.2. Argentina
10.4.3. Rest of South America
11. Company Profile: Key players
11.1. Panasonic Corporation
11.1.1. Company Overview
11.1.2. Product Segment
11.1.2.1. Product Name
11.1.2.2. Product Details (Price, Features, etc.)
11.1.3. Financial Overview
11.1.3.1. Total Revenue
11.1.3.2. Segment Revenue
11.1.3.3. Regional Revenue
11.1.4. SWOT Analysis
11.1.5. Strategic Analysis
11.1.6. Recent Developments
11.2. JVCKENWOOD Corporation
11.3. Trusound Audio
11.4. Skullcandy, Inc
11.5. Apple Inc
11.6. Sennheiser electronic GmbH
11.7. Plantronics, Inc
11.8. Koninklijke Philips N.V
11.9. Onkyo & Pioneer Corporation
11.10. Devialet, Jaybird
11.11. Shure Incorporate
11.12. VOXX International Corp
11.13. SONY India
11.14. Zebronics India Pvt. Ltd
11.15. Boserporation
12. Key Findings
13. Industry Recommendations
13.1. Strategic Recommendations
13.2. Future Outlook