Composite Filling Market Global Industry Analysis and Forecast (2026-2032) by Type, Application, Defect Class Types and, Region
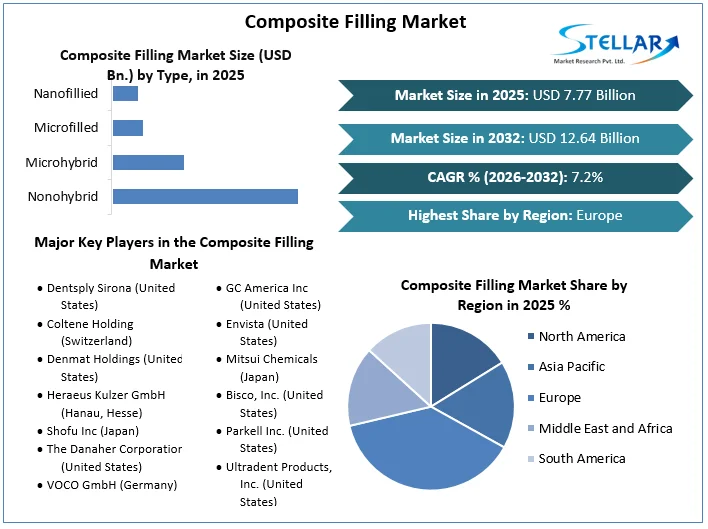
The Composite Filling Market size was valued at US$ 7.77 Billion in 2025 and the Composite Filling revenue is expected to grow at 7.2% through 2026 to 2032, reaching nearly US$ 12.64 Billion.
Composite Filling Market Definition & Overview:
A composite filling is used to repair teeth that have decay, fissures, fractures, or other problems. The decayed or affected part of the tooth will be removed and replaced with a composite filling. There are several filler materials available, each with its own set of advantages and disadvantages. Composite fillings, along with silver amalgam fillings, are the most common nowadays. Because composite fillings may be precisely matched to the color of existing teeth, they are more aesthetically suited for use in front teeth or more exposed areas of the mouth. Composite fillings, like other dental restorations, are not permanent and will eventually need to be replaced. The Composite Filling Market report is the global level market analysis and segmented on the basis of type, application, defect class type and region.
To get more Insights: Request Free Sample Report
Composite Filling Market Dynamics:
The major growth drivers of the composite filling market are the aging population, increasing awareness of oral hygiene, resulting in a worldwide increase in dental check-ups.
Due to inadequate dental care and poor eating habits, tooth decay is one of the most frequent oral illnesses among children and the elderly in developing countries. Dental caries affects around 4.2 billion individuals each year, accounting for roughly half of the world's population, according to the World Dental Federation. About 20% to 30% of the adult population suffers from dental caries and periodontal disease (between 35 to 50 age group). As a result of the high prevalence, demand is likely to grow. Advancements in tooth-filling materials are also likely to drive the Composite Filling Market growth. Amalgam, which has been updated with silver and mercury, is the most often utilized material for composite fillings. The FDA has approved silver amalgam as a long-lasting composite filling.
Amalgam, which has been updated with silver and mercury, is the most often utilized material for dental fillings. The Food and Drug Administration (FDA) has authorized silver amalgam for children aged six and above since it is long-lasting. Composite fillings also employ powdered glass acrylic resin to help match the colour of the teeth. According to the American Dental Association, gold is one of the most durable and costly filling materials available, lasting up to 20 years. Also, increased government initiatives to enhance tooth health are propelling the composite filling market. The National Oral Health Programme, for example, presents the Indian Oral Association's (IDA) objective of improving dental health by 2020. (NOHP).
Composite Filling Market Segment Analysis:
By Type, the market is segmented into nano-hybrid, micro-hybrid, micro-filled, and nano-filled. The nano-hybrid and micro-hybrid segments currently leading the market attributed to factors such as convenience to apply, reduced sitting period, easy availability, and increasing demand from the dentists and dental care organizations. The nano-hybrid and micro-hybrid segments accounted Composite Filling Market share of 26.4% and 36.2% in 2025. This segment is expected to grow at a CAGR of xx % in the forecast period (2026-2032).
Whereas, in 2025, micro-filled and nano-filled segments held shares of 9.8 % and 18.7 % respectively.
By Application, the market is bifurcated into hospitals and dental clinics. The dental clinics market dominated the market in 2025 with a market share of 62.7 %. The growth of the segment is mainly due to factors such as the availability of all the materials and tools for a tooth filling processes at one place and the preference of most of the patients to visit dental clinics. However, the hospital's segment held a market share of 3.1 % in the Composite Filling Market.
Composite Filling Market Regional Insights:
Due to the increased preference for composite fillings over amalgam and the presence of significant dental enterprises in this area, Europe is likely to be the largest market for composite filling for dental restoration over the forecast period. According to the World Health Organization, gum disease affects roughly 20% of the adult population (35 to 44 years old) and 40% of the senior population (65 to 74 years old) (WHO). The rising demand due to prevalence of gum diseases is likely to drive Composite Filling Market growth throughout the forecast period.
Additionally, North America retained the second-largest market share in 2024 owing to greater patient awareness of the disease's severity, supportive reimbursement, and a rise in the number of dental clinics. Also, public support for improving access to dental care in the United States has resulted in the rising use of modern procedures for improved patient care. This is another factor that has a positive influence on regional market growth.
During the same period, APAC is expected to grow significantly during the forecast period. This is mostly due to rapid population growth in crucial countries like India and China, as well as a gradual transition from amalgam to composite fillings. Additionally, the rising demand for frequent dental check-ups to ensure proper oral hygiene is fuelling composite filling growth in this region.
The objective of the report is to present a comprehensive analysis of the Composite Filling Market to the stakeholders in the industry. The report provides trends that are most dominant in the Composite Filling Market and how these trends will influence new business investments and market development throughout the forecast period. The report also aids in the comprehension of the market dynamics and competitive structure of the market by analyzing market leaders, market followers, and regional players.
The qualitative and quantitative data provided in the Composite Filling Market report is to help understand which market segments, regions are expected to grow at higher rates, factors affecting the market, and key opportunity areas, which will drive the industry and market growth through the forecast period. The report also includes the competitive landscape of key players in the industry along with their recent developments in the Composite Filling Market. The report studies factors such as company size, market share, market growth, revenue, production volume, and profits of the key players in the market.
The report provides Porter's Five Force Model, which helps in designing the business strategies in the market. The report helps in identifying how many rivals are existing, who they are, and how their product quality is in the Market. The report also analyses if the Composite Filling Market is easy for a new player to gain a foothold in the market, do they enter or exit the market regularly if the market is dominated by a few players, etc.
The report also includes a PESTEL Analysis, which aids in the development of company strategies. Political variables help in figuring out how much a government can influence the Market. Economic variables aid in the analysis of economic performance drivers that have an impact on the Market. Understanding the impact of the surrounding environment and the influence of environmental concerns on the Composite Filling Market is aided by legal factors.
Composite Filling Market Scope:
|
Composite Filling Market |
|
|
Market Size in 2025 |
USD 7.77 Bn. |
|
Market Size in 2032 |
USD 12.64 Bn. |
|
CAGR (2026-2032) |
7.2% |
|
Historic Data |
2020-2025 |
|
Base Year |
2025 |
|
Forecast Period |
2026-2032 |
|
Segment Scope |
by Type
|
|
by Application
|
|
|
by Defect Class Type
|
|
|
Regional Scope |
North America- United States, Canada, and Mexico Europe – UK, France, Germany, Italy, Spain, Sweden, Austria, and Rest of Europe Asia Pacific – China, India, Japan, South Korea, Australia, ASEAN, Rest of APAC Middle East and Africa - South Africa, GCC, Egypt, Nigeria, Rest of the Middle East and Africa South America – Brazil, Argentina, Rest of South America |
Composite Filling Market Players:
- Dentsply Sirona (United States)
- Coltene Holding (Switzerland)
- Denmat Holdings (United States)
- Heraeus Kulzer GmbH (Hanau, Hesse)
- Shofu Inc (Japan)
- The Danaher Corporation (United States)
- VOCO GmbH (Germany)
- GC America Inc (United States)
- Envista (United States)
- Mitsui Chemicals (Japan)
- Bisco, Inc. (United States)
- Parkell Inc. (United States)
- Ultradent Products, Inc. (United States)
Frequently Asked Questions
The major growth drivers of the composite filling market are the aging population, increasing awareness of oral hygiene, resulting in a worldwide increase in dental check-ups.
Europe is likely to be the largest market for composite filling for dental restoration over the forecast period.
Due to the increased preference for composite fillings over amalgam and the presence of significant dental enterprises in this area.
Dentsply Sirona (United States), Coltene Holding (Switzerland), Denmat Holdings (United States), Heraeus Kulzer GmbH (Hanau, Hesse), and Shofu Inc (Japan).
1. Research Methodology
1.1 Research Data
1.1.1. Primary Data
1.1.2. Secondary Data
1.2. Market Size Estimation
1.2.1. Bottom-Up Approach
1.2.2. Top-Up Approach
1.3. Market Breakdown and Data Triangulation
1.4. Research Assumption
2. Composite Filling Market Executive Summary
2.1. Market Overview
2.2. Market Size (2025) and Forecast (2026– 2032) and Y-O-Y%
2.3. Market Size (USD) and Market Share (%) – By Segments and Regions
3. Global Composite Filling Market: Competitive Landscape
3.1. SMR Competition Matrix
3.2. Key Players Benchmarking
3.2.1. Company Name
3.2.2. Headquarter
3.2.3. Business Segment
3.2.4. End-user Segment
3.2.5. Y-O-Y%
3.2.6. Revenue (2025)
3.2.7. Market Share
3.2.8. Company Locations
3.3. Market Structure
3.3.1. Market Leaders
3.3.2. Market Followers
3.3.3. Emerging Players
3.4. Consolidation of the Market
3.4.1. Strategic Initiatives
3.4.2. Mergers and Acquisitions
3.4.3. Collaborations and Partnerships
3.4.4. Developments and Innovations
4. Composite Filling Market: Dynamics
4.1. Composite Filling Market Trends by Region
4.1.1. North America
4.1.2. Europe
4.1.3. Asia Pacific
4.1.4. Middle East and Africa
4.1.5. South America
4.2. Composite Filling Market Drivers
4.3. Composite Filling Market Restraints
4.4. Composite Filling Market Opportunities
4.5. Composite Filling Market Challenges
4.6. PORTER’s Five Forces Analysis
4.6.1. Intensity of the Rivalry
4.6.2. Threat of New Entrants
4.6.3. Bargaining Power of Suppliers
4.6.4. Bargaining Power of Buyers
4.6.5. Threat of Substitutes
4.7. PESTLE Analysis
4.7.1. Political Factors
4.7.2. Economic Factors
4.7.3. Social Factors
4.7.4. Legal Factors
4.7.5. Environmental Factors
4.8. Technological Roadmap
4.9. Regulatory Landscape by Region
4.9.1. North America
4.9.2. Europe
4.9.3. Asia Pacific
4.9.4. Middle East and Africa
4.9.5. South America
5. Composite Filling Market: Global Market Size and Forecast by Segmentation (by Value in USD Million) (2025-2032)
5.1. Composite Filling Market Size and Forecast, by Type (2025-2032)
5.1.1. Nonohybrid
5.1.2. Microhybrid
5.1.3. Microfilled
5.1.4. Nanofillied
5.2. Composite Filling Market Size and Forecast, by Application (2025-2032)
5.2.1. Hospitals
5.2.2. Dental Clinics
5.3. Composite Filling Market Size and Forecast, by Defect Class Type (2025-2032)
5.3.1. Class 1
5.3.2. Class 2
5.3.3. Class 3
5.3.4. Class 4
5.3.5. Class 5
5.4. Composite Filling Market Size and Forecast, by Region (2025-2032)
5.4.1. North America
5.4.2. Europe
5.4.3. Asia Pacific
5.4.4. Middle East and Africa
5.4.5. South America
6. North America Composite Filling Market Size and Forecast by Segmentation (by Value in USD Million) (2025-2032)
6.1. North America Composite Filling Market Size and Forecast, by Type (2025-2032)
6.1.1. Nonohybrid
6.1.2. Microhybrid
6.1.3. Microfilled
6.1.4. Nanofillied
6.2. North America Composite Filling Market Size and Forecast, by Application (2025-2032)
6.2.1. Hospitals
6.2.2. Dental Clinics
6.3. North America Composite Filling Market Size and Forecast, by Defect Class Type (2025-2032)
6.3.1. Class 1
6.3.2. Class 2
6.3.3. Class 3
6.3.4. Class 4
6.3.5. Class 5
6.4. North America Composite Filling Market Size and Forecast, by Country (2025-2032)
6.4.1. United States
6.4.2. Canada
6.4.3. Mexico
7. Europe Composite Filling Market Size and Forecast by Segmentation (by Value in USD Million) (2025-2032)
7.1. Europe Composite Filling Market Size and Forecast, by Type (2025-2032)
7.2. Europe Composite Filling Market Size and Forecast, by Application (2025-2032)
7.3. Europe Composite Filling Market Size and Forecast, by Defect Class Type (2025-2032)
7.4. Europe Composite Filling Market Size and Forecast, by Country (2025-2032)
7.4.1. United Kingdom
7.4.2. France
7.4.3. Germany
7.4.4. Italy
7.4.5. Spain
7.4.6. Sweden
7.4.7. Austria
7.4.8. Rest of Europe
8. Asia Pacific Composite Filling Market Size and Forecast by Segmentation (by Value in USD Million) (2025-2032)
8.1. Asia Pacific Composite Filling Market Size and Forecast, by Type (2025-2032)
8.2. Asia Pacific Composite Filling Market Size and Forecast, by Application (2025-2032)
8.3. Asia Pacific Composite Filling Market Size and Forecast, by Defect Class Type (2025-2032)
8.4. Asia Pacific Composite Filling Market Size and Forecast, by Country (2025-2032)
8.4.1. China
8.4.2. S Korea
8.4.3. Japan
8.4.4. India
8.4.5. Australia
8.4.6. Indonesia
8.4.7. Malaysia
8.4.8. Vietnam
8.4.9. Taiwan
8.4.10. Rest of Asia Pacific
9. Middle East and Africa Composite Filling Market Size and Forecast by Segmentation (by Value in USD Million) (2025-2032)
9.1. Middle East and Africa Composite Filling Market Size and Forecast, by Type (2025-2032)
9.2. Middle East and Africa Composite Filling Market Size and Forecast, by Application (2025-2032)
9.3. Middle East and Africa Composite Filling Market Size and Forecast, by Defect Class Type (2025-2032)
9.4. Middle East and Africa Composite Filling Market Size and Forecast, by Country (2025-2032)
9.4.1. South Africa
9.4.2. GCC
9.4.3. Nigeria
9.4.4. Rest of ME&A
10. South America Composite Filling Market Size and Forecast by Segmentation (by Value in USD Million) (2025-2032)
10.1. South America Composite Filling Market Size and Forecast, by Type (2025-2032)
10.2. South America Composite Filling Market Size and Forecast, by Application (2025-2032)
10.3. South America Composite Filling Market Size and Forecast, by Defect Class Type (2025-2032)
10.4. South America Composite Filling Market Size and Forecast, by Country (2025-2032)
10.4.1. Brazil
10.4.2. Argentina
10.4.3. Rest Of South America
11. Company Profile: Key Players
11.1. Dentsply Sirona (United States)
11.1.1. Company Overview
11.1.2. Business Portfolio
11.1.3. Financial Overview
11.1.3.1. Total Revenue
11.1.3.2. Segment Revenue
11.1.3.3. Regional Revenue
11.1.4. SWOT Analysis
11.1.5. Strategic Analysis
11.1.6. Recent Developments
11.2. Coltene Holding (Switzerland)
11.3. Denmat Holdings (United States)
11.4. Heraeus Kulzer GmbH (Hanau, Hesse)
11.5. Shofu Inc (Japan)
11.6. The Danaher Corporation (United States)
11.7. VOCO GmbH (Germany)
11.8. GC America Inc (United States)
11.9. Envista (United States)
11.10. Mitsui Chemicals (Japan)
11.11. Bisco, Inc. (United States)
11.12. Parkell Inc. (United States)
11.13. Ultradent Products, Inc. (United States)
12. Key Findings
13. Analyst Recommendations
13.1. Strategic Recommendations
13.2. Future Outlook


