Chemical Imaging Market Global Research Analysis and Forecast (2026-2032) Emerging Opportunities
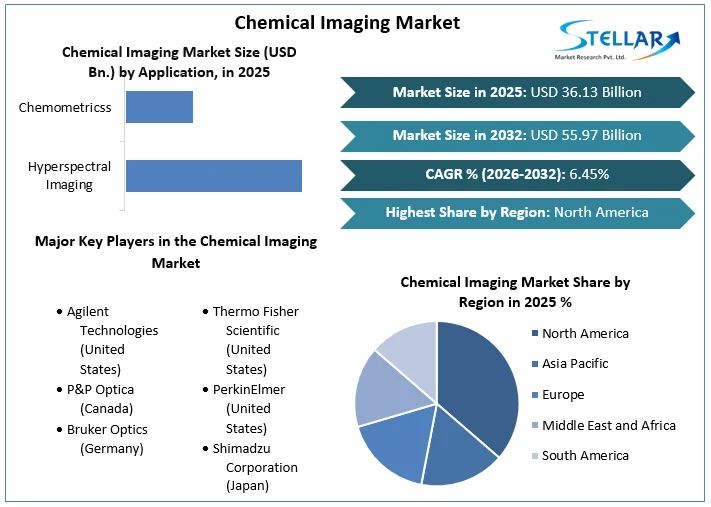
Chemical Imaging Market size was valued at US $ 36.13 Billion in 2025 and the Chemical Imaging Market revenue is expected to grow at 6.45% through 2026 to 2032, reaching nearly US $ 55.97 Billion. The report analyzes chemical imaging market dynamics by region, application, and software.
Chemical Imaging Market Overview:
Chemical imaging is a method of generating a visual image of component distribution adopting sequential spectral and spatial temporal data. Hyperspectral imaging, in contrast to multispectral imaging, which measures dispersed spectral bands, measures continuous spectral bands. Chemical imaging is based on the idea that an analyst can obtain as many data spectrum measurements at a particular chemical component in a given spatial location as possible in a given amount of time; this is vital for chemical identification and quantification.
Alternatively, if the spectral fingerprints of sample components differ at the selected data spectrum, mapping the geographic distribution of sample components can be done by selecting an image plane at that data spectrum. A radiation source to illuminate the sample, a spectrally selective element, and usually a detector array (the camera) to capture the images are the three components of imaging instrumentation.
A hypercube is a type of data format. The data set can be displayed as a data cube, a three-dimensional block of data with two spatial dimensions (x and y) and a third (spectral) axis made up of a sequence of wavelengths (lambda). A sequence of spectrally resolved images (each image plane matching to the image at one wavelength) or a series of spatially resolved spectra can be seen and computationally handled as a hypercube.
To get more Insights: Request Free Sample Report
Chemical Imaging Market Dynamics:
Its key working principles:
Chemical imaging is based on the same principles as vibrational spectroscopic techniques, but it adds more information by simultaneously obtaining spatially resolved spectra. It combines the advantages of digital imaging with the properties of spectroscopy. Vibrational spectroscopy, in a nutshell, is a technique for determining how light interacts with matter. When photons collide with a sample, they are either absorbed or scattered; absorbed photons have a certain energy, and the pattern of absorption provides information, or a fingerprint, on the molecules in the sample.
Chemical imaging, on the other hand, can be done in one of four observational setups: emission (fluorescence), (optical) absorption, (optical) transmission, or (optical) scattering (Raman). The fluorescence (emission) and Raman scattering phases are the most sensitive and powerful, but they are also the most expensive.
Unique application of Chemical Imaging:
Hyperspectral imaging is most typically used on solid or gel samples, with applications in biology, chemistry, medicine, pharmacy, and food science, as well as biotechnology and agriculture. NIR, IR, and Raman chemical imaging are referred to as hyperspectral, spectroscopic, spectral, or multispectral imaging. Other ultra-sensitive and selective imaging techniques are also in use, such as UV-visible or fluorescent micro spectroscopy.
Many imaging techniques can be used to explore samples of different sizes, ranging from single molecules to cellular images in medicine and biology, and images of celestial bodies in astronomy, but diverse instrumentation is necessary to develop observations on such a wide range of systems.
Detection limits:
Chemical imaging has a different detection limit than bulk spectroscopy since the sample determines it. Because one bulk spectrum represents a mean of the elements present, the spectral signatures of trace components are simply suppressed by dilution. In imaging, on the other hand, each pixel has a spectrum that is comparable. If the physical size of the trace contaminant is on the order of the pixel size imaged on the sample, its spectral signature will most likely be recognized.
If the trace component is distributed equally (relative to pixel image size) throughout a sample, it will be undetectable. As a result, the detection limitations of chemical imaging techniques are influenced by particle size, chemical and geographical heterogeneity of the sample, and image spatial resolution.
Chemical Imaging Market Segmentation:
Based on Software: In terms of revenue, the FECOM Object Learning Software sector was dominating in 2025, accounting for over xx% of the global market. This is because to its ability to grab and study items in a large amount of time with little errors.
Based on Application: By 2025, the hyperspectral imaging segment dominated the market, accounting for over xx% of total sales. This is because of its analytical ability to build a visual depiction of the components that are being distributed based on the simultaneous comprehension of time, spatial, and spectral information.
Chemical Imaging Market Regional Insights:
North America is expected to lead the chemical imaging market, accounting for a major percentage of the revenue (xx%). Over the forecast period, the presence of sophisticated diagnostic technologies, as well as higher per capita expenditure capabilities, are expected to drive market growth. The Asia Pacific is expected to undergo significant development in the near future. Emerging economies in the region, such as China, India, and North Korea, are expected to have rapid financial growth. Detailed information about each region is also covered in the SMR’s report.
The objective of the report is to present a comprehensive analysis of the Chemical Imaging Market to the stakeholders in the industry. The report provides trends that are most dominant in the Chemical Imaging Market and how these trends will influence new business investments and market development throughout the forecast period. The report also aids in the comprehension of the Chemical Imaging Market dynamics and competitive structure of the market by analyzing market leaders, market followers, and regional players.
The qualitative and quantitative data provided in the Chemical Imaging Market report is to help understand which market segments, regions are expected to grow at higher rates, factors affecting the market, and key opportunity areas, which will drive the industry and market growth through the forecast period. The report also includes the competitive landscape of key players in the industry along with their recent developments in the Chemical Imaging Market. The report studies factors such as company size, market share, market growth, revenue, production volume, and profits of the key players in the Chemical Imaging Market.
The report provides Porter's Five Force Model, which helps in designing the business strategies in the market. The report helps in identifying how many rivals are existing, who they are, and how their product quality is in the Market. The report also analyses if the Chemical Imaging Market is easy for a new player to gain a foothold in the market, do they enter or exit the market regularly if the market is dominated by a few players, etc.
The report also includes a PESTEL Analysis, which aids in the development of company strategies. Political variables help in figuring out how much a government can influence the Market. Economic variables aid in the analysis of economic performance drivers that have an impact on the Market. Understanding the impact of the surrounding environment and the influence of environmental concerns on the Chemical Imaging Market is aided by legal factors.
Chemical Imaging Market Scope:
|
Chemical Imaging Market |
|
|
Market Size in 2025 |
USD 36.13 Bn. |
|
Market Size in 2032 |
USD 55.97 Bn. |
|
CAGR (2026-2032) |
6.45% |
|
Historic Data |
2020-2025 |
|
Base Year |
2025 |
|
Forecast Period |
2026-2032 |
|
Segment Scope |
By Application
|
|
By Software
|
|
|
|
North America- United States, Canada, and Mexico Europe – UK, France, Germany, Italy, Spain, Sweden, Austria, and Rest of Europe Asia Pacific – China, India, Japan, South Korea, Australia, ASEAN, Rest of APAC Middle East and Africa - South Africa, GCC, Egypt, Nigeria, Rest of the Middle East and Africa South America – Brazil, Argentina, Rest of South America |
Chemical Imaging Market Key Players
- Agilent Technologies (United States)
- P&P Optica (Canada)
- Bruker Optics (Germany)
- Thermo Fisher Scientific (United States)
- PerkinElmer (United States)
- Shimadzu Corporation (Japan)
- Others
Frequently Asked Questions
The limit of detection for chemical imaging is the only key factor expected to hinder the growth of the market during the forecast period.
The Chemical imaging market is expected to grow at a CAGR of 6.45% during the forecast period (2026-2032).
The unique applications of chemical imaging in different diagnostic sectors and its key working principle are the factor expected to drive the growth of the market during the forecast period.
Agilent Technologies (United States), P&P Optica (Canada), Bruker Optics (Germany), Thermo Fisher Scientific (United States), PerkinElmer (United States), Shimadzu Corporation (Japan), and Others are key players covered.
1. Research Methodology
1.1 Research Data
1.1.1. Primary Data
1.1.2. Secondary Data
1.2. Market Size Estimation
1.2.1. Bottom-Up Approach
1.2.2. Top-Up Approach
1.3. Market Breakdown and Data Triangulation
1.4. Research Assumption
2. Chemical Imaging Market Executive Summary
2.1. Market Overview
2.2. Market Size (2025) and Forecast (2026 – 2032) and Y-O-Y%
2.3. Market Size (USD) and Market Share (%) – By Segments and Regions
3. Global Chemical Imaging Market: Competitive Landscape
3.1. SMR Competition Matrix
3.2. Key Players Benchmarking
3.2.1. Company Name
3.2.2. Headquarter
3.2.3. Service Segment
3.2.4. End-user Segment
3.2.5. Y-O-Y%
3.2.6. Revenue (2025)
3.2.7. Market Share
3.2.8. Company Locations
3.3. Market Structure
3.3.1. Market Leaders
3.3.2. Market Followers
3.3.3. Emerging Players
3.4. Consolidation of the Market
3.4.1. Strategic Initiatives and Developments
3.4.2. Mergers and Acquisitions
3.4.3. Collaborations and Partnerships
3.4.4. Product Launches and Innovations
4. Chemical Imaging Market: Dynamics
4.1. Chemical Imaging Market Trends by Region
4.1.1. North America
4.1.2. Europe
4.1.3. Asia Pacific
4.1.4. Middle East and Africa
4.1.5. South America
4.2. Chemical Imaging Market Drivers
4.3. Chemical Imaging Market Restraints
4.4. Chemical Imaging Market Opportunities
4.5. Chemical Imaging Market Challenges
4.6. PORTER’s Five Forces Analysis
4.6.1. Intensity of the Rivalry
4.6.2. Threat of New Entrants
4.6.3. Bargaining Power of Suppliers
4.6.4. Bargaining Power of Buyers
4.6.5. Threat of Substitutes
4.7. PESTLE Analysis
4.7.1. Political Factors
4.7.2. Economic Factors
4.7.3. Social Factors
4.7.4. Technological Factors
4.7.5. Legal Factors
4.7.6. Environmental Factors
4.8. Technological Roadmap
4.9. Regulatory Landscape
4.9.1. Market Regulation by Region
4.9.1.1. North America
4.9.1.2. Europe
4.9.1.3. Asia Pacific
4.9.1.4. Middle East and Africa
4.9.1.5. South America
4.9.2. Impact of Regulations on Market Dynamics
4.9.3. Government Schemes and Initiatives
5. Chemical Imaging Market: Global Market Size and Forecast by Segmentation (by Value in USD Million) (2025-2032)
5.1. Chemical Imaging Market Size and Forecast, by Application (2025-2032)
5.1.1. Hyperspectral Imaging
5.1.2. Chemometricss
5.2. Chemical Imaging Market Size and Forecast, by Software (2025-2032)
5.2.1. FECOM Object Learning Software (OLS)
5.2.2. UmBio Evince Image
5.2.3. Perception System
5.3. Chemical Imaging Market Size and Forecast, by Region (2025-2032)
5.3.1. North America
5.3.2. Europe
5.3.3. Asia Pacific
5.3.4. Middle East and Africa
5.3.5. South America
6. North America Chemical Imaging Market Size and Forecast by Segmentation (by Value in USD Million) (2025-2032)
6.1. North America Chemical Imaging Market Size and Forecast, by Application (2025-2032)
6.1.1. Hyperspectral Imaging
6.1.2. Chemometricss
6.2. North America Chemical Imaging Market Size and Forecast, by Software (2025-2032)
6.2.1. FECOM Object Learning Software (OLS)
6.2.2. UmBio Evince Image
6.2.3. Perception System
6.3. North America Chemical Imaging Market Size and Forecast, by Country (2025-2032)
6.3.1. United States
6.3.2. Canada
6.3.3. Mexico
7. Europe Chemical Imaging Market Size and Forecast by Segmentation (by Value in USD Million) (2025-2032)
7.1. Europe Chemical Imaging Market Size and Forecast, by Application (2025-2032)
7.2. Europe Chemical Imaging Market Size and Forecast, by Software (2025-2032)
7.3. Europe Chemical Imaging Market Size and Forecast, by Country (2025-2032)
7.3.1. United Kingdom
7.3.2. France
7.3.3. Germany
7.3.4. Italy
7.3.5. Spain
7.3.6. Sweden
7.3.7. Austria
7.3.8. Rest of Europe
8. Asia Pacific Chemical Imaging Market Size and Forecast by Segmentation (by Value in USD Million) (2025-2032)
8.1. Asia Pacific Chemical Imaging Market Size and Forecast, by Application (2025-2032)
8.2. Asia Pacific Chemical Imaging Market Size and Forecast, by Software (2025-2032)
8.3. Asia Pacific Chemical Imaging Market Size and Forecast, by Country (2025-2032)
8.3.1. China
8.3.2. S Korea
8.3.3. Japan
8.3.4. India
8.3.5. Australia
8.3.6. Indonesia
8.3.7. Malaysia
8.3.8. Vietnam
8.3.9. Taiwan
8.3.10. Rest of Asia Pacific
9. Middle East and Africa Chemical Imaging Market Size and Forecast by Segmentation (by Value in USD Million) (2025-2032)
9.1. Middle East and Africa Chemical Imaging Market Size and Forecast, by Application (2025-2032)
9.2. Middle East and Africa Chemical Imaging Market Size and Forecast, by Software (2025-2032)
9.3. Middle East and Africa Chemical Imaging Market Size and Forecast, by Country (2025-2032)
9.3.1. South Africa
9.3.2. GCC
9.3.3. Nigeria
9.3.4. Rest of ME&A
10. South America Chemical Imaging Market Size and Forecast by Segmentation (by Value in USD Million) (2025-2032)
10.1. South America Chemical Imaging Market Size and Forecast, by Application (2025-2032)
10.2. South America Chemical Imaging Market Size and Forecast, by Software (2025-2032)
10.3. South America Chemical Imaging Market Size and Forecast, by Country (2025-2032)
10.3.1. Brazil
10.3.2. Argentina
10.3.3. Rest Of South America
11. Company Profile: Key Players
11.1. Agilent Technologies (United States)
11.1.1. Company Overview
11.1.2. Business Portfolio
11.1.3. Financial Overview
11.1.3.1. Total Revenue
11.1.3.2. Segment Revenue
11.1.3.3. Regional Revenue
11.1.4. SWOT Analysis
11.1.5. Strategic Analysis
11.1.6. Recent Developments
11.2. P&P Optica (Canada)
11.3. Bruker Optics (Germany)
11.4. Thermo Fisher Scientific (United States)
11.5. PerkinElmer (United States)
11.6. Shimadzu Corporation (Japan)
11.7. Others
12. Key Findings
13. Analyst Recommendations
13.1. Strategic Recommendations
13.2. Future Outlook