Cardiac Valve Market Global Industry Analysis and Forecast (2026-2032) by Type, End-User, and, Region
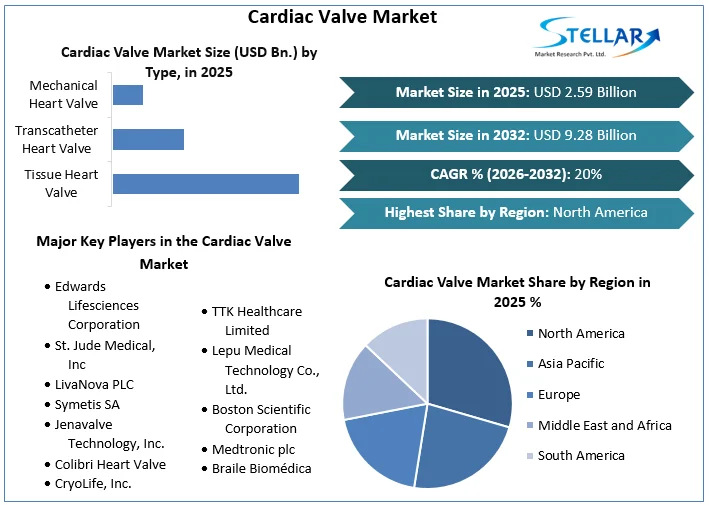
Cardiac Valve Market size was valued at US$ 2.59 Billion in 2025 and the Cardiac Valve revenue is expected to grow at 20% through 2026 to 2032, reaching nearly US$ 9.28 Billion.
Cardiac Valve Market Definition & Overview:
A one-way valve inserted into a patient's heart to replace a defective native heart valve is known as an artificial heart valve or cardiac valve. The tricuspid valve, pulmonic valve, mitral valve, and aortic valve are the four valves that contain the human heart. Their primary function is to maintain blood flow in one direction through the heart and out of the heart into the major blood arteries that supply it (the pulmonary artery and the aorta). Heart valves can fail for several causes, obstructing blood flow and/or allowing blood to flow backward through the valve (stenosis). Both procedures impose a load on the heart and can result in significant complications, such as heart failure. We as Stellar Marker Research provided the segment and size analysis along with the forecast values in cardiac valve market report on the basis of type, end-user and region.
To get more Insights: Request Free Sample Report
Cardiac Valve Market Dynamics:
Over the forecast period, the global Cardiac valve market is expected to grow due to the rising prevalence of valvular heart disease (VHD). According to the study 'Epidemiology and Trends of Aortic Stenosis Mortality in the United States (1999-2016)' published in the Journal of the American College of Cardiology in March 2019, aortic stenosis is linked to a mortality rate of 106.3 per 1 million people, with non-Hispanic whites having the highest mortality rate, followed by Hispanics, and non-Hispanic blacks.
Additionally, rising healthcare spending is expected to help the cardiac valve market grow. According to the Centers for Medicare & Medicaid Services (CMS), health expenditure in the United States is expected to expand at a 5.5 %annual pace from 2018 to 2027, reaching almost US$ 6.0 trillion.
Restraints:
The global cardiac valve market is expected to be hampered by the high cost of transcatheter heart valve devices. Transcatheter aortic valve replacement (TAVR) devices, for example, cost roughly $32,000 on average, compared to $4,000–$7,000 for surgical valve devices, and the average cost of TAVR and surgical surgery is US$ 37,900 and US$ 14,200, respectively. However, problems associated with operations are expected to impede market growth. Bleeding, stroke, blood vessel issues, renal illness, heart rhythm irregularities (arrhythmias), heart attack, and infection are all possible consequences of TAVR.
Opportunities:
The survival rate for mitral valve replacement is high among senior patients with valvular heart disease, which is expected to drive demand for advanced prosthetic mitral valve implantation devices, providing attractive growth potential for cardiac valve market participants. During anticoagulant therapy, pregnant women who have a prosthetic mechanical heart valve are at a higher risk of problems such as thrombosis. As a result, manufacturers may concentrate on creating alternative cardiac valves for pregnant women that do not require anticoagulant medication treatment after implantation.
Cardiac Valve Market Segment Analysis:
During the forecast period, the transcatheter cardiac valve segment is expected to grow at a rapid pace.
The transcatheter cardiac valve sector is expected to account for a sizable portion of the worldwide market, thanks to factors such as ease of installation, an increase in the number of transcatheter cardiac valve surgical centres, and an increase in the patient population. The use of transcatheter heart valves for novel indications (treatment of intermediate-risk patients and high-risk patients) is likely to give several chances for market growth throughout the forecast period. In addition, the cardiac valve market for transcatheter cardiac valves is expected to grow due to an increase in the acceptance rate for the operation and new device approvals.
Cardiac Valve Market Regional Insights:
North America is expected to maintain its dominance of the global market, accounting for more than two-fifths of the total. The market is expected to rise as more people use technologically enhanced heart valve repair devices to shorten treatment times and procedures. Additionally, rising FDA approvals of transcatheter aortic valves are improving revenue shares of major market participants, enhancing the total heart valve devices market. During the forecast period, the North American cardiac valve market is expected to grow at a CAGR of 13.7 percent.
Following North America is Asia-Pacific, which has the potential to expand. Market participants' large investments and improvements in healthcare infrastructure are two major growth factors. Mechanical heart devices are expected to gain the largest share of the market in terms of volume, owing to increasing life expectancy and low pricing. During the forecast period, the Asia-Pacific cardiac valve market is expected to grow at a CAGR of 14.4%.
The objective of the report is to present a comprehensive analysis of the Cardiac Valve Market to the stakeholders in the industry. The report provides trends that are most dominant in the Cardiac Valve Market and how these trends will influence new business investments and market development throughout the forecast period. The report also aids in the comprehension of the global market dynamics and competitive structure of the market by analyzing market leaders, market followers, and regional players.
The qualitative and quantitative data provided in the Cardiac Valve Market report is to help understand which market segments, regions are expected to grow at higher rates, factors affecting the market, and key opportunity areas, which will drive the industry and market growth through the forecast period. The report also includes the competitive landscape of key players in the industry along with their recent developments in the Cardiac Valve Market. The report studies factors such as company size, market share, market growth, revenue, production volume, and profits of the key players in the global market.
The report provides Porter's Five Force Model, which helps in designing the business strategies in the market. The report helps in identifying how many rivals are existing, who they are, and how their product quality is in the Market. The report also analyses if the Cardiac Valve Market is easy for a new player to gain a foothold in the market, do they enter or exit the market regularly if the market is dominated by a few players, etc.
The report also includes a PESTEL Analysis, which aids in the development of company strategies. Political variables help in figuring out how much a government can influence the Market. Economic variables aid in the analysis of economic performance drivers that have an impact on the Market. Understanding the impact of the surrounding environment and the influence of environmental concerns on the Cardiac Valve Market is aided by legal factors.
Cardiac Valve Market Scope:
|
Cardiac Valve Market |
|
|
Market Size in 2025 |
USD 2.59 Bn. |
|
Market Size in 2032 |
USD 9.28 Bn. |
|
CAGR (2026-2032) |
20% |
|
Historic Data |
2020--2025 |
|
Base Year |
2025 |
|
Forecast Period |
2026-2032 |
|
Segment Scope |
by Type
|
|
By End-User
|
|
|
Regional Scope |
North America- United States, Canada, and Mexico Europe – UK, France, Germany, Italy, Spain, Sweden, Austria, and Rest of Europe Asia Pacific – China, India, Japan, South Korea, Australia, ASEAN, Rest of APAC Middle East and Africa - South Africa, GCC, Egypt, Nigeria, Rest of the Middle East and Africa South America – Brazil, Argentina, Rest of South America |
Cardiac Valve Market Players:
- Edwards Lifesciences Corporation
- St. Jude Medical, Inc
- LivaNova PLC
- Symetis SA
- Jenavalve Technology, Inc.
- Colibri Heart Valve
- CryoLife, Inc.
- TTK Healthcare Limited
- Lepu Medical Technology Co., Ltd.
- Boston Scientific Corporation
- Medtronic plc
- Braile Biomédica
Frequently Asked Questions
Over the forecast period, the global Cardiac valve market is expected to grow due to the rising prevalence of valvular heart disease (VHD).
North America is expected to maintain its dominance of the global heart valve devices market, accounting for more than two-fifths of the total.
Market participants' large investments and improvements in healthcare infrastructure are two major growth factors.
Edwards Lifesciences Corporation, St. Jude Medical, Inc, LivaNova PLC, Symetis SA, Jenavalve Technology, Inc. , and Colibri Heart Valve.
1. Research Methodology
1.1 Research Data
1.1.1. Primary Data
1.1.2. Secondary Data
1.2. Market Size Estimation
1.2.1. Bottom-Up Approach
1.2.2. Top-Up Approach
1.3. Market Breakdown and Data Triangulation
1.4. Research Assumption
2. Cardiac Valve Market Executive Summary
2.1. Market Overview
2.2. Market Size (2025) and Forecast (2026-2032) and Y-O-Y%
2.3. Market Size (USD) and Market Share (%) – By Segments and Regions
3. Global Cardiac Valve Market: Competitive Landscape
3.1. SMR Competition Matrix
3.2. Key Players Benchmarking
3.2.1. Company Name
3.2.2. Headquarter
3.2.3. Business Segment
3.2.4. End-user Segment
3.2.5. Y-O-Y%
3.2.6. Revenue (2025)
3.2.7. Company Locations
3.3. Market Structure
3.3.1. Market Leaders
3.3.2. Market Followers
3.3.3. Emerging Players
3.4. Consolidation of the Market
3.4.1. Strategic Initiatives
3.4.2. Mergers and Acquisitions
3.4.3. Collaborations and Partnerships
3.4.4. Developments and Innovations
4. Cardiac Valve Market: Dynamics
4.1. Cardiac Valve Market Trends by Region
4.1.1. North America
4.1.2. Europe
4.1.3. Asia Pacific
4.1.4. Middle East and Africa
4.1.5. South America
4.2. Cardiac Valve Market Drivers
4.3. Cardiac Valve Market Restraints
4.4. Cardiac Valve Market Opportunities
4.5. Cardiac Valve Market Challenges
4.6. PORTER’s Five Forces Analysis
4.6.1. Intensity of the Rivalry
4.6.2. Threat of New Entrants
4.6.3. Bargaining Power of Suppliers
4.6.4. Bargaining Power of Buyers
4.6.5. Threat of Substitutes
4.7. PESTLE Analysis
4.7.1. Political Factors
4.7.2. Economic Factors
4.7.3. Social Factors
4.7.4. Technological Factors
4.7.5. Legal Factors
4.7.6. Environmental Factors
4.8. Technological Roadmap
4.9. Regulatory Landscape
4.9.1. Market Regulation by Region
4.9.1.1. North America
4.9.1.2. Europe
4.9.1.3. Asia Pacific
4.9.1.4. Middle East and Africa
4.9.1.5. South America
4.9.2. Impact of Regulations on Market Dynamics
4.9.3. Government Schemes and Initiatives
5. Cardiac Valve Market: Global Market Size and Forecast by Segmentation (by Value in USD Million) (2025-2032)
5.1. Cardiac Valve Market Size and Forecast, by Type (2025-2032)
5.1.1. Tissue Heart Valve
5.1.2. Transcatheter Heart Valve
5.1.3. Mechanical Heart Valve
5.2. Cardiac Valve Market Size and Forecast, by End-User (2025-2032)
5.2.1. Hospitals
5.2.2. Specialty Clinics
5.2.3. Others
5.3. Cardiac Valve Market Size and Forecast, by Region (2025-2032)
5.3.1. North America
5.3.2. Europe
5.3.3. Asia Pacific
5.3.4. Middle East and Africa
5.3.5. South America
6. North America Cardiac Valve Market Size and Forecast by Segmentation (by Value in USD Million) (2025-2032)
6.1. North America Cardiac Valve Market Size and Forecast, by Type (2025-2032)
6.1.1. Tissue Heart Valve
6.1.2. Transcatheter Heart Valve
6.1.3. Mechanical Heart Valve
6.2. North America Cardiac Valve Market Size and Forecast, by End-User (2025-2032)
6.2.1. Hospitals
6.2.2. Specialty Clinics
6.2.3. Others
6.3. North America Cardiac Valve Market Size and Forecast, by Country (2025-2032)
6.3.1. United States
6.3.2. Canada
6.3.3. Mexico
7. Europe Cardiac Valve Market Size and Forecast by Segmentation (by Value in USD Million) (2025-2032)
7.1. Europe Cardiac Valve Market Size and Forecast, by Type (2025-2032)
7.2. Europe Cardiac Valve Market Size and Forecast, by End-User (2025-2032)
7.3. Europe Cardiac Valve Market Size and Forecast, by Country (2025-2032)
7.3.1. United Kingdom
7.3.2. France
7.3.3. Germany
7.3.4. Italy
7.3.5. Spain
7.3.6. Sweden
7.3.7. Austria
7.3.8. Rest of Europe
8. Asia Pacific Cardiac Valve Market Size and Forecast by Segmentation (by Value in USD Million) (2025-2032)
8.1. Asia Pacific Cardiac Valve Market Size and Forecast, by Type (2025-2032)
8.2. Asia Pacific Cardiac Valve Market Size and Forecast, by End-User (2025-2032)
8.3. Asia Pacific Cardiac Valve Market Size and Forecast, by Country (2025-2032)
8.3.1. China
8.3.2. S Korea
8.3.3. Japan
8.3.4. India
8.3.5. Australia
8.3.6. Indonesia
8.3.7. Malaysia
8.3.8. Vietnam
8.3.9. Taiwan
8.3.10. Rest of Asia Pacific
9. Middle East and Africa Cardiac Valve Market Size and Forecast by Segmentation (by Value in USD Million) (2025-2032)
9.1. Middle East and Africa Cardiac Valve Market Size and Forecast, by Type (2025-2032)
9.2. Middle East and Africa Cardiac Valve Market Size and Forecast, by End-User (2025-2032)
9.3. Middle East and Africa Cardiac Valve Market Size and Forecast, by Country (2025-2032)
9.3.1. South Africa
9.3.2. GCC
9.3.3. Nigeria
9.3.4. Rest of ME&A
10. South America Cardiac Valve Market Size and Forecast by Segmentation (by Value in USD Million) (2025-2032)
10.1. South America Cardiac Valve Market Size and Forecast, by Type (2025-2032)
10.2. South America Cardiac Valve Market Size and Forecast, by End-User (2025-2032)
10.3. South America Cardiac Valve Market Size and Forecast, by Country (2025-2032)
10.3.1. Brazil
10.3.2. Argentina
10.3.3. Rest Of South America
11. Company Profile: Key Players
11.1. Edwards Lifesciences Corporation
11.1.1. Company Overview
11.1.2. Business Portfolio
11.1.3. Financial Overview
11.1.3.1. Total Revenue
11.1.3.2. Segment Revenue
11.1.3.3. Regional Revenue
11.1.4. SWOT Analysis
11.1.5. Strategic Analysis
11.1.6. Recent Developments
11.2. St. Jude Medical, Inc
11.3. LivaNova PLC
11.4. Symetis SA
11.5. Jenavalve Technology, Inc.
11.6. Colibri Heart Valve
11.7. CryoLife, Inc.
11.8. TTK Healthcare Limited
11.9. Lepu Medical Technology Co., Ltd.
11.10. Boston Scientific Corporation
11.11. Medtronic plc
11.12. Braile Biomédica
12. Key Findings
13. Analyst Recommendations
13.1. Strategic Recommendations
13.2. Future Outlook


