Biometrics in Automotive Market Perspective on Upcoming Impacts and Forecast Analysis (2025-2032) by Product Type, Function Type, End User, Component, and Region
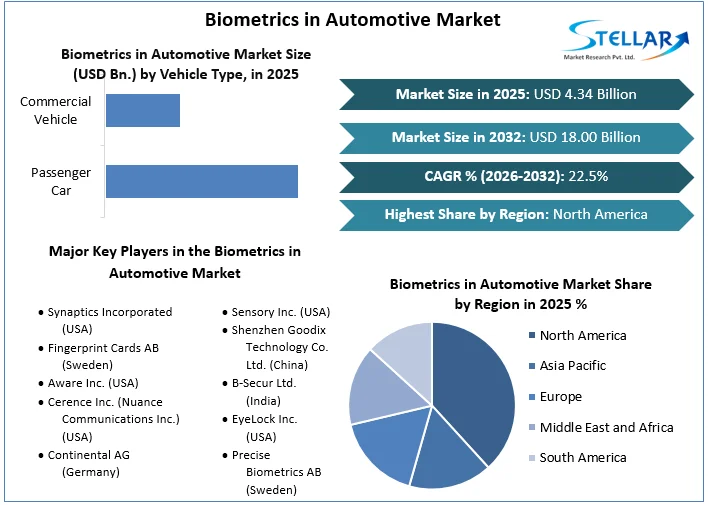
Biometrics in Automotive Market size was valued at US$ 4.34 Billion in 2025 and the total Biometrics in Automotive Market revenue is expected to grow at 22.5% through 2026 to 2032. reaching nearly US$ 18.00 Billion.
Biometrics in Automotive Market Overview:
Biometrics are used in various areas in the automotive industry, including access control for stating a vehicle using various biometric scanners, enable personalized vehicles for users to call up playlists, contacts, and preferred apps, and the use of these biometrics in automotive vehicles is expected to increase during the forecast period. ECG biometric technology is an excellent choice for auto because it has a wide range of applications and usage scenarios. The heart rate biometric also provides vehicle OEMs with versatility in terms of deployment, ranging from use on a wearable device for car access control to embedding into a car's steering wheel to assist identification and health, wellness, and wellbeing (HWWW) applications. Biometrics in Automotive market is expected to register CAGR of 22.5% during the forecast period.
To get more Insights: Request Free Sample Report
Biometrics in Automotive Market Dynamics:
The need for biometric solutions has increased as the necessity for precise access control systems has grown throughout business organizations. Fingerprint recognition is the most common biometrics technology, and it is regarded perfect for ensuring precise employee identification and automatically tracking attendance. Meanwhile, facial recognition is gaining acceptance, particularly in government agencies for tracking criminals. These organizations employ facial recognition technology to compare the attributes of a person's face in real time to a database of people who have been banned.
Retail & e-commerce demands:
Biometrics are in high demand in the retail and e-commerce industries, as businesses seek a deeper understanding of in-store consumer behaviour. Retailers are using analytics and facial recognition to provide personalized services based on customer preferences.
In 2020, CyberLink Corp. and NTT DATA teamed together to launch a remote retail solution based on the former's FaceMe® facial recognition engine at an unstaffed Tokyu Hands concept shop in Shibuya. This integrated solution, according to the company, combines remote serving, anonym zed AI data analytics, and digital information monitors to let customers have a better self-service experience.
Iris recognition:
Iris recognition technology is gaining popularity because it provides greater accuracy in the authentication procedure. The technology's identification algorithms find the iris' boundaries and analyses the image to produce a concise and distinct depiction of an individual's iris pattern. Furthermore, iris recognition has a very low false-match rate and is most commonly utilised in big populations. For example, the Aadhaar Unique Identity programme in India has collected iris data from over 1 billion people. In the UAE's air and seaports, iris identity checking is also employed.
In its most recent patent application, State Farm, a US-based insurance firm, proposed a new form of auto insurance plan. Customers' insurance rates would be created using a combination of biometric and automobile data, making them more personalised. The Emotion Management System (EMS) technology monitors the driver's heart rate, grip on the steering wheel, body temperature, arm movement, head movement, voice patterns, and respiration rate using a mix of sensors and cameras. If any of these are activated, the system will provide stimuli such as nature sounds, aroma, soothing music, or cool air blasts to alter the driver's behaviour. If the biometric-powered vehicle detects a lightheaded feeling while driving under the influence, it will safely slow and stop, preventing an accident.
By forming agreements with wearable technology businesses, automotive OEMs can save money on research and development. The link between the automotive sector and biometrics is dominated by wearable technology. Adidas, Fitbit, Samsung, Google, Boston Scientific, Medtronic, and Eurotech are among the top wearable firms in the industry. Smart watches, cameras, e-textiles, clothes, mhealth, AR glasses, fitness, and activity trackers are among the end user industries covered. Wearables' major purpose is to acquire and provide critical information to individuals in real time when they need it.
DriveSafe Company has developed a prototype that uses a built-in accelerometer in Google Glass to prevent drivers from nodding off behind the wheel. This is accomplished by analysing the driver's head and eyelid motions. Mercedes-Benz has recently launched the glassware project, which is supposed to allow drivers to look away from the GPS system by overlaying route directions on the road through glasses.
Ford, on the other hand, is concentrating its efforts on developing technology that monitor drivers' health. Though still in its infancy, wearable technology has the potential to revolutionize the automotive industry in the next ten years.
Premium OEMs are interested in including the speech recognition technology found in Apple's Siri and Microsoft's Cortana. Nuance's dragon drive platform now includes enhanced voice biometrics that seamlessly link IoT to the vehicular device via a virtual assistant called 'Dragon Drive Daily Update,' which was introduced last year. This system gives individualized traffic and navigation updates, as well as organizing sports scores, music stations, and other items of interest to the driver.
SenseTime to aid automakers with AI: New Developments in the market:
According to the South China Morning Post, AI and facial recognition company SenseTime is moving into the auto manufacturing industry by offering an AI platform that helps workers spot defects in engine components.
Beijing Foton Cummins Engine will deploy an AI-powered engine flaw detection technology developed by the firm in conjunction with its proprietary industrial quality inspection training platform, SenseSpring. According to SenseTime, the automated technology detects surface and assembly flaws in essential engine components, freeing human workers from laborious inspection tasks. SenseTime joins a slew of other Chinese digital firms making inroads into the Chinese auto industry. Huawei and Baidu have jumped into China's $19 billion electric car boom, while Alibaba is looking to expand into the autonomous driving industry in tandem with its electric vehicle ambitions. According to the Morning Post, Baidu, Huawei, Alibaba, and AInnovation are driving China's industry inspection market, which is expected to reach $142 million in 2020.
Biometrics in Automotive Market Segmentation:
Fingerprint Sensors: New segment is dominating the market:
Because of the rising popularity of mobile devices and biometric systems, fingerprint recognition technology has advanced quickly in recent years. Security and access control functions are the most common uses for it. Fast-track technical developments in this market, such as in display solutions, came as a result of this. The growing popularity of fingerprint sensors in consumer products is projected to provide considerable prospects for their use in the automotive industry. Global fingerprint sensing shipments are estimated to reach around 1.1 billion units in 2020, according to Credit Suisse, representing a predicted growth of more than 200 million units in three years. Because the cost of fingerprint sensors is lowering, it is becoming more affordable for many manufacturers to use them in their future vehicles without dramatically increasing the vehicle's price. Early adoption has spurred competitors to provide comparable solutions. The average selling price of fingerprint sensors has dropped from USD 5.5 in 2014 to USD 2.1 in 2019, with a target of USD 2 in 2020.

Biometrics in Automotive Market Regional Insights:
North America region is expected to grow at a significant rate:
North America is home to one of the world's largest automotive manufacturing hubs. In recent years, the automotive industry has experienced only minor development. The used automobile industry in this region is fiercely competitive, accounting for nearly 75% of total auto sales in the United States in 2018, according to US Bureau of Economic Analysis figures.
As a result, automakers in the region rely on modern technology, such as biometrics, to provide value and difference to their products. In the region, the automotive sector is a rapidly emerging market for biometrics applications. The corporations are positioning and segmenting their biometric offerings for the market in a strategic way. For example, Nuance Communications, one of the leading US-based providers of biometrics for the automotive industry, announced in November 2019 that it would spin off its automotive biometric division, forming Cerence Inc., a separate public company dedicated solely to the automotive biometrics market. This plan was suggested by the corporation in order to achieve a first-mover advantage in creating biometrics for the automotive industry.
The objective of the report is to present a comprehensive analysis of the Biometrics in Automotive Market to the stakeholders in the industry. The report provides trends that are most dominant in the Biometrics in Automotive Market and how these trends will influence new business investments and market development throughout the forecast period. The report also aids in the comprehension of the Biometrics in Automotive Market dynamics and competitive structure of the market by analyzing market leaders, market followers, and regional players.
The qualitative and quantitative data provided in the Biometrics in Automotive Market report is to help understand which market segments, regions are expected to grow at higher rates, factors affecting the market, and key opportunity areas, which will drive the industry and market growth through the forecast period. The report also includes the competitive landscape of key players in the industry along with their recent developments in the Biometrics in Automotive Market. The report studies factors such as company size, market share, market growth, revenue, production volume, and profits of the key players in the Biometrics in Automotive Market.
The report provides Porter's Five Force Model, which helps in designing the business strategies in the market. The report helps in identifying how many rivals are existing, who they are, and how their product quality is in the Market. The report also analyses if the Biometrics in Automotive Market is easy for a new player to gain a foothold in the market, do they enter or exit the market regularly if the market is dominated by a few players, etc.
The report also includes a PESTEL Analysis, which aids in the development of company strategies. Political variables help in figuring out how much a government can influence the
Market. Economic variables aid in the analysis of economic performance drivers that have an impact on the Market. Understanding the impact of the surrounding environment and the influence of environmental concerns on the Biometrics in Automotive Market is aided by legal factors.
Biometrics in Automotive Market Scope:
|
Biometrics in Automotive Market |
|
|
Market Size in 2025 |
USD 4.34 Bn. |
|
Market Size in 2032 |
USD 18.00 Bn. |
|
CAGR (2026-2032) |
22.5 % |
|
Historic Data |
2020-2025 |
|
Base Year |
2025 |
|
Forecast Period |
2026-2032 |
|
Segment Scope |
By Vehicle Type
|
|
By Technology
|
|
|
Regional Scope |
North America- United States, Canada, and Mexico Europe – UK, France, Germany, Italy, Spain, Sweden, Austria, and Rest of Europe Asia Pacific – China, India, Japan, South Korea, Australia, ASEAN, Rest of APAC Middle East and Africa - South Africa, GCC, Egypt, Nigeria, Rest of the Middle East and Africa South America – Brazil, Argentina, Rest of South America |
Biometrics in Automotive Market Players:
- Synaptics Incorporated (USA)
- Fingerprint Cards AB (Sweden)
- Aware Inc. (USA)
- Cerence Inc. (Nuance Communications Inc.) (USA)
- Continental AG (Germany)
- Sensory Inc. (USA)
- Shenzhen Goodix Technology Co. Ltd. (China)
- B-Secur Ltd. (India)
- EyeLock Inc. (USA)
- Precise Biometrics AB (Sweden)
Frequently Asked Questions
North American region have the highest growth rate in the Biometrics in Automotive market.
Synaptics Incorporated (USA), Fingerprint Cards AB (Sweden), Aware Inc. (USA), Cerence Inc. (Nuance Communications Inc.) (USA), Continental AG (Germany), Sensory Inc. (USA), Shenzhen Goodix Technology Co. Ltd. (China), B-Secur Ltd. (India), EyeLock Inc. (USA), Precise Biometrics AB (Sweden) and others are the key players in the Biometrics in Automotive market.
Fingerprint Sensor segment is dominating the market owing to increasing demand for efficient and safety feature acceptance by consumers across the globe.
1. Biometrics in Automotive Market: Research Methodology
1.1. Research Data
1.1.1. Primary Data
1.1.2. Secondary Data
1.2. Market Size Estimation
1.2.1. Bottom-Up Approach
1.2.2. Top-Down Approach
1.3. Market breakdown and Data Triangulation
1.4. Assumptions
2. Biometrics in Automotive Market: Executive Summary
2.1. Market Overview
2.2. Market Size (2025) and Forecast (2026- 2032) and Y-O-Y%
2.3. Market Size (USD) and Market Share (%) – By Segments and Regions
3. Biometrics in Automotive Market: Competitive Landscape
3.1. Stellar Competition Matrix
3.2. Key Players Benchmarking
3.2.1. Company Name
3.2.2. Headquarter
3.2.3. Business Segment
3.2.4. End-User Segment
3.2.5. Revenue (2025)
3.3. Market Structure
3.3.1. Market Leaders
3.3.2. Market Followers
3.3.3. Emerging Players
3.4. Consolidation of the Market
3.4.1. Strategic Initiatives
3.4.2. Mergers and Acquisitions
3.4.3. Collaboration and Partnerships
3.4.4. Developments and Innovations
4. Biometrics in Automotive Market: Dynamics
4.1. Market Trends
4.2. Market Drivers
4.3. Market Restraints
4.4. Market Opportunities
4.5. Market Challenges
4.6. PORTER’s Five Forces Analysis
4.7. PESTLE Analysis
4.8. Technology Roadmap
4.9. Regulatory Landscape by Region
4.9.1. North America
4.9.2. Europe
4.9.3. Asia Pacific
4.9.4. Middle East and Africa
4.9.5. South America
5. Biometrics in Automotive Market Size and Forecast by Segments (by Value USD Billion)
5.1. Biometrics in Automotive Market Size and Forecast, By Vehicle Type (2025-2032)
5.1.1. Passenger Car
5.1.2. Commercial Vehicle
5.2. Biometrics in Automotive Market Size and Forecast, By Solution (2025-2032)
5.2.1. Fingerprint Scan
5.2.2. Voice Recognition
5.2.3. Facial Recognition
5.2.4. Others
5.3. Biometrics in Automotive Market Size and Forecast, by Region (2025-2032)
5.3.1. North America
5.3.2. Europe
5.3.3. Asia Pacific
5.3.4. Middle East and Africa
5.3.5. South America
6. North America Biometrics in Automotive Market Size and Forecast (by Value USD Billion)
6.1. North America Biometrics in Automotive Market Size and Forecast, By Vehicle Type (2025-2032)
6.1.1. Passenger Car
6.1.2. Commercial Vehicle
6.2. North America Biometrics in Automotive Market Size and Forecast, By Technology (2025-2032)
6.2.1. Fingerprint Scan
6.2.2. Voice Recognition
6.2.3. Facial Recognition
6.2.4. Others
6.3. North America Biometrics in Automotive Market Size and Forecast, by Country (2025-2032)
6.3.1. United States
6.3.2. Canada
6.3.3. Mexico
7. Europe Biometrics in Automotive Market Size and Forecast (by Value USD Billion)
7.1. Europe Biometrics in Automotive Market Size and Forecast, By Vehicle Type (2025-2032)
7.1.1. Passenger Car
7.1.2. Commercial Vehicle
7.2. Europe Biometrics in Automotive Market Size and Forecast, By Technology (2025-2032)
7.2.1. Fingerprint Scan
7.2.2. Voice Recognition
7.2.3. Facial Recognition
7.2.4. Others
7.3. Europe Biometrics in Automotive Market Size and Forecast, by Country (2025-2032)
7.3.1. UK
7.3.2. France
7.3.3. Germany
7.3.4. Italy
7.3.5. Spain
7.3.6. Sweden
7.3.7. Austria
7.3.8. Rest of Europe
8. Asia Pacific Biometrics in Automotive Market Size and Forecast (by Value USD Billion)
8.1. Asia Pacific Biometrics in Automotive Market Size and Forecast, By Vehicle Type (2025-2032)
8.1.1. Passenger Car
8.1.2. Commercial Vehicle
8.2. Asia Pacific Biometrics in Automotive Market Size and Forecast, By Technology (2025-2032)
8.2.1. Fingerprint Scan
8.2.2. Voice Recognition
8.2.3. Facial Recognition
8.2.4. Others
8.3. Asia Pacific Biometrics in Automotive Market Size and Forecast, by Country (2025-2032)
8.3.1. China
8.3.2. S Korea
8.3.3. Japan
8.3.4. India
8.3.5. Australia
8.3.6. Indonesia
8.3.7. Malaysia
8.3.8. Vietnam
8.3.9. Taiwan
8.3.10. Bangladesh
8.3.11. Pakistan
8.3.12. Rest of Asia Pacific
9. Middle East and Africa Biometrics in Automotive Market Size and Forecast (by Value USD Billion)
9.1. Middle East and Africa Biometrics in Automotive Market Size and Forecast, By Vehicle Type (2025-2032)
9.1.1. Passenger Car
9.1.2. Commercial Vehicle
9.2. Middle East and Africa Biometrics in Automotive Market Size and Forecast, By Technology (2025-2032)
9.2.1. Fingerprint Scan
9.2.2. Voice Recognition
9.2.3. Facial Recognition
9.2.4. Others
9.3. Middle East and Africa Biometrics in Automotive Market Size and Forecast, by Country (2025-2032)
9.3.1. South Africa
9.3.2. GCC
9.3.3. Egypt
9.3.4. Nigeria
9.3.5. Rest of ME&A
10. South America Biometrics in Automotive Market Size and Forecast (by Value USD Billion)
10.1. South America Biometrics in Automotive Market Size and Forecast, By Vehicle Type (2025-2032)
10.1.1. Passenger Car
10.1.2. Commercial Vehicle
10.2. South America Biometrics in Automotive Market Size and Forecast, By Technology (2025-2032)
10.2.1. Fingerprint Scan
10.2.2. Voice Recognition
10.2.3. Facial Recognition
10.2.4. Others
10.3. South America Biometrics in Automotive Market Size and Forecast, by Country (2025-2032)
10.3.1. Brazil
10.3.2. Argentina
10.3.3. Rest of South America
11. Company Profile: Key players
11.1. Synaptics Incorporated Inc.
11.1.1. Company Overview
11.1.2. Financial Overview
11.1.2.1. Total Revenue
11.1.2.2. Segment Revenue
11.1.2.3. Regional Revenue
11.1.3. Business Portfolio
11.1.4. SWOT Analysis
11.1.5. Business Strategy
11.1.6. Recent Developments
11.2. Fingerprint Cards AB
11.3. Aware Inc.
11.4. Cerence Inc.
11.5. Continental AG
11.6. Sensory Inc.
11.7. Shenzhen Goodix Technology Co. Ltd.
11.8. B-Secur Ltd.
11.9. EyeLock Inc.
11.10. Precise Biometrics AB
11.11. Methode Electronics
11.12. VOXX International
12. Key Findings
13. Industry Recommendations
13.1. Strategic Recommendations for Stakeholders
13.2. Future Outlook


