Banking as a Service Market: Global Market Size, Growth Outlook, Embedded Finance, and API Ecosystem Analysis (2026-2032)
Banking-as-a-Service (BaaS) Market size was valued at USD 823.16 Billion in 2025 and the total Banking-as-a-Service (BaaS) revenue is expected to grow at 18% through 2026 to 2032, reaching nearly USD 2622.15 Billion while reshaping financial infrastructure through API driven banking, embedded finance, and bank fintech partnerships, supported by strong digital banking adoption and rising demand from non-financial enterprises.
Banking-as-a-Service (BaaS) Market Overview
Banking-as-a-Service (BaaS) Market has moved from an enabling technology layer to a core growth engine for the modern financial ecosystem. This growth is tightly linked to the structural shift in how banking products are built, distributed, and consumed. Market size was valued at USD 823.16 Billion in 2025 and the total Banking-as-a-Service (BaaS) revenue is expected to grow at 18% through 2026 to 2032, reaching nearly USD 2622.15 Billion.
Global digital banking adoption has reached scale, with over 3.58 billion users worldwide and mobile apps now the primary banking interface for more than half of U.S. consumers. In India alone, digital banking users exceed 290 million. This behavioral shift has created a natural demand for Banking as a Service platforms that allow banks, fintechs, and non-financial enterprises to embed payments, accounts, cards, and lending directly into digital journeys.
For banks, the Banking as a Service market represents a monetization pathway for regulated infrastructure and balance sheets. For fintech companies and enterprises, it provides faster time to market, lower compliance burden, and flexible product innovation. As digital channels are expected to account for nearly 89.5% of global banking interactions, Banking as a Service is becoming foundational rather than optional.
-Market-Overview.webp)
To get more Insights: Request Free Sample Report
Banking-as-a-Service (BaaS) Market Dynamics
Banking-as-a-Service (BaaS) Market Drivers
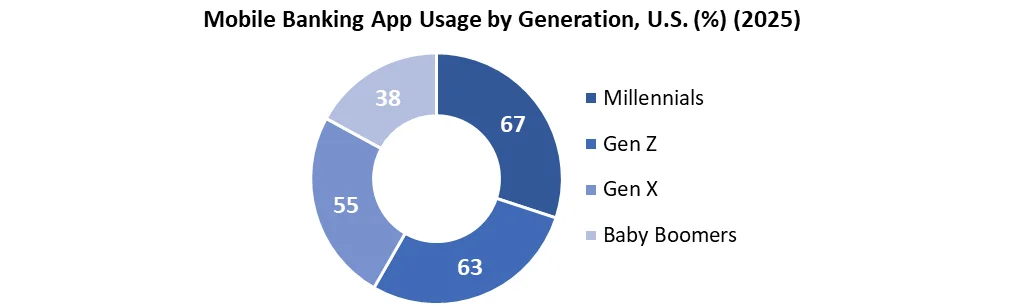
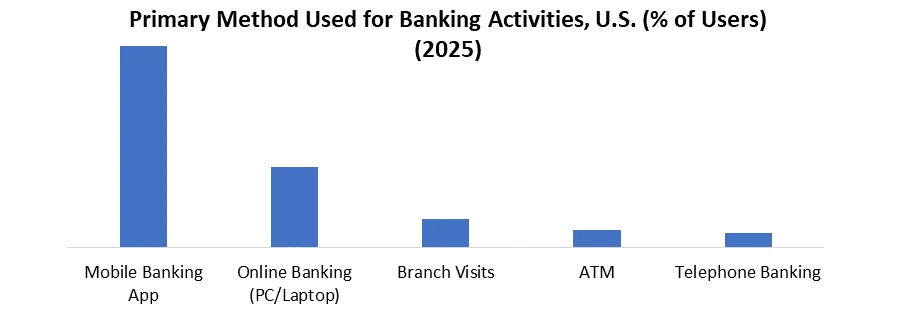
The primary driver of the Banking as a Service market is sustained digital banking adoption across all age groups. In 2025, in the U.S., over 50% of consumers now rely on mobile apps as their primary banking method, while 67% of millennials and 63% of Gen Z prefer mobile first banking experiences. Financial institutions are responding, with over 80% of financial leaders viewing Banking as a Service as a new revenue model and 60% treating it as a strategic priority.
Embedded finance demand is accelerating adoption across e commerce platforms, marketplaces, and non-financial enterprises. The ability to integrate payments, accounts, and credit directly into customer workflows is driving high frequency usage and recurring transaction volumes. Cost efficiency is another key driver, as digital acquisition costs can be as low as 1% of traditional branch-based models, while operating costs can decline by roughly 20 to 40% with platform led architectures.
Banking-as-a-Service (BaaS) Market Restraints and Challenges
Legacy infrastructure remains a structural constraint. Nearly 55% of financial institutions still operate on legacy systems, and 50% cite these systems as the biggest barrier to transformation. Regulatory scrutiny is also intensifying, with 14% of severe enforcement actions in 2024 targeting banks involved in Banking as a Service models. Compliance ownership, data localization, and cross border regulatory alignment continue to limit scalability.
Banking-as-a-Service (BaaS) Market Regional Insights
In 2025, North America held the largest market share and remains a mature and high-value region in the Banking-as-a-Service (BaaS) market, supported by deep fintech penetration, strong API adoption, and high mobile banking usage. The U.S. alone has over 215 million digital banking users, with 80% of the population expected to use digital banking by 2030.
Europe shows strong adoption driven by open banking regulations and licensed Banking as a Service providers, particularly in the UK and EU. Asia Pacific represents the fastest growth region, supported by mobile first consumers, high real time payment adoption, and expanding fintech ecosystems. India and Southeast Asia stand out as long term growth markets due to scale, cost sensitivity, and embedded finance use cases across commerce platforms.
Banking-as-a-Service (BaaS) Market Segment Analysis
Banking-as-a-Service (BaaS) Market size by Type: Payment gateway services represent one of the highest volume segments within the Banking as a Service market in 2025. Mobile apps account for nearly 50% of bill payments and person to person transfers, compared to 38 to 44% via traditional online channels. With 35% of users accessing mobile banking apps daily, payment APIs generate high transaction frequency and recurring revenue for Banking as a Service providers.
Banking-as-a-Service (BaaS) Market size by End User: Fintech Companies remain a core demand segment, leveraging Banking as a Service platform to launch accounts, cards, and lending products without owning banking licenses. As over 60% of consumers indicate willingness to switch to digital only banks, fintech led offerings continue to scale rapidly, driving API usage, customer onboarding volumes, and cross selling opportunities across the Banking as a Service market.
Banking-as-a-Service (BaaS) Market Competitive Landscape
The Banking as a Service market is moderately fragmented, comprising licensed banks, regulated BaaS platforms, core banking technology providers, and payment infrastructure specialists. Competition is driven by sponsor bank access, regulatory coverage, API reliability, and transaction scale rather than as attributed to the price alone.
Leading Banking as a Service providers such as Marqeta, a leading modern card issuing and API platform used widely in BaaS ecosystems, reported total processing volume (TPV) of approximately USD 291 billion in 2024, reflecting strong adoption across fintech and embedded finance use cases. Core banking and platform providers including Mambu, Temenos, and FintechOS support hundreds of banks and fintech deployments globally, highlighting their role in powering digital only banks and BaaS ecosystems.
Sponsor banks remain a structural bottleneck in the Banking as a Service market. Public disclosures indicate that a limited number of regulated banks support dozens of fintech programs simultaneously, increasing buyer focus on sponsor bank stability, compliance capability, and balance sheet capacity.
Overall, competitive differentiation in the Banking as a Service market increasingly depends on proven transaction scale, regulatory resilience, and the ability to support long term embedded finance growth.
|
Global Banking-as-a-Service Market Scope |
|
|
Market Size in 2025 |
USD 823.16 Bn. |
|
Market Size in 2032 |
USD 2622.15 Bn. |
|
CAGR (2026-2032) |
18% |
|
Historic Data |
2020-2025 |
|
Base Year |
2025 |
|
Forecast Period |
2026-2032 |
|
Segments Analysis |
By Type Payment Gateway Bank Account/Core Banking Lending and Credit Services Embedded Finance Others |
|
By Component Platform/API Services Account Management Services Payment Processing Services Lending & Credit Services Compliance & Regulatory Services Investment & Wealth Management Services Others |
|
|
By Deployment Hybrid On-Premise |
|
|
By Enterprise Size SMEs Large Enterprises |
|
|
By End User Banks and Financial Institutions Fintech Companies E-commerce Platforms & Marketplaces Non-Financial Enterprises |
|
Banking-as-a-Service (BaaS) Market by Region
North America (United States, Canada, and Mexico)
Europe (UK, France, Germany, Italy, Spain, Sweden, Russia, and the Rest of Europe)
Asia Pacific (China, South Korea, Japan, India, Australia, Indonesia, Malaysia, Thailand, Vietnam, Philippines, and Rest of APAC)
Middle East and Africa (South Africa, GCC, Nigeria, Egypt, Turkey, and Rest of ME&A)
South America (Brazil, Argentina, Colombia, Chile, Peru, and the Rest of South America)
Banking-as-a-Service (BaaS) Market Key Players
-
Solaris
-
Railsr
-
Bankable
-
Treezor
-
Engine by Starling
-
Marqeta
-
Mambu
-
Green Dot
-
BBVA Open Platform
-
Treasury Prime
-
Unit
-
Fidor
-
Contis
-
Q2
-
Temenos
-
The Bancorp
-
Griffin
-
FintechOS
-
Mbanq
-
Solid
-
Stripe Treasury
-
Currencycloud
-
Sarvatra Technologies
-
OneConnect
Regional Breakdown:
Europe Banking-as-a-Service (BaaS) Market: Industry Analysis and Forecast (2024-2030)
Frequently Asked Questions
One of the major drivers of the BaaS market is various integrated applications offered by BaaS. E.g. Card payments processing.
Another driver of the BaaS market is that it allows efficient and hassle-free ID verification services in Know Your Client (KYC) procedures.
Banking-as-a-Service (BaaS) Market size was valued at USD 823.16 Billion in 2025 and the total Banking-as-a-Service (BaaS) revenue is expected to grow at 18% through 2026 to 2032, reaching nearly USD 2622.15 Billion.
The segments covered are Type, Enterprise, Service and, Region.
1. Global Banking-as-a-Service Market: Research Methodology
2. Global Banking-as-a-Service Market Introduction
2.1. Executive Summary
2.2. Market Size (2025) & Forecast (2026-2032)
2.3. Market Size (USD) and Market Share (%) - By Segments, Regions and Country
3. Global Banking-as-a-Service Market: Competitive Landscape
3.1. SMR Competition Matrix
3.2. Competitive Landscape
3.3. Key Players Benchmarking
3.3.1. Company Name
3.3.2. Product Portfolio
3.3.3. End User Reach
3.3.4. Market Share (%)
3.3.5. Revenue (2025)
3.3.6. R&D Investment
3.3.7. Revenue Growth Rate (%)
3.3.8. Geographical Presence
3.4. Market Structure
3.4.1. Market Leaders
3.4.2. Market Followers
3.4.3. Emerging Players
3.5. Mergers and Acquisitions Details
3.6. Recent Developments
3.7. Market Positioning & Share Analysis
3.7.1. Company Revenue, Banking-as-a-Service Revenue, and Market Share (%)
3.7.2. SMR Competitive Positioning
3.8. Strategic Developments & Partnerships
4. Banking-as-a-Service Market: Dynamics
4.1. Banking-as-a-Service Market Trends
4.2. Banking-as-a-Service Market Dynamics
4.2.1. Drivers
4.2.2. Restraints
4.2.3. Challenges
4.2.4. Opportunities
4.3. PORTER’s Five Forces Analysis
4.4. PESTLE Analysis
5. BaaS Value Chain and Ecosystem Structure
5.1. Role of licensed banks and sponsor banks
5.2. BaaS platform providers and API aggregators
5.3. Middleware, compliance, and infrastructure enablers
5.4. Fintechs and non-financial enterprises as demand-side players
5.5. Value capture and margin distribution across the ecosystem
6. Banking-as-a-Service Market Technology Architecture and API Stack Analysis
6.1. Core banking infrastructure and ledger architecture
6.2. API orchestration and integration layers
6.3. Payments, accounts, cards, and lending module architecture
6.4. Data security, encryption, and access control frameworks
6.5. Scalability, uptime, and system resilience considerations
7. Banking-as-a-Service Market Embedded Finance Use Case Penetration Analysis
7.1. Embedded payments adoption by industry vertical
7.2. Embedded banking accounts and card issuance use cases
7.3. Embedded lending and credit enablement models
7.4. Revenue contribution by embedded finance use case
7.5. Enterprise vs fintech-led embedded finance deployments
8. Banking-as-a-Service Market Regulatory and Compliance Landscape Impacting BaaS
8.1. Licensing structures and regulatory ownership models
8.2. KYC, AML, and transaction monitoring responsibilities
8.3. Data localization and cross-border compliance challenges
8.4. Regional regulatory divergence and its impact on scalability
8.5. Regulatory risks and compliance cost implications
9. Banking-as-a-Service Market Commercial Models and Revenue Economics
9.1. Subscription-based pricing models
9.2. Transaction-based and usage-led revenue models
9.3. Hybrid pricing structures across services
9.4. Unit economics across payments, lending, and accounts
9.5. Cost drivers and margin sensitivity analysis
10. Bank–Fintech Partnership and Operating Models
10.1. Direct bank-to-fintech partnership structures
10.2. Aggregator-led and multi-bank routing models
10.3. Risk sharing and liability allocation frameworks
10.4. Operational complexity and scalability trade-offs
10.5. Case-based comparison of partnership models
11. Go-to-Market Strategies and Customer Acquisition Dynamics
11.1. API-first and developer-led adoption strategies
11.2. Vertical-specific BaaS offerings
11.3. Enterprise sales vs fintech-led GTM approaches
11.4. Customer onboarding timelines and friction points
11.5. Retention drivers and switching barriers
12. Regional Banking-as-a-Service Market Maturity and Adoption Readiness
12.1. BaaS adoption maturity by region
12.2. Regulatory readiness and sponsor bank availability
12.3. API infrastructure and cloud penetration impact
12.4. Region-wise barriers to scaling BaaS
12.5. Near-term vs long-term growth pockets
13. Use Case Economics and Profitability Benchmarks
13.1. Revenue per API and per customer benchmarks
13.2. Cost-to-serve by use case payments vs accounts vs lending
13.3. Breakeven timelines for fintechs using BaaS
13.4. High-margin vs low-margin BaaS services
13.5. Cross-subsidization dynamics within platforms
14. Banking-as-a-Service Market: Sponsor Bank Strategy and Capacity Analysis
14.1. Number and type of sponsor banks by region
14.2. Balance sheet capacity constraints
14.3. Risk appetite and sector exposure limits
14.4. Impact of bank exits on platform continuity
14.5. Strategic importance of banks in BaaS negotiations
15. Banking-as-a-Service Market Data Ownership, Monetization, and Privacy Considerations
15.1. Ownership of transaction and customer data
15.2. Data monetization opportunities and limits
15.3. Privacy regulations and consent management
15.4. Data portability and switching risks
15.5. Strategic value of data in BaaS ecosystems
16. Global Banking-as-a-Service Market: Size and Forecast by Segmentation (By Value USD Billion) (2025-2032)
16.1. Global Banking-as-a-Service Market Size and Forecast, By Type
16.1.1. Payment Gateway
16.1.2. Bank Account/Core Banking
16.1.3. Lending and Credit Services
16.1.4. Embedded Finance
16.1.5. Others
16.2. Global Banking-as-a-Service Market Size and Forecast, By Component
16.2.1. Platform/API
16.2.2. Services
16.2.2.1. Account Management Services
16.2.2.2. Payment Processing Services
16.2.2.3. Lending & Credit Services
16.2.2.4. Compliance & Regulatory Services
16.2.2.5. Investment & Wealth Management Services
16.2.2.6. Others
16.3. Global Banking-as-a-Service Market Size and Forecast, By Deployment
16.3.1. Hybrid
16.3.2. On-Premise
16.4. Global Banking-as-a-Service Market Size and Forecast, By Enterprise Size
16.4.1. SMEs
16.4.2. Large Enterprises
16.5. Global Banking-as-a-Service Market Size and Forecast, By End User
16.5.1. Banks and Financial Institutions
16.5.2. Fintech Companies
16.5.3. E-commerce Platforms & Marketplaces
16.5.4. Non-Financial Enterprises
16.6. Global Banking-as-a-Service Market Size and Forecast, By Region
16.6.1. North America
16.6.2. Europe
16.6.3. Asia Pacific
16.6.4. Middle East and Africa
16.6.5. South America
17. North America Banking-as-a-Service Market Size and Forecast By Segmentation (By Value USD Billion) (2025-2032)
17.1. North America Market Size and Forecast, By Type
17.2. North America Market Size and Forecast, By Component
17.3. North America Market Size and Forecast, By Deployment
17.4. North America Market Size and Forecast, By Enterprise Size
17.5. North America Market Size and Forecast, By End User
17.6. North America Market Size and Forecast, By Country
17.6.1. United States
17.6.2. Canada
17.6.3. Mexico
18. Europe Banking-as-a-Service Market Size and Forecast By Segmentation (By Value USD Billion) (2025-2032)
18.1. Europe Market Size and Forecast, By Type
18.2. Europe Market Size and Forecast, By Component
18.3. Europe Market Size and Forecast, By Deployment
18.4. Europe Market Size and Forecast, By Enterprise Size
18.5. Europe Market Size and Forecast, By End User
18.6. Europe Market Size and Forecast, By Country
18.6.1. United Kingdom
18.6.2. France
18.6.3. Germany
18.6.4. Italy
18.6.5. Spain
18.6.6. Sweden
18.6.7. Russia
18.6.8. Rest of Europe
19. Asia Pacific Banking-as-a-Service Market Size and Forecast by Segmentation (By Value USD Billion) (2025-2032)
19.1. Asia Pacific Market Size and Forecast, By Type
19.2. Asia Pacific Market Size and Forecast, By Component
19.3. Asia Pacific Market Size and Forecast, By Deployment
19.4. Asia Pacific Market Size and Forecast, By Enterprise Size
19.5. Asia Pacific Market Size and Forecast, By End User
19.6. Asia Pacific Market Size and Forecast, By Country
19.6.1. China
19.6.2. Japan
19.6.3. South Korea
19.6.4. India
19.6.5. Australia
19.6.6. Malaysia
19.6.7. Thailand
19.6.8. Vietnam
19.6.9. Indonesia
19.6.10. Philippines
19.6.11. Rest of Asia Pacific
20. Middle East and Africa Banking-as-a-Service Market Size and Forecast By Segmentation (By Value USD Billion) (2025-2032)
20.1. Middle East and Africa Market Size and Forecast, By Type
20.2. Middle East and Africa Market Size and Forecast, By Component
20.3. Middle East and Africa Market Size and Forecast, By Deployment
20.4. Middle East and Africa Market Size and Forecast, By Enterprise Size
20.5. Middle East and Africa Market Size and Forecast, By End User
20.6. Middle East and Africa Market Size and Forecast, By Country
20.6.1. South Africa
20.6.2. GCC
20.6.3. Nigeria
20.6.4. Egypt
20.6.5. Turkey
20.6.6. Rest of ME&A
21. South America Banking-as-a-Service Market Size and Forecast By Segmentation (By Value USD Billion) (2025-2032)
21.1. South America Market Size and Forecast, By Type
21.2. South America Market Size and Forecast, By Component
21.3. South America Market Size and Forecast, By Finish
21.4. South America Market Size and Forecast, By Enterprise Size
21.5. South America Market Size and Forecast, By End User
21.6. South America Market Size and Forecast, By Country
21.6.1. Brazil
21.6.2. Argentina
21.6.3. Colombia
21.6.4. Chile
21.6.5. Rest Of South America
22. Company Profile: Key Players
22.1. Solaris
22.1.1. Company Overview
22.1.2. Business Portfolio
22.1.3. Financial Overview
22.1.4. SWOT Analysis
22.1.5. Strategic Analysis
22.1.6. Recent Developments
22.2. Railsr
22.3. Bankable
22.4. Treezor
22.5. ClearBank
22.6. Engine by Starling
22.7. Marqeta
22.8. Mambu
22.9. Green Dot
22.10. BBVA Open Platform
22.11. Treasury Prime
22.12. Unit
22.13. Fidor
22.14. Contis
22.15. Q2
22.16. Temenos
22.17. The Bancorp
22.18. Griffin
22.19. FintechOS
22.20. Mbanq
22.21. Solid
22.22. Stripe Treasury
22.23. Currencycloud
22.24. Sarvatra Technologies
22.25. OneConnect
23. Banking-as-a-Service Market Key Findings
24. Banking-as-a-Service Industry Recommendations