Activated Carbon Market Global Industry Analysis and Forecast (2026-2032) With Emerging Key Trends
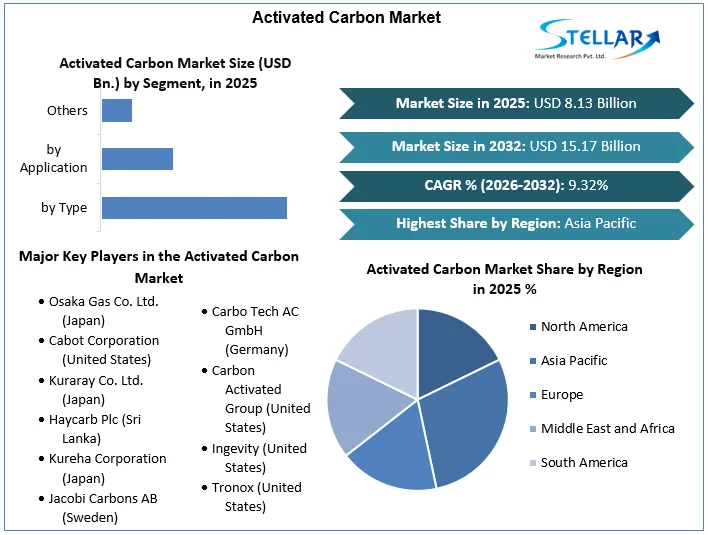
Activated Carbon Market size was valued at US $ 8.13 Billion in 2025 and the Activated Carbon market revenue is expected to grow at 9.32% through 2026 to 2032, reaching nearly US $ 15.17 Billion. The report analyzes Activated Carbon market dynamics by region, type, and applications.
Activated Carbon Market Overview:
Activated carbon, often known as activated charcoal, is a kind of graphite that is used to make pencil leads. It has a random, flawed structure that is very porous over a wide range of pore sizes, from apparent cracks and crevices to molecular dimensions, which sets it apart from graphite. The carbon's high surface area thanks to its graphite structure, which allows it to absorb a wide spectrum of chemicals. Activated carbon has the strongest physical adsorption forces of any substance known to mankind, as well as the largest volume of adsorbing porosity.
The surface area of activated carbon (activated charcoal) can be larger than 1000 m2/g. This means that 3g of activated carbon may cover an entire football field in surface area. Activated carbon (activated charcoal) can made from many substances containing a high carbon content such as coal, coconut shells and wood. The raw material has a very large influence on the characteristics and performance of the activated carbon (activated charcoal).
To get more Insights: Request Free Sample Report
Activated Carbon Market Dynamics:
As the need for pollution management grows, activated carbon is in great demand:
The process of transferring gaseous pollutants from an air stream to the solid surface of an adsorbent is referred to as adsorption. Activated carbon is the most common adsorbent, however, zeolites, polymers, and other adsorbents can also be used. The special properties of activated carbon allow it to remove VOCs, smells, and other gaseous pollutants from the atmosphere. It does so in a different way than other air purifiers, such as HEPA filters, which just filter particle pollution from the air.
Maximum Achievable Control Technology (MACT) standards have been established by the Environmental Protection Agency (EPA), which requires sources to meet specified emission limits based on the emission levels of the best-performing facilities. The IPPC Directive (Directive 2008/1/EC) is one of the directives published by the European Commission to limit industrial emissions. Its primary principle is to adopt the most advanced techniques available (BAT). BAT refers to the best technology available on the market that is both inexpensive and practical for preventing mercury pollution.

For example, in countries like Canada and the United States, new legislation that may mandate coal-fired power plants to install particular mercury-control systems went into effect in 2021. The European Union, as well as countries like Australia and Japan, are working on programs to better monitor mercury emissions from coal-fired power stations in the hopes of adopting standards soon.
Because of a scarcity of raw resources, the price of activated carbon is rising:
In the Asia Pacific, coconut shells are becoming an increasingly important raw material for activated carbon producers. Natural disasters have a significant impact on the value chain of the activated carbon industry, notably in terms of raw materials. As a result, raw material prices have risen, particularly for coconut shell charcoal. The cost of coal-based activated carbon has also increased as a result of rising energy demand, particularly in China, where coal demand for industrial industries including power, cement, and iron and steel plants continues to climb.
For example,
- Jacobi Group has decided to raise the price of all coconut-based activated carbons by 10% because of a large increase in raw material costs. For shipments made on or after April 1, 2021, the price increases took effect.
- Beginning on or after October 1, 2020, or as customer contracts allow, Cabot Norit Activated Carbon hiked global pricing for all activated carbon products. Price increases vary from 3% to 8%, depending on the activated carbon product and location.
As a result, appropriate coal grades for the manufacturing of activated carbon are scarce. Coal is the most prevalent raw material used in the manufacturing of activated carbon throughout the Asia Pacific, particularly in India, Sri Lanka, Indonesia, and the Philippines. The scarcity of raw materials, on the other hand, is affecting the operational effectiveness of activated carbon producers, resulting in a 50–60% drop in production capacity and a rise in activated carbon costs.
Manufacturers of activated carbon may be able to profit from reactivated carbon:
As a result of strict air quality regulations and the growing number of municipal and industrial wastewater treatment plants, demand for activated carbon has skyrocketed. A major aspect of the sector is the increasing pressure on activated carbon manufacturers due to the high cost of production. As a result, activated carbon manufacturers are focusing their efforts on reactivated carbon. Reactivated carbon is 20 to 30% less expensive than virgin activated carbon. It is a cost-effective alternative to activated carbon. Traditional activated carbon is less harmful to the environment than reactivated carbon.
The thermal reactivation approach reduces carbon dioxide emissions by five times when compared to the manufacturing of fresh material. Municipal water treatment plants in Europe prefer reactivated carbon. After reactivation, the spent activated carbon can be recovered for reuse, minimizing the expenses and long-term responsibilities that come with the disposal. Reactivated carbon solves the cost problem because it is efficient and non-hazardous to the environment. This is a huge potential for market operators to drive their profits.
Inefficient economic conditions resulting from low industrial growth:
Weak economic conditions around the world have a direct impact on industrial expansion to some degree. Activated carbon is widely used in the chemical, petrochemical, food & beverage, pharmaceutical, mining, and automotive industries for air purification, water treatment, decolorization of chemical products, solvent purification, odor elimination, and other applications.
Similarly, changes in crude oil prices affect the chemical, petrochemical, and allied industries' value chains, limiting their growth. Because the demand for activated carbon is closely tied to operational activities in various industries, low industrial activity has an impact on market growth.
Key Trends:
- Carbon costs have risen in several countries, but they still range from US $1/t CO2e to US $119/t CO2e.
The most substantial price hikes in the recent year occurred in Asia, with increases in the Korean ETS (Emission Trading Scheme) and Chinese pilots because of limited trading and lower allowance scarcity due to increased output, respectively. Prices in Switzerland tripled, moving up to EU allowance pricing, as part of an annual update based on the price in the EU ETS, while Portugal's carbon tax rate nearly doubled to €24/t CO2e (US $26/t CO2e) in the run-up to the EU ETS connection.
- Increasingly carbon pricing measures are being implemented to assist governments in meeting more aggressive regional or national climate targets.
The EU Green Deal, with its goal of carbon neutrality by 2050, has increased the case for more severe climate action and expanded the implementation of carbon pricing in Europe. Several countries have established new climate goals and are looking into national carbon pricing initiatives to supplement the EU ETS by covering new industries. Germany intends to launch a nationwide carbon market for heat and road trips in 2021. In 2021, Luxembourg planned to impose a carbon tax on industries not covered by the EU ETS. Similarly, Austria has announced plans to impose a carbon price for non-ETS businesses, while the program's details are still being worked out.
Activated Carbon Market Segmentation:
Based on Type: In 2025, the powder-activated carbon (PAC) segment was dominant and held xx% of the overall market share in terms of revenue. When compared to granular activated carbon, powdered activated carbon (PAC) has a smaller particle size and so has a higher surface-to-volume ratio. As a result, PAC is commonly introduced to process units such as quick mix basins, clarifiers, and gravity filters directly.
Activated carbon is traditionally manufactured as powders or small granules less than 1.0 mm in diameter with an average diameter of 0.15 mm to 0.25 mm. The efficiency of PAC in adsorbing tastes and odors is dependent on proper mixing, contact time, dosage, and the source and severity of the odor or taste problem. PAC is consumed in a variety of applications, including wastewater treatment.
Activated Carbon Market Regional Insights:
The Asia Pacific region dominated in terms of revenue in 2025, accounting for more than 39.26% of the total market. Factors such as a ready supply of raw materials and labor, as well as innovative technologies and innovations, have driven the Asia Pacific region's economic growth. According to the World Bank, China and Japan, the two economic titans of the Asia Pacific region, were the world's second and third largest economies in 2020.

Demand is expected to be driven by growing end-use industries such as chemicals, petrochemicals, and food and beverages, as well as high GDP rates in comparison to mature countries in North America and Europe. Two of the region's largest activated carbon producers, Haycarb Plc. (Sri Lanka) and Osaka Gas Co. Ltd. (Japan), control the supply chain.
The objective of the report is to present a comprehensive analysis of the Activated Carbon Market to the stakeholders in the industry. The report provides trends that are most dominant in the Activated Carbon Market and how these trends will influence new business investments and market development throughout the forecast period. The report also aids in the comprehension of the Activated Carbon Market dynamics and competitive structure of the market by analyzing market leaders, market followers, and regional players.
The qualitative and quantitative data provided in the Activated Carbon Market report is to help understand which market segments, regions are expected to grow at higher rates, factors affecting the market, and key opportunity areas, which will drive the industry and market growth through the forecast period. The report also includes the competitive landscape of key players in the industry along with their recent developments in the Activated Carbon Market. The report studies factors such as company size, market share, market growth, revenue, production volume, and profits of the key players in the Activated Carbon Market.
The report provides Porter's Five Force Model, which helps in designing the business strategies in the market. The report helps in identifying how many rivals are existing, who they are, and how their product quality is in the Market. The report also analyses if the Activated Carbon Market is easy for a new player to gain a foothold in the market, do they enter or exit the market regularly if the market is dominated by a few players, etc.
The report also includes a PESTEL Analysis, which aids in the development of company strategies. Political variables help in figuring out how much a government can influence the Market. Economic variables aid in the analysis of economic performance drivers that have an impact on the Market. Understanding the impact of the surrounding environment and the influence of environmental concerns on the Activated Carbon Market is aided by legal factors.
Activated Carbon Market Scope:
|
Activated Carbon Market |
|
|
Market Size in 2025 |
USD 8.13 Bn. |
|
Market Size in 2032 |
USD 15.17 Bn. |
|
CAGR (2026-2032) |
9.32% |
|
Historic Data |
2020-2025 |
|
Base Year |
2025 |
|
Forecast Period |
2026-2032 |
|
Segment Scope |
by Type
|
|
by Application
|
|
|
Regional Scope |
North America- United States, Canada, and Mexico Europe – UK, France, Germany, Italy, Spain, Sweden, Austria, and Rest of Europe Asia Pacific – China, India, Japan, South Korea, Australia, ASEAN, Rest of APAC Middle East and Africa - South Africa, GCC, Egypt, Nigeria, Rest of the Middle East and Africa South America – Brazil, Argentina, Rest of South America |
Activated Carbon Market Key Players
- Osaka Gas Co. Ltd. (Japan)
- Cabot Corporation (United States)
- Kuraray Co. Ltd. (Japan)
- Haycarb Plc (Sri Lanka)
- Kureha Corporation (Japan)
- Jacobi Carbons AB (Sweden)
- Calgon Carbon Corporation (United States)
- Carbo Tech AC GmbH (Germany)
- Carbon Activated Group (United States)
- Ingevity (United States)
- Tronox (United States)
- Genuine Shell Carb (India)
- James Cumming & Sons (Australia)
- Indo German Carbons (India)
Frequently Asked Questions
The surging prices of activated carbon because of the scarcity of raw materials like coconut shells is the only key factor expected to hinder the growth of the market during the forecast period.
The global activated carbon market is expected to grow at a CAGR of 9.32% during the forecast period (2026-2032).
The continuous growth in the global pollution across the globe demanding more consumption of activated carbon to control the emissions of the pollutants are the key factors expected to drive the growth of the market during the forecast period.
Osaka Gas Co. Ltd. (Japan), Cabot Corporation (United States), Kuraray Co. Ltd. (Japan), Haycarb Plc (Sri Lanka), Kureha Corporation (Japan), Jacobi Carbons AB (Sweden), Calgon Carbon Corporation (United States), Carbo Tech AC GmbH (Germany), Carbon Activated Group (United States), Ingevity (United States), Tronox (United States), Genuine Shell Carb (India), James Cumming & Sons (Australia), Indo German Carbons (India), and Others are the key players covered.
1. Activated Carbon Market Introduction
1.1. Study Assumption and Market Definition
1.2. Scope of the Study
1.3. Executive Summary
2. Global Activated Carbon Market: Competitive Landscape
2.1. Stellar Competition Matrix
2.2. Competitive Landscape
2.3. Key Players Benchmarking
2.3.1. Company Name
2.3.2. Product Segment
2.3.3. End User Segment
2.3.4. Revenue (2025)
2.3.5. Company Locations
2.4. Market Structure
2.4.1. Market Leaders
2.4.2. Market Followers
2.4.3. Emerging Players
2.5. Mergers and Acquisitions Details
3. Activated Carbon Market: Dynamics
3.1. Activated Carbon Market Trends by Region
3.1.1. North America
3.1.2. Europe
3.1.3. Asia Pacific
3.1.4. Middle East and Africa
3.1.5. South America
3.2. Activated Carbon Market Dynamics
3.2.1. Activated Carbon Market Drivers
3.2.2. Activated Carbon Market Restraints
3.2.3. Activated Carbon Market Opportunities
3.2.4. Activated Carbon Market Challenges
3.3. PORTER’s Five Forces Analysis
3.4. PESTLE Analysis
3.5. Trade Analysis
3.5.1. Import Scenario
3.5.2. Export Scenario
3.6. Value Chain Analysis
3.7. Regulatory Landscape
3.8. Key Opinion Leaders Analysis for the Activated Carbon industry
3.9. Analysis of Government Schemes and Initiatives for Activated Carbon Industry
4. Activated Carbon Market: Global Market Size and Forecast by Segmentation (by Value in USD Million and Volume in Kilotons) (2025-2032)
4.1. Activated Carbon Market Size and Forecast, by Type (2025-2032)
4.1.1. Powder Activated Carbon (PAC)
4.1.2. Granular Activated Carbon (GAC)
4.1.3. Extruded Activated Carbon (EAC)
4.1.4. Charcoal Activated Carbon Cloth (ACC)
4.2. Activated Carbon Market Size and Forecast, by Application (2025-2032)
4.2.1. Liquid Applications
4.2.2. Water Treatment
4.2.3. Food & Beverages
4.2.4. Pharmaceutical & Medical
4.2.5. Others
4.2.6. Gas-Phase Applications
4.2.7. Automotive
4.2.8. Industrial
4.2.9. Air Purification
4.2.10. Flue Gas Cleaning
4.2.11. Mercury Control
4.2.12. Solvent Recovery
4.2.13. Others
4.3. Activated Carbon Market Size and Forecast, by Region (2025-2032)
4.3.1. North America
4.3.2. Europe
4.3.3. Asia Pacific
4.3.4. Middle East and Africa
4.3.5. South America
5. North America Activated Carbon Market Size and Forecast by Segmentation (by Value in USD Million and Volume in Kilotons) (2025-2032)
5.1. North America Activated Carbon Market Size and Forecast, by Type (2025-2032)
5.1.1. Powder Activated Carbon (PAC)
5.1.2. Granular Activated Carbon (GAC)
5.1.3. Extruded Activated Carbon (EAC)
5.1.4. Charcoal Activated Carbon Cloth (ACC)
5.2. North America Activated Carbon Market Size and Forecast, by Application (2025-2032)
5.2.1. Liquid Applications
5.2.2. Water Treatment
5.2.3. Food & Beverages
5.2.4. Pharmaceutical & Medical
5.2.5. Others
5.2.6. Gas-Phase Applications
5.2.7. Automotive
5.2.8. Industrial
5.2.9. Air Purification
5.2.10. Flue Gas Cleaning
5.2.11. Mercury Control
5.2.12. Solvent Recovery
5.2.13. Others
5.3. North America Activated Carbon Market Size and Forecast, by Country (2025-2032)
5.3.1. United States
5.3.2. Canada
5.3.3. Mexico
6. Europe Activated Carbon Market Size and Forecast by Segmentation (by Value in USD Million and Volume in Kilotons) (2025-2032)
6.1. Europe Activated Carbon Market Size and Forecast, by Type (2025-2032)
6.2. Europe Activated Carbon Market Size and Forecast, by Application (2025-2032)
6.3. Europe Activated Carbon Market Size and Forecast, by Country (2025-2032)
6.3.1. United Kingdom
6.3.2. France
6.3.3. Germany
6.3.4. Italy
6.3.5. Spain
6.3.6. Sweden
6.3.7. Austria
6.3.8. Rest of Europe
7. Asia Pacific Activated Carbon Market Size and Forecast by Segmentation (by Value in USD Million and Volume in Kilotons) (2025-2032)
7.1. Asia Pacific Activated Carbon Market Size and Forecast, by Type (2025-2032)
7.2. Asia Pacific Activated Carbon Market Size and Forecast, by Application (2025-2032)
7.3. Asia Pacific Activated Carbon Market Size and Forecast, by Country (2025-2032)
7.3.1. China
7.3.2. S Korea
7.3.3. Japan
7.3.4. India
7.3.5. Australia
7.3.6. Indonesia
7.3.7. Malaysia
7.3.8. Vietnam
7.3.9. Taiwan
7.3.10. Rest of Asia Pacific
8. Middle East and Africa Activated Carbon Market Size and Forecast by Segmentation (by Value in USD Million and Volume in Kilotons) (2025-2032)
8.1. Middle East and Africa Activated Carbon Market Size and Forecast, by Type (2025-2032)
8.2. Middle East and Africa Activated Carbon Market Size and Forecast, by Application (2025-2032)
8.3. Middle East and Africa Activated Carbon Market Size and Forecast, by Country (2025-2032)
8.3.1. South Africa
8.3.2. GCC
8.3.3. Nigeria
8.3.4. Rest of ME&A
9. South America Activated Carbon Market Size and Forecast by Segmentation (by Value in USD Million and Volume in Kilotons) (2025-2032)
9.1. South America Activated Carbon Market Size and Forecast, by Type (2025-2032)
9.2. South America Activated Carbon Market Size and Forecast, by Application (2025-2032)
9.3. South America Activated Carbon Market Size and Forecast, by Country (2025-2032)
9.3.1. Brazil
9.3.2. Argentina
9.3.3. Rest Of South America
10. Company Profile: Key Players
10.1. Osaka Gas Co. Ltd. (Japan)
10.1.1. Company Overview
10.1.2. Business Portfolio
10.1.3. Financial Overview
10.1.4. SWOT Analysis
10.1.5. Strategic Analysis
10.1.6. Recent Developments
10.2. Cabot Corporation (United States)
10.3. Kuraray Co. Ltd. (Japan)
10.4. Haycarb Plc (Sri Lanka)
10.5. Kureha Corporation (Japan)
10.6. Jacobi Carbons AB (Sweden)
10.7. Calgon Carbon Corporation (United States)
10.8. Carbo Tech AC GmbH (Germany)
10.9. Carbon Activated Group (United States)
10.10. Ingevity (United States)
10.11. Tronox (United States)
10.12. Genuine Shell Carb (India)
10.13. James Cumming & Sons (Australia)
10.14. Indo German Carbons (India)
10.15. Others
11. Key Findings
12. Industry Recommendations
13. Activated Carbon Market: Research Methodology