3D Printed Composites Market - Global Industry Analysis and Forecast 2026-2034 Trends, Statistics, Dynamics, Segment Analysis
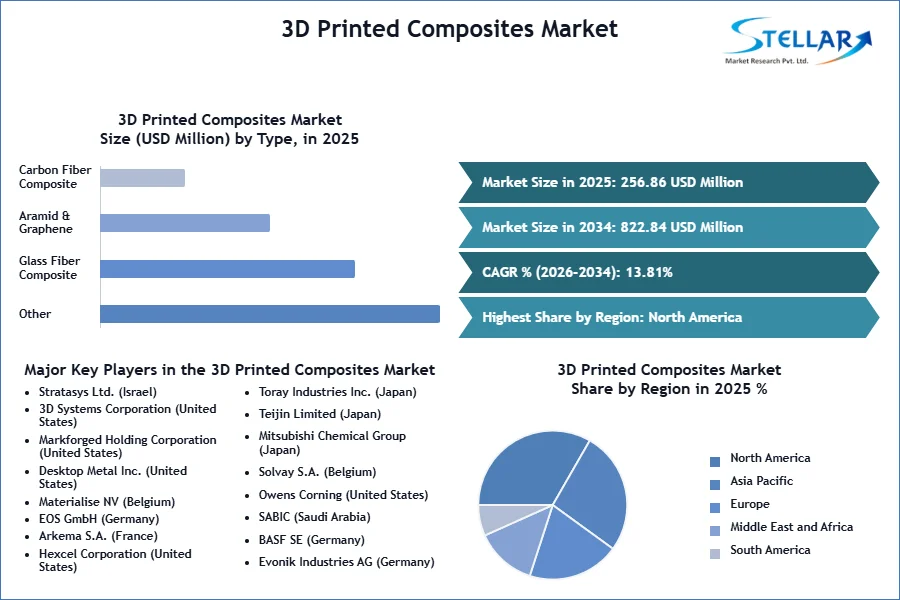
The Global 3D Printed Composites Market size reached USD 256.86 Million in 2025 and expects the market to reach USD 822.84 Million by 2034, exhibiting a growth rate (CAGR) of 13.81% during 2026-2034.
3D Printed Composites Market Overview:
The market for 3D-printed composites began to take shape with the widespread use of 3D printing technology for composite materials. Composite materials can benefit especially from the layer-by-layer material addition method used in additive manufacturing, sometimes referred to as 3D printing. Composites are substances created by combining two or more distinct elements with dissimilar physical or chemical properties to create a completed good with improved overall performance.
Although additive manufacturing (AM), often known as 3D printing, is still in its early stages in the composites industry, technology has immense potential in a number of industries, including aerospace & military, healthcare, and automotive. The technology has a number of advantages over existing methods, including a quicker part cycle time, efficient part manufacturing, the ability to produce parts with variable geometries, decreased waste, a lack of the need for expensive tooling, and compatibility with all conceivable material combinations. Composites have replaced metals and other materials in numerous applications because of their excellent qualities and relatively low weight.
To get more Insights: Request Free Sample Report
3D Printed Composites Market Dynamics:
3D Printed Composites Market Drivers include Lightweight and High Performance, Reduced Waste, and Reduced Tooling Costs.
3D-printed composites offer the advantage of being lightweight while maintaining high strength and stiffness properties. This makes them appealing for aerospace, automotive, and sports equipment industries, where weight reduction is crucial for improving fuel efficiency and overall performance.
Traditional manufacturing processes often generate significant amounts of waste due to subtractive methods. 3D printing is an additive process, meaning the material is deposited only where needed, reducing waste and material costs.
Traditional manufacturing often requires expensive tooling to produce parts. With 3D printing, the need for complex tooling is reduced or eliminated, leading to cost savings, especially for low-volume production runs.
The integration of the Internet of Things and automation into 3D printing processes can lead to more efficient and streamlined production workflows, further enhancing the adoption of 3D-printed composites.
Limited materials, limited size, Post-Processing Requirements, Equipment and Infrastructure Costs, etc.
3D printing with composites requires suitable materials that can be processed effectively through additive manufacturing techniques. Not all composite materials are well-suited for 3D printing, and limitations in material choices could hinder the growth of the market.
After printing, some 3D-printed composite parts may require additional post-processing steps to achieve the desired mechanical properties, surface finish, and dimensional accuracy. These post-processing steps can add to the overall production time and cost.
Setting up and maintaining 3D printing equipment capable of working with composites can be costly. The infrastructure required for ensuring proper material handling, storage, and quality control can also contribute to the overall expense.
Ensuring consistent quality and performance of 3D-printed composite parts is crucial, especially in industries like aerospace and automotive. Developing reliable quality control processes and obtaining necessary certifications can be challenging due to the unique nature of composite 3D printing.
Space Exploration, Tooling and Jigs, Rapid Prototyping
Complex designs and geometries can be quickly prototyped using 3D-printed composites, which is not possible with conventional production techniques. Time to market is shortened and the product development cycle is accelerated.
For many industries, manufacturing tools, jigs, and fixtures are necessary. By making specialized fixtures and tools more affordable, 3D-printed composites can enhance production procedures.
Complex and sophisticated geometries can be produced with 3D-printed composites, which is frequently difficult or impossible to do using conventional manufacturing techniques. In fields like architecture, art, and design, this is useful.
The aerospace sector may use 3D-printed composites to make strong, lightweight space exploration components, lowering launch costs and enabling cutting-edge designs.
Intellectual property and patent infringement concerns
Intellectual property and patent infringement issues may surface as the market for 3D-printed composites expands, giving rise to hurdles and litigation.
When using composite materials, the environmental effects of 3D printing may be of concern. It is a constant struggle to reduce waste and energy use while preserving performance.
It can be difficult to locate or create composite materials that are appropriate for 3D printing. Specific requirements, including compatibility with 3D printing techniques, mechanical qualities, and durability, must be met by these materials.
3D Printed Composites Market Trends:
Early adopters of composites printed in three dimensions include the aerospace and automobile industries. For lightweight components, they used these materials to increase fuel economy and lower emissions. As technology advanced, it was predicted that these uses would expand.
Custom implants, prostheses, and orthopedic devices were being made in the medical industry using 3D-printed composites. This tendency was most likely to persist as technology improved in usability and accuracy.
3D Printed Composites Market Regional Insights:
For 3D-printed composite materials globally in 2025, North America held the largest market share. The increasing adoption of 3D printing technology across numerous industries, including aerospace, automotive, healthcare, and consumer goods, has led to a recent growth in the North American 3D printing composite industry. The market is being pushed by a desire for intricately formed, incredibly strong, and light composite parts. In North America, the healthcare sector, notably for the production of specialty implants and prostheses, is also driving the demand for 3D printing composites. The ability to produce patient-specific components using 3D printing with composites with complex geometries and high precision has altered the medical business and led to better patient outcomes and lower costs.
It is estimated that Asia-Pacific would experience the fastest CAGR growth during the projected time range. As a result of increased infrastructure spending and creative construction, the industry is anticipated to grow.
3D Printed Composites Market Segment Analysis:
Based on the type of composite, the market is segmented into three groups: glass fiber composite, aramid & graphene fiber composite, and carbon fiber composite. Carbon fiber composite is anticipated to have the industry with the fastest CAGR growth from 2026 to 2034. The increase is being brought on by expanding demand in the aerospace and defense sectors. By significantly reducing the weight of cars and airplanes through the use of composites in 3D printing, it is feasible to improve the performance and fuel efficiency of these vehicles. Arevo developed a laser-based technique for 3D printing carbon fiber.
From 2026 to 2034, the fiberglass industry is expected to expand at an extraordinary rate. Fiberglass is a durable, reasonably priced, and somewhat flexible reinforcement material. It is a great location to start printing with strengthening and improves the strength of pieces compared to those made of plastic.
By Technology, The market for 3D-printed composites is divided into categories based on technology such as material extrusion, powder bed infusion, and others. From 2026 to 2034, the industry for material extrusion technology is expected to grow at the fastest rate. The technology of material extrusion has been widely applied in many fields, including the 3D printing of composite materials. It is also one of the most often used techniques for printing composites due to the variety of materials that are accessible for this industry. Recent years have witnessed significant improvements in the usage of powder bed infusion technology for composite material applications.
The industry for Fusion Bed Infusion is estimated to see the fastest CAGR between 2026 and 2034. 3D printing and the infusion of composite materials are combined during the manufacturing process known as "fusion bed infusion" (FBI).
By End-User, The 3D printed composite market is divided into the healthcare, automotive, aerospace & military, and other sectors based on the end user. The sector expected to develop at the highest CAGR between 2025 and 2032 is aerospace and military. Composite materials are now widely used in the aerospace and defense industries for interiors, engine components, body components, and other uses. The physical properties of airplane parts have the benefit of reducing the payload of the aircraft. The industry with the fastest expected CAGR between 2025 and 2032 is the healthcare sector. Prosthetic limbs are created and built using 3D-printed composites, taking into account the particular requirements of each patient.
3D Printed Composites Market Competitive Landscape:
In February 2023, CORE bought GEM manufacturing. Metal components and mechanical assemblies are offered by GEM Manufacturing.
In March 2023, 3D Systems and TE Connectivity worked together on a cutting-edge approach to create a complete production plan from design to finished electrical connectors.
In August 2022, Latécoère and Graphite Additive Manufacturing formed a partnership to create the next generation of wing technologies.
In order to create a cutting-edge 3D printing platform, CORE acquired RE3DTECH 3D Printing Service in January 2025.
|
3D Printed Composites Market Scope |
|
|
Market Size in 2025 |
USD 256.86 Million. |
|
Market Size in 2034 |
USD 822.84 Million. |
|
CAGR (2026-2034) |
13.81% |
|
Historic Data |
2020-2025 |
|
Base Year |
2025 |
|
Forecast Period |
2026-2034 |
|
Segment Scope |
By Composite Type
|
|
By Technology
|
|
|
By End-User
|
|
|
Regional Scope |
North America- United States, Canada, and Mexico Europe – UK, France, Germany, Italy, Spain, Sweden, Austria, and Rest of Europe Asia Pacific – China, India, Japan, South Korea, Australia, Rest of APAC Middle East and Africa - South Africa, GCC, Egypt, Nigeria, Rest of the Middle East and Africa South America – Brazil, Argentina, Rest of South America |
3D Printed Composites Market Key Players:
- Stratasys Ltd. (Israel)
- 3D Systems Corporation (United States)
- Markforged Holding Corporation (United States)
- Desktop Metal Inc. (United States)
- Materialise NV (Belgium)
- EOS GmbH (Germany)
- Arkema S.A. (France)
- Hexcel Corporation (United States)
- Toray Industries Inc. (Japan)
- Teijin Limited (Japan)
- Mitsubishi Chemical Group (Japan)
- Solvay S.A. (Belgium)
- Owens Corning (United States)
- SABIC (Saudi Arabia)
- BASF SE (Germany)
- Evonik Industries AG (Germany)
- CRP Technology (Italy)
- Arevo Inc. (United States)
- Anisoprint (Luxembourg)
- Continuous Composites Inc. (United States)
Frequently Asked Questions
The 3D Printed Composites Market size is expected to reach USD 822.84million by 2034.
The major players in the 3D Printed Composites Market include 3D Systems Corp. Arkema SA AREVO Inc. BASF SE Cosine Additive Inc. CORE Industrial Partners LLC CRP Technology Srl General Electric Co. EOS GmbH Electro Optical Systems Graphite Additive Manufacturing Ltd. Koninklijke DSM NV Hoganas AB
The expected CAGR of the 3D Printed Composites Market is 13.81% from 2026 to 2034.
The North American market dominated the 3D Printed Composites Market by Region in 2025.
1. Global 3D Printed Composites Market: Research Methodology
2. Global 3D Printed Composites Market: Executive Summary
3. Global 3D Printed Composites Market: Competitive Landscape
3.1. Stellar Competition Matrix
3.2. Competitive Landscape
3.3. Key Players Benchmarking
3.4. Market Structure
3.4.1. Market Leaders
3.4.2. Market Followers
3.4.3. Emerging Players
3.5. Consolidation of the Market
4. Global 3D Printed Composites Market: Dynamics
4.1. Market Trends by Region
4.1.1. North America
4.1.2. Europe
4.1.3. Asia Pacific
4.1.4. Middle East and Africa
4.1.5. South America
4.2. Market Drivers by Region
4.2.1. North America
4.2.2. Europe
4.2.3. Asia Pacific
4.2.4. Middle East and Africa
4.2.5. South America
4.3. Market Restraints
4.4. Market Opportunities
4.5. Market Challenges
4.6. PORTER’s Five Forces Analysis
4.7. PESTLE Analysis
4.8. Value Chain Analysis
4.9. Regulatory Landscape by Region
4.9.1. North America
4.9.2. Europe
4.9.3. Asia Pacific
4.9.4. Middle East and Africa
4.9.5. South America
5. Global 3D Printed Composites Market Size and Forecast by Segments (by Value USD and Volume Units)
5.1. Global 3D Printed Composites Market Size and Forecast, by Composite Type (2026-2034)
5.1.1. Glass fiber composite
5.1.2. Aramid & graphene fiber composite
5.1.3. Carbon fiber composite
5.2. Global 3D Printed Composites Market Size and Forecast, by Technology (2026-2034)
5.2.1. Material extrusion
5.2.2. Powder bed infusion
5.2.3. Others
5.3. Global 3D Printed Composites Market Size and Forecast, by End-User (2026-2034)
5.3.1. Healthcare
5.3.2. Automotive
5.3.3. Aerospace & Military
5.3.4. Others
5.4. Global 3D Printed Composites Market Size and Forecast, by Region (2026-2034)
5.4.1. North America
5.4.2. Europe
5.4.3. Asia Pacific
5.4.4. Middle East and Africa
5.4.5. South America
6. North America Global 3D Printed Composites Market Size and Forecast (by Value USD and Volume Units)
6.1. North America Global 3D Printed Composites Market Size and Forecast, by Composite Type (2026-2034)
6.1.1. Glass fiber composite
6.1.2. Aramid & graphene fiber composite
6.1.3. Carbon fiber composite
6.2. North America Global 3D Printed Composites Market Size and Forecast, by Technology (2026-2034)
6.2.1. Material extrusion
6.2.2. Powder bed infusion
6.2.3. Others
6.3. North America Global 3D Printed Composites Market Size and Forecast, by End-User (2026-2034)
6.3.1. Healthcare
6.3.2. Automotive
6.3.3. Aerospace & Military
6.3.4. Others
6.4. North America Global 3D Printed Composites Market Size and Forecast, by Country (2026-2034)
6.4.1. United States
6.4.2. Canada
6.4.3. Mexico
7. Europe Global 3D Printed Composites Market Size and Forecast (by Value USD and Volume Units)
7.1. Europe Global 3D Printed Composites Market Size and Forecast, by Composite Type (2026-2034)
7.1.1. Glass fiber composite
7.1.2. Aramid & graphene fiber composite
7.1.3. Carbon fiber composite
7.2. Europe Global 3D Printed Composites Market Size and Forecast, by Technology (2026-2034)
7.2.1. Material extrusion
7.2.2. Powder bed infusion
7.2.3. Others
7.3. Europe Global 3D Printed Composites Market Size and Forecast, by End-User (2026-2034)
7.3.1. Healthcare
7.3.2. Automotive
7.3.3. Aerospace & Military
7.3.4. Others
7.4. Europe Global 3D Printed Composites Market Size and Forecast, by Country (2026-2034)
7.4.1. UK
7.4.2. France
7.4.3. Germany
7.4.4. Italy
7.4.5. Spain
7.4.6. Sweden
7.4.7. Austria
7.4.8. Rest of Europe
8. Asia Pacific Global 3D Printed Composites Market Size and Forecast (by Value USD and Volume Units)
8.1. Asia Pacific Global 3D Printed Composites Market Size and Forecast, by Composite Type (2026-2034)
8.1.1. Glass fiber composite
8.1.2. Aramid & graphene fiber composite
8.1.3. Carbon fiber composite
8.2. Asia Pacific Global 3D Printed Composites Market Size and Forecast, by Technology (2026-2034)
8.2.1. Material extrusion
8.2.2. Powder bed infusion
8.2.3. Others
8.3. Asia Pacific Global 3D Printed Composites Market Size and Forecast, by End-User (2026-2034)
8.3.1. Healthcare
8.3.2. Automotive
8.3.3. Aerospace & Military
8.3.4. Others
8.4. Asia Pacific Global 3D Printed Composites Market Size and Forecast, by Country (2026-2034)
8.4.1. China
8.4.2. S Korea
8.4.3. Japan
8.4.4. India
8.4.5. Australia
8.4.6. Indonesia
8.4.7. Malaysia
8.4.8. Vietnam
8.4.9. Taiwan
8.4.10. Bangladesh
8.4.11. Pakistan
8.4.12. Rest of Asia Pacific
9. Middle East and Africa Global 3D Printed Composites Market Size and Forecast (by Value USD and Volume Units)
9.1. Middle East and Africa Global 3D Printed Composites Market Size and Forecast, by Composite Type (2026-2034)
9.1.1. Glass fiber composite
9.1.2. Aramid & graphene fiber composite
9.1.3. Carbon fiber composite
9.2. Middle East and Africa Global 3D Printed Composites Market Size and Forecast, by Technology (2026-2034)
9.2.1. Material extrusion
9.2.2. Powder bed infusion
9.2.3. Others
9.3. Middle East and Africa Global 3D Printed Composites Market Size and Forecast, by End-User (2026-2034)
9.3.1. Healthcare
9.3.2. Automotive
9.3.3. Aerospace & Military
9.3.4. Others
9.4. Middle East and Africa Global 3D Printed Composites Market Size and Forecast, by Country (2026-2034)
9.4.1. South Africa
9.4.2. GCC
9.4.3. Egypt
9.4.4. Nigeria
9.4.5. Rest of ME&A
10. South America Global 3D Printed Composites Market Size and Forecast (by Value USD and Volume Units)
10.1. South America Global 3D Printed Composites Market Size and Forecast, by Composite Type (2026-2034)
10.1.1. Glass fiber composite
10.1.2. Aramid & graphene fiber composite
10.1.3. Carbon fiber composite
10.2. South America Global 3D Printed Composites Market Size and Forecast, by Technology (2026-2034)
10.2.1. Material extrusion
10.2.2. Powder bed infusion
10.2.3. Others
10.3. South America Global 3D Printed Composites Market Size and Forecast, by End-User (2026-2034)
10.3.1. Healthcare
10.3.2. Automotive
10.3.3. Aerospace & Military
10.3.4. Others
10.4. South America Global 3D Printed Composites Market Size and Forecast, by Country (2026-2034)
10.4.1. Brazil
10.4.2. Argentina
10.4.3. Rest of South America
11. Company Profile: Key players
11.1.1. 3D Systems Corp.
11.1.2. Company Overview
11.1.3. Financial Overview
11.1.4. Business Portfolio
11.1.5. SWOT Analysis
11.1.6. Business Strategy
11.1.7. Recent Developments
11.2. Arkema SA
11.3. AREVO Inc.
11.4. BASF SE
11.5. Cosine Additive Inc.
11.6. CORE Industrial Partners LLC
11.7. CRP Technology Srl
11.8. General Electric Co.
11.9. EOS GmbH Electro Optical Systems
11.10. Graphite Additive Manufacturing Ltd.
11.11. Koninklijke DSM NV
11.12. Hoganas AB
12. Key Findings
13. Industry Recommendation