The Global Utility Markers Market Size, Segments and Forecast (2026-2032)
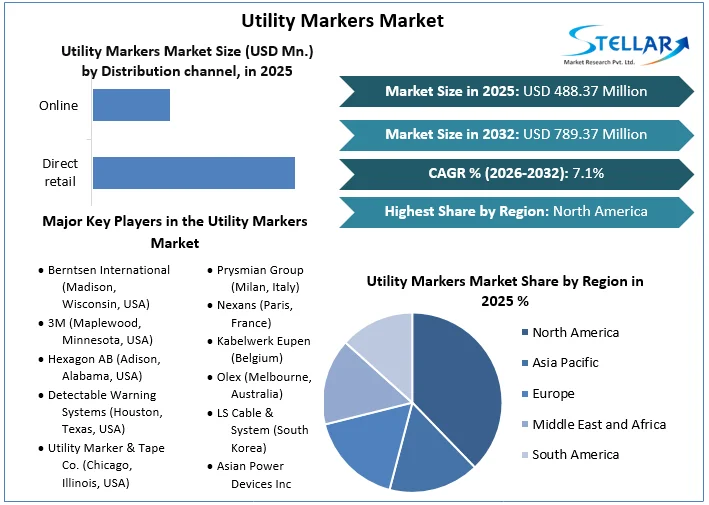
The Global Utility Markers Market size is valued at USD 488.37 Mn in 2025, and is expected to reach USD 789.37 Mn by 2032, at a CAGR of 7.1% during the forecast period (2026-2032).
The Utility Markers Market Overview
Utility markers or utility locators are the markings that are used for identifying or locating the underground utilities it is used to prevent damage and accidents. The markings are done for the underground utilities like gas pipes, water lines, electricity, and telecommunications lines Basically, it ensure the safety of workers and the public.
The Utility markers are used to detect and find underground buried infrastructure, such as gas pipes lines, water pipes lines, power cables lines, and telecommunication cables. The Utility markers help to ensure the safety of living being by avoiding unnecessary damage during digging, it also reduces service outages, and it also improves efficiency in maintenance. Utility markers is been highly used across a lot of industries like construction, oil & gas, municipal utilities, and telecommunications. With infrastructure growth, utility marking solutions are gaining importance overall worldwide.
The utility marker market is transforming with new technologies like RFID tags, GPS-tracking, and IoT-based systems. These technologies provide real-time monitoring, accurate location mapping, and smooth data exchange among stakeholders. AI-driven detection software and 3D mapping software also provide more accuracy, enabling authorities and construction workers to steer clear of expensive utility strikes. Many companies have combining smart markers with centralized databases, enhancing regulatory compliance and emergency response effectiveness. These developments enable data-driven planning and minimize economic losses due to infrastructure damage. Utility markers are segmented by function, type, end-user, and distribution channel.
In this Utility Markers Industry North America dominated the market share in 2025 with strict safety laws, and it is gaining ground as governments implement more stringent utility protection legislation. The world market for utility markers is expected to experience steady or high growth through smart city development and increasing investments in infrastructure.
New technologies like AI and drone mapping are ready to transform the process of detecting and marking utilities. And with the industry moving towards automation and real-time data analysis, utility markers will become increasingly crucial in the provision of public safety and efficiency of operations. This market offers considerable prospects for innovation, especially in developing economies with growing urban infrastructure. SMR Report covered the detailed analysis of Utility markers industry also, covered the detailed analysis of OEMs and Region-specific infrastructure development initiatives, Brand positioning and distributor network mapping for utility markers.
To get more Insights: Request Free Sample Report
Global Utility Markers Market Dynamics
Technological Advancement To Drive Utility Markers Market
The utility markers use new innovative technologies such as GPS (Global Positioning System), Radio Frequency Identification (RFID) markers, electronic markers and GIS (Geographic Information System) is boosting the market growth. These utility markers help to improve the accuracy and visibility of underground utility mapping. Many Utility Markers companies in the market focuse on developing innovative marker products combined with technologies such as Bluetooth, RFID, and QR (Quick Response Code) codes to provide real-time data access and it also help to improve on-site safety for people.
Government Projects And AI Boost Utility Markers Market
The spread of new government projects related to environmental safety is increasing the demand for utility marking services. Projects like solar, wind, hydro, and geothermal are rapidly growing worldwide due to climate change policies; therefore, they need underground power lines, Hydrogen & Biofuel Pipelines, and Offshore Wind Farms & Subsea Cables. However, the demand for AI-Powered Detection in Utility Marking is also increasing, which is helping AI to analyze historical data (utility maps, soil reports) to predict where buried lines are located.
The Transfer Of Utility Rights Row Making It Expensive and Restrain Utility Markers Market
When a utility company (e.g., electricity, gas, water, or telecommunications) needs to install and maintain infrastructure (like power lines or pipelines) in society and sometimes it often secures legal rights to access private property through Easements or Rights of Way. The agreements grant the utility companies to use utility usage rights while blocking the landowner's ability to interfere with those rights. But Governments often compensate landowners for easements, either through negotiation or eminent domain, which is expensive.
Global Utility Markers Market Segment Analysis
Based on Function, the Utility Markers Market is segmented into Passive and Programmable. In this segment the Passive dominated the market in 2025, and it is expected to hold the largest market share over the forecast period. passive markers rely on visual identifications such as Metal detection. Passive markers are cost-effective, reliable, and have been widely used the traditional way of utility marking. Whereas programmable is been used in smart cities for various projects, programmable markers used in cities are IoT-connected sensors.
Based on Marker type, the Utility Markers Market is segmented into Tape, Ball, Flag, Disk, Post and much more types of markers. In this segments Tape markers dominated the market in 2025 and it is expected to hold the largest market share over the forecast period also. Ball markers are the most common marker used for underground marking due to its spherical shape (made of plastic or metal) for underground detection make it easy to use whereas the tape markers are the colour coded warning tapes which are easy to install and is widely used in construction sites.
Based on Distribution Channel, the Utility Markers Market is segmented into Direct retail and online channel. In this segment Direct retail dominated the market in 2025 and it is expected to hold the largest market share over the forecast period also as retail are mostly used for bulk purchase. The online sales are also growing due to convenience.
Based on End-user Industry, the Utility Markers Market is segmented into Oil & Gas, Telecommunication, Electricity & Power, Water & Wastewater, Transportation and Others. In This Segments Oil & Gas dominated the market in 2025 and it is expected to hold the largest market share over the forecast period also due to its high regulatory requirements and extensive underground network. There are High-voltage cable type markers in Electricity & Power industry, Pipeline markers in Oil & Gas industry, Fiber optic line markers in Telecommunication industry, Pipe markers in Water & Wastewater industry, Road/rail utility markings in Transportation industry are ruling the market.

Utility Markers Market Regional Insights
North America Dominated The Market In 2025 due to their Strict Safety Regulations in the country
The world market for utility markers exhibits different regional trends, influenced by different industrial activities, infrastructure growth, and regulatory requirements. North America is the top leaders in the market because of their strict safety regulations their significant investments in utility maintenance, and the presence of major players in the countries. The utility markers markets value long-lasting, high-visibility markers for gas, water, and electricity lines, pushing innovation in materials and technologies. Moreover, aged infrastructure in such areas requires routine repair and replacement, further promoting the demand for utility markers.
Obstacles such as economic uncertainty and lack of familiarity with sophisticated marking solutions remain, but increasing foreign investments and public-private partnerships should create future opportunities. Regional growth is overall determined by industrialization, regulatory structures, and infrastructure requirements.
Global Utility Markers Market Competitive Landscape
The global utility markers industry has a competitive market where established brands like 3M Company, Avery Dennison Corporation, and Brady Corporation control the market share. These giants dominate the industry with an unwavering focus on innovation by providing high-visibility, strong, and weather-resistant markers designed for industrial, construction, and utility use. Their large networks of distributors and brand recognition help them compete over other regions including North America and Europe. Also, they spend a lot of money on research and development to bring in sophisticated solutions such as RFID-enabled and intelligent markers for asset tracking and infrastructure management. Emerging players and local manufacturers are also gaining ground by providing affordable solutions specific to regional market requirements. Companies like Olex and LS cable provide dedicated utility markers for dedicated industries like construction, electric, and oil & gas. These companies compete based on price, customization, and prompt delivery to small and medium-sized enterprises.
Strategic partnerships, acquisitions, and mergers are characterizing competitive market forces. Huge firms are acquiring smaller firms to expand products and geography offerings. Many top Companies have merged smart marking technology with IoT capabilities and made it available for smart city deployments and energy applications. Joint ventures with construction companies and utility companies further fuel demand, as regulatory pressures around safety and efficiency stimulate uptake of high-performance markers.
Sustainability trends are inspiring firms to design biodegradable and low-VOC markers. In contrast, growing adoption of automation and artificial intelligence in infrastructure management is driving demand for smart utility markers with sensor integration and traceability capabilities. Consequently, both global players and nimble local players are changing their strategies according to technological changes and tighter industry regulations to sustain their market shares.
|
Global Utility markers Market |
|
|
Market Size in 2025 |
USD 488.37 Mn |
|
Market Size in 2032 |
USD 789.37 Mn |
|
CAGR (2026-2032) |
7.1% |
|
Historic Data |
2020-2025 |
|
Base Year |
2025 |
|
Forecast Period |
2026-2032 |
|
Segments |
By Function type Passive Programmable |
|
By Marker Type Tape Markers Ball Markers Flag Markers Disk Markers Posts Markers Others |
|
|
By Distribution channel Direct retail Online |
|
|
By End-User industry Oil and Gas Telecommunication Electricity/Power Water/ Wastewater Transportation Others |
|
|
Regional Scope |
North America- United States, Canada, and Mexico Europe – UK, France, Germany, Italy, Spain, Sweden, Russia, and Rest of Europe Asia Pacific – China, South Korea, India, Japan, South Korea, Australia, Indonesia, Philippines, Malaysia, Vietnam, Thailand, Rest of Asia pacific region Middle East and Africa - South Africa, GCC, Egypt, Nigeria, Rest of the Middle East and Africa South America – Brazil, Argentina, Rest of South America |
KEY PLAYERS IN GLOBAL UTILITY MARKERS MARKET
North America
- Berntsen International (Madison, Wisconsin, USA)
- 3M (Maplewood, Minnesota, USA)
- Hexagon AB (Adison, Alabama, USA)
- Detectable Warning Systems (Houston, Texas, USA)
- Utility Marker & Tape Co. (Chicago, Illinois, USA)
- Brady Corporation(Wisconsin USA)
Europe
- Emtelle (Hawick, Scotland, UK)
- Prysmian Group (Milan, Italy)
- Nexans (Paris, France)
- Kabelwerk Eupen (Belgium)
Asia Pacific
- Olex (Melbourne, Australia)
- LS Cable & System (South Korea)
- Asian Power Devices Inc (Philippines)
- Asian Contec Ltd.(Thailand)
- Fuji-Ace (Japan)
- Sumitomo Electric Industries (Japan)
- Detectable Tape Solutions (DTS)(Australia)
- Warren & Brown Technologies (Victoria, Australia)
- Nitto Denko Corporation (Osaka, Japan)
- Polycab India Ltd (India)
Middle East And Africa
- Elsewedy Electric (Egypt)
- Reunert (South Africa)
- Nexans (South Africa)
- Dutco Tennant LLC (UAE)
- Dywidag-Systems International(South Africa)
South America
- CEMIG (Brazil)
- Avery Dennison Reflective Solutions (Brazil)
- Agrale S.A. (Brazil)
- Dura-Line Argentina (Argentina)
- Enel Américas (Santiago, Chile)
Frequently Asked Questions
The market is growing due to increased government infrastructure projects, smart city developments, and AI-powered utility detection.
Passive markers dominated the market in 2025 due to their cost-effectiveness and reliability in traditional utility marking.
North America and Europe lead the market due to strict regulations, aging infrastructure, and significant investment in utility systems.
Major players like 3M, Avery Dennison, and Brady Corporation drive competition through innovation, brand strength, and strategic partnerships.
1. Global Utility Markers Market Introduction
1.1. Study Assumption and Market Definition
1.2. Scope of the Study
1.3. Executive Summary
2. Global Utility Markers Market: Competitive Landscape
2.1. SMR Competition Matrix
2.2. Competitive Landscape
2.3. Key Players Benchmarking
2.3.1. Company Name
2.3.2. Product Segment
2.3.3. End-user Segment
2.3.4. Revenue (2025)
2.4. Leading Global Utility Markers Market Companies, by Market Capitalization
2.5. Market Structure
2.5.1. Market Leaders
2.5.2. Market Followers
2.5.3. Emerging Players
2.6. Mergers and Acquisitions Details
3. Global Utility Markers Market: Dynamics
3.1. Global Utility Markers Market Trends
3.2. Global Utility Markers Market Dynamics
3.3. PORTER’s Five Forces Analysis
3.4. PESTLE Analysis
3.5. Value Chain Analysis
3.6. Regulatory Landscape by Region
3.6.1. North America
3.6.2. Europe
3.6.3. Asia Pacific
3.6.4. Middle East & Africa
3.6.5. South America
4. Global Utility Markers Market: Global Market Size and Forecast by Segmentation (by Value USD Mn) (2025-2032)
4.1. Global Utility Markers Market Size and Forecast, By Function (2025-2032)
4.1.1. Passive
4.1.2. Programmable
4.2. Global Utility Markers Market Size and Forecast, By Type (2025-2032)
4.2.1. Tape Markers
4.2.2. Ball Markers
4.2.3. Flag markers
4.2.4. Disk Markers
4.2.5. Posts markers
4.2.6. Others
4.3. Global Utility Markers Market Size and Forecast, By Distribution Channel (2025-2032)
4.3.1. Direct retail
4.3.2. Online
4.4. Global Utility Markers Market Size and Forecast, By End user (2025-2032)
4.4.1. Oil and Gas
4.4.2. Telecommunication
4.4.3. Electricity/Power
4.4.4. Water/ Wastewater
4.4.5. Transportation
4.4.6. Others
4.5. Global Utility Markers Market Size and Forecast, By Region (2025-2032)
4.5.1. North America
4.5.2. Europe
4.5.3. Asia Pacific
4.5.4. Middle East & Africa
4.5.5. South America
5. North America Utility Markers Market Size and Forecast by Segmentation (by Value USD Mn) (2025-2032)
5.1. North America Utility Markers Market Size and Forecast, By Function (2025-2032)
5.1.1. Passive
5.1.2. Programmable
5.2. North America Utility Markers Market Size and Forecast, By Type (2025-2032)
5.2.1. Tape Markers
5.2.2. Ball Markers
5.2.3. Flag markers
5.2.4. Disk Markers
5.2.5. Posts markers
5.2.6. Others
5.3. North America Utility Markers Market Size and Forecast, By Distribution Channel (2025-2032)
5.3.1. Direct retail
5.3.2. Online
5.4. North America Utility Markers Market Size and Forecast, By End user (2025-2032)
5.4.1. Oil and Gas
5.4.2. Telecommunication
5.4.3. Electricity/Power
5.4.4. Water/ Wastewater
5.4.5. Transportation
5.4.6. Others
5.5. North America Utility Markers Market Size and Forecast, by Country (2025-2032)
5.5.1. United States
5.5.1.1. United States Utility Markers Market Size and Forecast, By Function(2025-2032)
5.5.1.1.1. Passive
5.5.1.1.2. Programmable
5.5.1.2. United States Utility Markers Market Size and Forecast, By Type (2025-2032)
5.5.1.2.1. Tape Markers
5.5.1.2.2. Ball Markers
5.5.1.2.3. Flag markers
5.5.1.2.4. Disk Markers
5.5.1.2.5. Posts markers
5.5.1.2.6. Others
5.5.1.3. United States Utility Markers Market Size and Forecast, By Distribution Channel (2025-2032)
5.5.1.3.1. Direct retail
5.5.1.3.2. Online
5.5.1.4. United States Utility Markers Market Size and Forecast, By End user(2025-2032)
5.5.1.4.1. Oil and Gas
5.5.1.4.2. Telecommunication
5.5.1.4.3. Electricity/Power
5.5.1.4.4. Water/ Wastewater
5.5.1.4.5. Transportation
5.5.1.4.6. Others
5.5.2. Canada
5.5.2.1. Canada Utility Markers Market Size and Forecast, By Function(2025-2032)
5.5.2.1.1. Passive
5.5.2.1.2. Programmable
5.5.2.2. Canada Utility Markers Market Size and Forecast, By Type (2025-2032)
5.5.2.2.1. Tape Markers
5.5.2.2.2. Ball Markers
5.5.2.2.3. Flag markers
5.5.2.2.4. Disk Markers
5.5.2.2.5. Posts markers
5.5.2.2.6. Others
5.5.2.3. Canada Utility Markers Market Size and Forecast, By Distribution Channel (2025-2032)
5.5.2.3.1. Direct retail
5.5.2.3.2. Online
5.5.2.4. Canada Utility Markers Market Size and Forecast, By End user(2025-2032)
5.5.2.4.1. Oil and Gas
5.5.2.4.2. Telecommunication
5.5.2.4.3. Electricity/Power
5.5.2.4.4. Water/ Wastewater
5.5.2.4.5. Transportation
5.5.2.4.6. Others
5.5.3. Mexico
5.5.3.1. Mexico Utility Markers Market Size and Forecast, By Function(2025-2032)
5.5.3.1.1. Passive
5.5.3.1.2. Programmable
5.5.3.2. Mexico Utility Markers Market Size and Forecast, By Type (2025-2032)
5.5.3.2.1. Tape Markers
5.5.3.2.2. Ball Markers
5.5.3.2.3. Flag markers
5.5.3.2.4. Disk Markers
5.5.3.2.5. Posts markers
5.5.3.2.6. Others
5.5.3.3. Mexico Utility Markers Market Size and Forecast, By Distribution Channel (2025-2032)
5.5.3.3.1. Direct retail
5.5.3.3.2. Online
5.5.3.4. Mexico Utility Markers Market Size and Forecast, By End user(2025-2032)
5.5.3.4.1. Oil and Gas
5.5.3.4.2. Telecommunication
5.5.3.4.3. Electricity/Power
5.5.3.4.4. Water/ Wastewater
5.5.3.4.5. Transportation
5.5.3.4.6. Others
6. Europe Utility Markers Market Size and Forecast by Segmentation (by Value USD Mn) (2025-2032)
6.1. Europe Utility Markers Market Size and Forecast, By Function(2025-2032)
6.2. Europe Utility Markers Market Size and Forecast, By Type (2025-2032)
6.3. Europe Utility Markers Market Size and Forecast, By Distribution Channel (2025-2032)
6.4. Europe Utility Markers Market Size and Forecast, By End user(2025-2032)
6.5. Europe Utility Markers Market Size and Forecast, by Country (2025-2032)
6.5.1. United Kingdom
6.5.1.1. United Kingdom Utility Markers Market Size and Forecast, By Function(2025-2032)
6.5.1.2. United Kingdom Utility Markers Market Size and Forecast, By Type (2025-2032)
6.5.1.3. United Kingdom Utility Markers Market Size and Forecast, By Distribution Channel (2025-2032)
6.5.1.4. United Kingdom Utility Markers Market Size and Forecast, By End user(2025-2032)
6.5.2. France
6.5.2.1. France Utility Markers Market Size and Forecast, By Function(2025-2032)
6.5.2.2. France Utility Markers Market Size and Forecast, By Type (2025-2032)
6.5.2.3. France Utility Markers Market Size and Forecast, By Distribution Channel (2025-2032)
6.5.2.4. France Utility Markers Market Size and Forecast, By End user(2025-2032)
6.5.3. Germany
6.5.3.1. Germany Utility Markers Market Size and Forecast, By Function(2025-2032)
6.5.3.2. Germany Utility Markers Market Size and Forecast, By Type (2025-2032)
6.5.3.3. Germany Utility Markers Market Size and Forecast, By Distribution Channel (2025-2032)
6.5.3.4. Germany Utility Markers Market Size and Forecast, By End user(2025-2032)
6.5.4. Italy
6.5.4.1. Italy Utility Markers Market Size and Forecast, By Function(2025-2032)
6.5.4.2. Italy Utility Markers Market Size and Forecast, By Type (2025-2032)
6.5.4.3. Italy Utility Markers Market Size and Forecast, By Distribution Channel (2025-2032)
6.5.4.4. Italy Utility Markers Market Size and Forecast, By End user(2025-2032)
6.5.5. Spain
6.5.5.1. Spain Utility Markers Market Size and Forecast, By Function(2025-2032)
6.5.5.2. Spain Utility Markers Market Size and Forecast, By Type (2025-2032)
6.5.5.3. Spain Utility Markers Market Size and Forecast, By Distribution Channel (2025-2032)
6.5.5.4. Spain Utility Markers Market Size and Forecast, By End user(2025-2032)
6.5.6. Sweden
6.5.6.1. Sweden Utility Markers Market Size and Forecast, By Function(2025-2032)
6.5.6.2. Sweden Utility Markers Market Size and Forecast, By Type (2025-2032)
6.5.6.3. Sweden Utility Markers Market Size and Forecast, By Distribution Channel (2025-2032)
6.5.6.4. Sweden Utility Markers Market Size and Forecast, By End user(2025-2032)
6.5.7. Austria
6.5.7.1. Austria Utility Markers Market Size and Forecast, By Function(2025-2032)
6.5.7.2. Austria Utility Markers Market Size and Forecast, By Type (2025-2032)
6.5.7.3. Austria Utility Markers Market Size and Forecast, By Distribution Channel (2025-2032)
6.5.7.4. Austria Utility Markers Market Size and Forecast, By End user(2025-2032)
6.5.8. Rest of Europe
6.5.8.1. Rest of Europe Utility Markers Market Size and Forecast, By Function(2025-2032)
6.5.8.2. Rest of Europe Utility Markers Market Size and Forecast, By Type (2025-2032)
6.5.8.3. Rest of Europe Utility Markers Market Size and Forecast, By Distribution Channel (2025-2032)
6.5.8.4. Rest of Europe Utility Markers Market Size and Forecast, By End user(2025-2032)
7. Asia Pacific Global Utility Markers Market Size and Forecast by Segmentation (by Value USD Mn) (2025-2032)
7.1. Asia Pacific Utility Markers Market Size and Forecast, By Function(2025-2032)
7.2. Asia Pacific Utility Markers Market Size and Forecast, By Type (2025-2032)
7.3. Asia Pacific Utility Markers Market Size and Forecast, By Distribution Channel (2025-2032)
7.4. Asia Pacific Utility Markers Market Size and Forecast, By End user(2025-2032)
7.5. Asia Pacific Utility Markers Market Size and Forecast, by Country (2025-2032)
7.5.1. China
7.5.1.1. China Utility Markers Market Size and Forecast, By Function(2025-2032)
7.5.1.2. China Utility Markers Market Size and Forecast, By Type (2025-2032)
7.5.1.3. China Utility Markers Market Size and Forecast, By Distribution Channel (2025-2032)
7.5.1.4. China Utility Markers Market Size and Forecast, By End user(2025-2032)
7.5.2. S Korea
7.5.2.1. S Korea Utility Markers Market Size and Forecast, By Function(2025-2032)
7.5.2.2. S Korea Utility Markers Market Size and Forecast, By Type (2025-2032)
7.5.2.3. S Korea Utility Markers Market Size and Forecast, By Distribution Channel (2025-2032)
7.5.2.4. S Korea Utility Markers Market Size and Forecast, By End user(2025-2032)
7.5.3. Japan
7.5.3.1. Japan Utility Markers Market Size and Forecast, By Function(2025-2032)
7.5.3.2. Japan Utility Markers Market Size and Forecast, By Type (2025-2032)
7.5.3.3. Japan Utility Markers Market Size and Forecast, By Distribution Channel (2025-2032)
7.5.3.4. Japan Utility Markers Market Size and Forecast, By End user(2025-2032)
7.5.4. India
7.5.4.1. India Utility Markers Market Size and Forecast, By Function(2025-2032)
7.5.4.2. India Utility Markers Market Size and Forecast, By Type (2025-2032)
7.5.4.3. India Utility Markers Market Size and Forecast, By Distribution Channel (2025-2032)
7.5.4.4. India Utility Markers Market Size and Forecast, By End user(2025-2032)
7.5.5. Australia
7.5.5.1. Australia Utility Markers Market Size and Forecast, By Function(2025-2032)
7.5.5.2. Australia Utility Markers Market Size and Forecast, By Type (2025-2032)
7.5.5.3. Australia Utility Markers Market Size and Forecast, By Distribution Channel (2025-2032)
7.5.5.4. Australia Utility Markers Market Size and Forecast, By End user(2025-2032)
7.5.6. Indonesia
7.5.6.1. Indonesia Utility Markers Market Size and Forecast, By Function(2025-2032)
7.5.6.2. Indonesia Utility Markers Market Size and Forecast, By Type (2025-2032)
7.5.6.3. Indonesia Utility Markers Market Size and Forecast, By Distribution Channel (2025-2032)
7.5.6.4. Indonesia Utility Markers Market Size and Forecast, By End user(2025-2032)
7.5.7. Philippines
7.5.7.1. Philippines Utility Markers Market Size and Forecast, By Function(2025-2032)
7.5.7.2. Philippines Utility Markers Market Size and Forecast, By Type (2025-2032)
7.5.7.3. Philippines Utility Markers Market Size and Forecast, By Distribution Channel (2025-2032)
7.5.7.4. Philippines Utility Markers Market Size and Forecast, By End user(2025-2032)
7.5.8. Malaysia
7.5.8.1. Malaysia Utility Markers Market Size and Forecast, By Function(2025-2032)
7.5.8.2. Malaysia Utility Markers Market Size and Forecast, By Type (2025-2032)
7.5.8.3. Malaysia Utility Markers Market Size and Forecast, By Distribution Channel (2025-2032)
7.5.8.4. Malaysia Utility Markers Market Size and Forecast, By End user(2025-2032)
7.5.9. Vietnam
7.5.9.1. Vietnam Utility Markers Market Size and Forecast, By Function(2025-2032)
7.5.9.2. Vietnam Utility Markers Market Size and Forecast, By Type (2025-2032)
7.5.9.3. Vietnam Utility Markers Market Size and Forecast, By Distribution Channel (2025-2032)
7.5.9.4. Vietnam Utility Markers Market Size and Forecast, By End user(2025-2032)
7.5.10. Thailand
7.5.10.1. Thailand Utility Markers Market Size and Forecast, By Function(2025-2032)
7.5.10.2. Thailand Utility Markers Market Size and Forecast, By Type (2025-2032)
7.5.10.3. Thailand Utility Markers Market Size and Forecast, By Distribution Channel (2025-2032)
7.5.10.4. Thailand Utility Markers Market Size and Forecast, By End user(2025-2032)
7.5.11. ASEAN
7.5.11.1. ASEAN Utility Markers Market Size and Forecast, By Function(2025-2032)
7.5.11.2. ASEAN Utility Markers Market Size and Forecast, By Type (2025-2032)
7.5.11.3. ASEAN Utility Markers Market Size and Forecast, By Distribution Channel (2025-2032)
7.5.11.4. ASEAN Utility Markers Market Size and Forecast, By End user(2025-2032)
7.5.12. Rest of Asia Pacific
7.5.12.1. Rest of Asia Pacific Utility Markers Market Size and Forecast, By Function(2025-2032)
7.5.12.2. Rest of Asia Pacific Utility Markers Market Size and Forecast, By Type (2025-2032)
7.5.12.3. Rest of Asia Pacific Utility Markers Market Size and Forecast, By Distribution Channel (2025-2032)
7.5.12.4. Rest of Asia Pacific Utility Markers Market Size and Forecast, By End user(2025-2032)
8. Middle East and Africa Global Utility Markers Market Size and Forecast by Segmentation (by Value USD Mn) (2025-2032)
8.1. Middle East and Africa Utility Markers Market Size and Forecast, By Function(2025-2032)
8.2. Middle East and Africa Utility Markers Market Size and Forecast, By Type (2025-2032)
8.3. Middle East and Africa Utility Markers Market Size and Forecast, By Distribution Channel (2025-2032)
8.4. Middle East and Africa Utility Markers Market Size and Forecast, By End user(2025-2032)
8.5. Middle East and Africa Utility Markers Market Size and Forecast, by Country (2025-2032)
8.5.1. South Africa
8.5.1.1. South Africa Utility Markers Market Size and Forecast, By Function(2025-2032)
8.5.1.2. South Africa Utility Markers Market Size and Forecast, By Type (2025-2032)
8.5.1.3. South Africa Utility Markers Market Size and Forecast, By Distribution Channel (2025-2032)
8.5.1.4. South Africa Utility Markers Market Size and Forecast, By End user(2025-2032)
8.5.2. GCC
8.5.2.1. GCC Utility Markers Market Size and Forecast, By Function(2025-2032)
8.5.2.2. GCC Utility Markers Market Size and Forecast, By Type (2025-2032)
8.5.2.3. GCC Utility Markers Market Size and Forecast, By Distribution Channel (2025-2032)
8.5.2.4. GCC Utility Markers Market Size and Forecast, By End user(2025-2032)
8.5.3. Nigeria
8.5.3.1. Nigeria Utility Markers Market Size and Forecast, By Function(2025-2032)
8.5.3.2. Nigeria Utility Markers Market Size and Forecast, By Type (2025-2032)
8.5.3.3. Nigeria Utility Markers Market Size and Forecast, By Distribution Channel (2025-2032)
8.5.3.4. Nigeria Utility Markers Market Size and Forecast, By End user(2025-2032)
8.5.4. Rest of ME&A
8.5.4.1. Rest of ME&A Utility Markers Market Size and Forecast, By Function(2025-2032)
8.5.4.2. Rest of ME&A Utility Markers Market Size and Forecast, By Type (2025-2032)
8.5.4.3. Rest of ME&A Utility Markers Market Size and Forecast, By Distribution Channel (2025-2032)
8.5.4.4. Rest of ME&A Utility Markers Market Size and Forecast, By End user(2025-2032)
9. South America Global Utility Markers Market Size and Forecast by Segmentation (by Value USD Mn.) (2025-2032)
9.1. South America Utility Markers Market Size and Forecast, By Function(2025-2032)
9.2. South America Utility Markers Market Size and Forecast, By Type (2025-2032)
9.3. South America Utility Markers Market Size and Forecast, By Distribution Channel (2025-2032)
9.4. South America Utility Markers Market Size and Forecast, By End user(2025-2032)
9.5. South America Utility Markers Market Size and Forecast, by Country (2025-2032)
9.5.1. Brazil
9.5.1.1. Brazil Utility Markers Market Size and Forecast, By Function(2025-2032)
9.5.1.2. Brazil Utility Markers Market Size and Forecast, By Type (2025-2032)
9.5.1.3. Brazil Utility Markers Market Size and Forecast, By Distribution Channel (2025-2032)
9.5.1.4. Brazil Utility Markers Market Size and Forecast, By End user(2025-2032)
9.5.2. Argentina
9.5.2.1. Argentina Utility Markers Market Size and Forecast, By Function(2025-2032)
9.5.2.2. Argentina Utility Markers Market Size and Forecast, By Type (2025-2032)
9.5.2.3. Argentina Utility Markers Market Size and Forecast, By Distribution Channel (2025-2032)
9.5.2.4. Argentina Utility Markers Market Size and Forecast, By End user(2025-2032)
9.5.3. Rest Of South America
9.5.3.1. Rest Of South America Utility Markers Market Size and Forecast, By Function (2025-2032)
9.5.3.2. Rest Of South America Utility Markers Market Size and Forecast, By Type (2025-2032)
9.5.3.3. Rest Of South America Utility Markers Market Size and Forecast, By Distribution Channel (2025-2032)
9.5.3.4. Rest Of South America Utility Markers Market Size and Forecast, By End user(2025-2032)
10. Company Profile: Key Players
10.1 Berntsen International
10.1.1 Company Overview
10.1.2 Business Portfolio
10.1.3 Financial Overview
10.1.4 SWOT Analysis
10.1.5 Strategic Analysis
10.1.6 Recent Developments
10.2 3M
10.3 Hexagon AB
10.4 Detectable Warning Systems
10.5 Utility Marker & Tape Co.
10.6 Brady Corporation
10.7 Emtelle
10.8 Prysmian Group
10.9 Nexans
10.10 Kabelwerk Eupen
10.11 Olex
10.12 LS Cable & System
10.13 Asian Power Devices Inc
10.14 Asian Contec Ltd.
10.15 Fuji-Ace
10.16 Sumitomo Electric Industries
10.17 Detectable Tape Solutions
10.18 Warren & Brown Technologies
10.19 Nitto Denko Corporation
10.20 Polycab India Ltd
10.21 Elsewedy Electric
10.22 Reunert
10.23 Nexans
10.24 Dutco Tennant LLC
10.25 ywidag-Systems International
10.26 CEMIG
10.27 Avery Dennison Reflective Solutions
10.28 Agrale S.A.
10.29 Dura-Line Argentina
10.30 Enel Américas
11. Key Findings & Analyst Recommendations
12. Global Utility Markers Markets: Research Methodology