Turing Bots Market Size, Share, Growth Trends, Industry Analysis, Key Players, Investment Opportunities and Forecast (2026-2032)
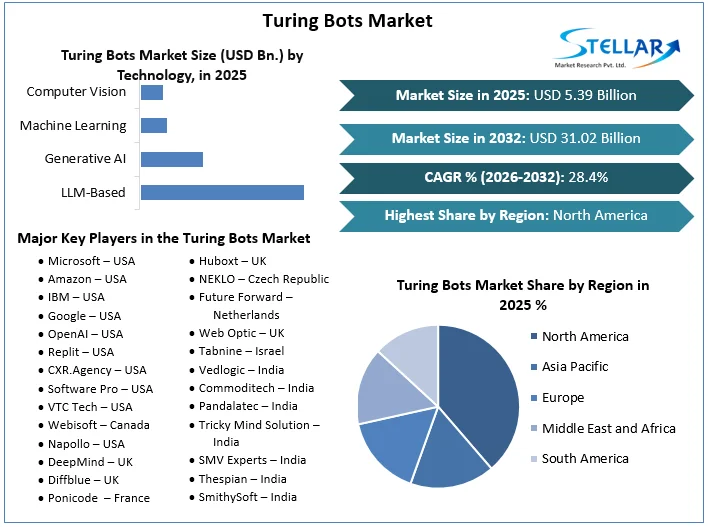
TuringBots Market is projected to grow at a CAGR of 28.4% through 2032. It was valued at USD 5.39 Bn in 2025 and is expected to become USD 31.02 Bn by 2032.
Turing Bots Market Overview
TuringBots are smart assistants that help streamline software development. They convert design mockups into working code, suggest auto-completions while programming, and can build entire code modules from simple descriptions. These tools act like an extra team member that speeds up development while maintaining quality, turning concepts into functional code faster than traditional methods. Developers use them to reduce repetitive tasks and focus on complex problem-solving. The market is experiencing rapid expansion, driven by increasing demand for faster and more efficient software distribution. The breakthrough in 2024 includes generative AI and Large Language Models (LLM) that improve code generation and relevant understanding, making TuringBots more sophisticated.
Trade policies and tariffs are significantly affecting market dynamics, potentially AI chip availability with US-China tech stresses, European Union rules have been emphasized for on-premise solutions, and India's import duties are increasing cloud costs. Recent developments show competition from Microsoft's end-to-end Copilot workspace to Meta's Code LLAMA 3, ranging from open-source options, highlighting intensive competition. While vertical-specific solutions for healthcare and finance are increasing, obstacles include high implementation costs and regulatory compliance with the European Union AI Act. Further, the market is moving towards autonomous coding agents that can generate 50% of all codes by 2030, in which energy-efficient solutions address sustainability concerns in data centers. This change leads to Turingbots at the forefront of the AI-driving future of software development, although geopolitical, technical and economic factors will continue to shape its trajectory.
North America leads the market due to its strong technical infrastructure and significant AI investments, while Asia-Pacific reflects rapid digitalization and high growth capacity with the government support for AI. Industry analysts predict strong growth, especially for AI-optimized TuringBots systems and solutions that contribute to overall software growth efficiency. Dominating tech giants like Microsoft, Google, and AWS, take advantage of their cloud ecosystem and IDE integration. Emerging players such as Cognition AI and open-source options are disrupting the space with special solutions. Competitive landscape focuses on cost efficiency through vertical expertise, multimodal AI abilities, and small language models.
To get more Insights: Request Free Sample Report
TuringBots Market Dynamics
Increasing Demand for AI-Powered Automation and DevOps to Drive Growth of the TuringBots Market growth
The TuringBots Market is experiencing rapid growth, driven by the increasing demand for AI-powered automation in software development, customer service, and business workflows. These smart bots, utilizing large language models (LLMs) such as GPT-4, Claude, and Gemini, dramatically improve productivity by automating coding, testing, and DevOps processes. With enterprises adopting AI to reduce development costs, TuringBots are becoming an essential part of AI-powered programming, real-time debugging, and autonomous code generation.
Accuracy and Reliability Concerns as well as High Implementation Costs to Restrain the TuringBot Market growth
Adoption of TuringBots is facing numerous major hurdles, starting with accuracy and reliability issues, as AI-generated code is manually checked because of hallucinations (wrong outputs) and security risks. High implementation cost further limits growth, with enterprise-level solutions requiring costly LLM licenses and SMEs struggling with cloud compute costs and proprietary model fine-tuning. Data privacy and IP concerns also introduce legal uncertainties, illustrated by GitHub Copilot litigation, discouraging regulated sectors such as healthcare and finance from cloud-based options to meet HIPAA and GDPR requirements.
Industry Specific Solutions to Present Tremendous Growth Opportunities
TuringBots market is on the threshold of massive growth, with numerous high-potential opportunities arising in industries and applications. Industry-specific solutions are becoming popular, especially in heavily regulated markets such as healthcare and finance, where compliance-enabling AI code assistants can save development time while allowing for high levels of data security requirements to be met. The relatively unaddressed SME market holds out a tremendous growth path for low-cost, easy-to-use TuringBot solutions, particularly in rapidly expanding markets such as Asia-Pacific, where digital transformation is intensifying.
Turing Bots Market Segmentation
Based on Deployment, TuringBots are deployed via cloud-based, on-premise, and edge AI solutions. Cloud-based dominates the market share, as it provides scalability, real-time updates, and spontaneous integration with existing growth devices. Prominent cloud providers such as Microsoft Azure, AWS, and Google Cloud directly embed the AI coding assistants in their platforms. 20% of the market share is held by on-premise solutions preferred by regulated industries (finance, healthcare, government) for data security. Edge AI is the fastest growing segment, especially in manufacturing and IOT, where low-distinction, real-time code adaptation is important.
Based on Technology, this segment is categorized into different technologies like LLM-based, Generative AI, Machine Learning, and Computer Vision. LLM-based solutions lead with 70% shares due to their ability to understand and generate human-like code. These models, such as GPT-4 and Cloud 3, are widely integrated into IDEs and cloud platforms, making them indispensable to developers. The generative AI is contributing 20% of the market, as it gives power to advanced code synthesis and documentation automation. The rise of small, efficient models is also receiving traction, especially a cost-effective solution looking between SMEs and Startups.
Turing Bots Market Regional Analysis Top of Form
North America is leading the market share, with early AI adoption, high venture capital investment, and the presence of tech giants such as Microsoft (GitHub Copilot), Google, and OpenAI. The latest updates include AWS CodeWhisperer's entering enterprise workflows and Anthropic's Claude 3 integration into developer software. Europe has a 27% market share, with growth driven by GDPR-compliant AI offerings and increasing demand in banking (e.g., HSBC's AI code analysis tools) and automotive sectors. The EU AI Act is forcing vendors to increase the transparency of AI-generated code.
The Asia-Pacific region is the fastest-growing, driven by India's IT services and Japan's investment in industrial automation bots. Major developments are Alibaba's Codeup AI for Chinese developers and Tata Consultancy Services (TCS) using AI coding assistants for international customers.
Turing Bots Market Competitive Landscape
The Turingbots market is dominated by the tech giants and emerging AI experts, in which Microsoft (GitHub Copilot) has led the 40% market share due to its deep integration with Visual Studio Code and Azure DevOps. Recently, Microsoft launched a Copilot Workspace, which enables AI-driven end-to-end software design. Google (Gemini Code Assist) and AWS (Codewhisperer) take advantage of their cloud ecosystem to attract enterprises. OpenAI’s GPT-4 Turbo powers many third-party equipment, while Anthropic Claude 3 is receiving traction for its safe, enterprise coding tip.
|
Turing Bots Market Scope |
|
|
Market Size in 2025 |
USD 5.39 Bn |
|
Market Size in 2032 |
USD 31.02 Bn |
|
CAGR (2026-2032) |
28.4% |
|
Historic Data |
2020-2025 |
|
Base Year |
2025 |
|
Forecast Period |
2026-2032 |
|
Segments |
By Function Design Automation Code Generation & Completion Testing & QA Automation Debugging & Optimization DevOps Automation Analytics & Monitoring |
|
By Deployment Cloud-Based On-Premise Edge AI |
|
|
By Technology LLM-Based Generative AI Machine Learning Computer Vision |
|
|
By End User Large Enterprises Small & Medium Enterprises Individual developers Government/defense |
|
|
Regional Scope |
North America- United States, Canada, and Mexico Europe – UK, France, Germany, Italy, Spain, Sweden, Russia, and Rest of Europe Asia Pacific – China, South Korea, Japan, India, Australia, Indonesia, Philippines, Malaysia, Vietnam, Thailand, Rest of APAC Middle East and Africa - South Africa, GCC, Egypt, Nigeria, Rest of the Middle East and Africa South America – Brazil, Argentina, Rest of South America |
Key Players in Turing Bots Market
North America
- Microsoft – USA
- Amazon – USA
- IBM – USA
- Google – USA
- OpenAI – USA
- Replit – USA
- CXR.Agency – USA
- Software Pro – USA
- VTC Tech – USA
- Webisoft – Canada
- Napollo – USA
Europe
- DeepMind – UK
- Diffblue – UK
- Ponicode – France
- Linnify – Romania
- Huboxt – UK
- NEKLO – Czech Republic
- Future Forward – Netherlands
- Web Optic – UK
Asia
- Tabnine – Israel
- Vedlogic – India
- Commoditech – India
- Pandalatec – India
- Tricky Mind Solution – India
- SMV Experts – India
- Thespian – India
- SmithySoft – India
South America
- CI&T (Brazil)
- Globant (Argentina)
MEA
- Beyond Limits (UAE)
Frequently Asked Questions
The market is projected to grow from USD 5.39 Bn in 2025 to USD 31.02 Bn by 2032. It is expanding rapidly at a CAGR of 28.4%
High implementation costs and AI code inaccuracies are key barriers. Legal risks and data privacy concerns also slow adoption.
North America leads due to AI maturity; Asia-Pacific is growing fastest. Large enterprises dominate usage, while SMEs show rising demand.
Microsoft, Google, AWS, OpenAI, and Anthropic are top players. They compete via cloud integration, vertical solutions, and AI innovations.
1. TuringBots Market: Introduction
1.1. Study Assumptions and Market Definition
1.2. Scope of the Study
1.3. Executive Summary
2. Global TuringBots Market: Competitive Landscape
2.1. Ecosystem Analysis
2.2. SMR Competition Matrix
2.3. Competitive Landscape
2.4. Key Players Benchmarking
2.4.1. Company Name
2.4.2. Business Segment
2.4.3. End-user Segment
2.4.4. Revenue (2025)
2.4.5. Company Locations
2.5. Market Structure
2.5.1. Market Leaders
2.5.2. Market Followers
2.5.3. Emerging Players
2.6. Mergers and Acquisitions Details
3. TuringBots Market: Dynamics
3.1. TuringBots Market Trends by Region
3.1.1. North America TuringBots Market Trends
3.1.2. Europe TuringBots Market Trends
3.1.3. Asia Pacific TuringBots Market Trends
3.1.4. Middle East and Africa TuringBots Market Trends
3.1.5. South America TuringBots Market Trends
3.2. TuringBots Market Dynamics
3.2.1. TuringBots Market Drivers
3.2.2. TuringBots Market Restraints
3.2.3. TuringBots Market Opportunities
3.2.4. TuringBots Market Challenges
3.3. PORTER’s Five Forces Analysis
3.4. PESTLE Analysis
3.5. Regulatory Landscape by Region
3.5.1. North America
3.5.2. Europe
3.5.3. Asia Pacific
3.5.4. Middle East and Africa
3.5.5. South America
3.6. Key Opinion Leader Analysis for TuringBots Industry
4. TuringBots Market: Global Market Size and Forecast by Segmentation (by Value in USD Bn) (2025-2032)
4.1. TuringBots Market Size and Forecast, By Function (2025-2032)
4.1.1. Design Automation
4.1.2. Code Generation & Completion
4.1.3. Testing & QA Automation
4.1.4. Debugging & Optimization
4.1.5. DevOps Automation
4.1.6. Analytics & Monitoring
4.2. TuringBots Market Size and Forecast, By Deployment Type (2025-2032)
4.2.1. Cloud-based
4.2.2. On-Premise
4.2.3. Edge AI
4.3. TuringBots Market Size and Forecast, By Technology (2025-2032)
4.3.1. LLM-Based
4.3.2. Generative AI
4.3.3. Machine Learning
4.3.4. Computer Vision
4.4. TuringBots Market Size and Forecast, By End User (2025-2032)
4.4.1. Large Enterprises
4.4.2. Small Enterprises
4.4.3. Individual developers
4.4.4. Government/defense
4.5. TuringBots Market Size and Forecast, by Region (2025-2032)
4.5.1. North America
4.5.2. Europe
4.5.3. Asia Pacific
4.5.4. Middle East and Africa
4.5.5. South America
5. North America TuringBots Market Size and Forecast by Segmentation (by Value in USD Bn) (2025-2032)
5.1. North America TuringBots Market Size and Forecast, By Function (2025-2032)
5.1.1. Design Automation
5.1.2. Code Generation & Completion
5.1.3. Testing & QA Automation
5.1.4. Debugging & Optimization
5.1.5. DevOps Automation
5.1.6. Analytics & Monitoring
5.2. North America TuringBots Market Size and Forecast, By Deployment Type (2025-2032)
5.2.1. Cloud-based
5.2.2. On-Premise
5.2.3. Edge AI
5.3. North America TuringBots Market Size and Forecast, By Technology (2025-2032)
5.3.1. LLM-Based
5.3.2. Generative AI
5.3.3. Machine Learning
5.3.4. Computer Vision
5.4. North America TuringBots Market Size and Forecast, By End User (2025-2032)
5.4.1. Large Enterprises
5.4.2. Small & Medium Enterprises
5.4.3. Individual developers
5.4.4. Government/defense
5.5. North America TuringBots Market Size and Forecast, by Country (2025-2032)
5.5.1. United States
5.5.1.1. United States TuringBots Market Size and Forecast, By Function (2025-2032)
5.5.1.1.1. Design Automation
5.5.1.1.2. Code Generation & Completion
5.5.1.1.3. Testing & QA Automation
5.5.1.1.4. Debugging & Optimization
5.5.1.1.5. DevOps Automation
5.5.1.1.6. Analytics & Monitoring
5.5.1.2. United States TuringBots Market Size and Forecast, By Deployment Type (2025-2032)
5.5.1.2.1. Cloud-based
5.5.1.2.2. On-Premise
5.5.1.2.3. Edge AI
5.5.1.3. United States TuringBots Market Size and Forecast, By Technology (2025-2032)
5.5.1.3.1. LLM-Based
5.5.1.3.2. Generative AI
5.5.1.3.3. Machine Learning
5.5.1.3.4. Computer Vision
5.5.1.4. United States TuringBots Market Size and Forecast, By End User (2025-2032)
5.5.1.4.1. IT & Software Development
5.5.1.4.2. Small & Medium Enterprises
5.5.1.4.3. Individual developers
5.5.1.4.4. Government/defense
5.5.2. Canada
5.5.2.1. Canada TuringBots Market Size and Forecast, By Function (2025-2032)
5.5.2.1.1. Design Automation
5.5.2.1.2. Code Generation & Completion
5.5.2.1.3. Testing & QA Automation
5.5.2.1.4. Debugging & Optimization
5.5.2.1.5. DevOps Automation
5.5.2.1.6. Analytics & Monitoring
5.5.2.2. Canada TuringBots Market Size and Forecast, By Deployment Type (2025-2032)
5.5.2.2.1. Cloud-based
5.5.2.2.2. On-Premise
5.5.2.2.3. Edge AI
5.5.2.3. Canada TuringBots Market Size and Forecast, By Technology (2025-2032)
5.5.2.3.1. LLM-Based
5.5.2.3.2. Generative AI
5.5.2.3.3. Machine Learning
5.5.2.3.4. Computer Vision
5.5.2.4. Canada TuringBots Market Size and Forecast, By End User (2025-2032)
5.5.3. IT & Software DevelopmentLarge Enterprises
5.5.3.1.1. Large Enterprises
5.5.3.1.2. Small & Medium Enterprises
5.5.3.1.3. Individual developers
5.5.3.1.4. Government/defense
5.5.4. Mexico
5.5.4.1. Mexico TuringBots Market Size and Forecast, By Function (2025-2032)
5.5.4.1.1. Design Automation
5.5.4.1.2. Code Generation & Completion
5.5.4.1.3. Testing & QA Automation
5.5.4.1.4. Debugging & Optimization
5.5.4.1.5. DevOps Automation
5.5.4.1.6. Analytics & Monitoring
5.5.4.2. Mexico TuringBots Market Size and Forecast, By Deployment Type (2025-2032)
5.5.4.2.1. Cloud-based
5.5.4.2.2. On-Premise
5.5.4.2.3. Edge AI
5.5.4.3. Mexico TuringBots Market Size and Forecast, By Technology (2025-2032)
5.5.4.3.1. LLM-Based
5.5.4.3.2. Generative AI
5.5.4.3.3. Machine Learning
5.5.4.3.4. Computer Vision
5.5.4.4. Mexico TuringBots Market Size and Forecast, By End User (2025-2032)
5.5.4.4.1. Large Enterprises
5.5.4.4.2. Small & Medium Enterprises
5.5.4.4.3. Individual developers
5.5.4.4.4. Government/defense
6. Europe TuringBots Market Size and Forecast by Segmentation (by Value in USD Bn) (2025-2032)
6.1. Europe TuringBots Market Size and Forecast, By Function (2025-2032)
6.2. Europe TuringBots Market Size and Forecast, By Deployment Type (2025-2032)
6.3. Europe TuringBots Market Size and Forecast, By Technology (2025-2032)
6.4. Europe TuringBots Market Size and Forecast, By End User (2025-2032)
6.5. Europe TuringBots Market Size and Forecast, by Country (2025-2032)
6.5.1. United Kingdom
6.5.1.1. United Kingdom TuringBots Market Size and Forecast, By Function (2025-2032)
6.5.1.2. United Kingdom TuringBots Market Size and Forecast, By Deployment Type (2025-2032)
6.5.1.3. United Kingdom TuringBots Market Size and Forecast, By Technology (2025-2032)
6.5.1.4. United Kingdom TuringBots Market Size and Forecast, By End User (2025-2032)
6.5.2. France
6.5.2.1. France TuringBots Market Size and Forecast, By Function (2025-2032)
6.5.2.2. France TuringBots Market Size and Forecast, By Deployment Type (2025-2032)
6.5.2.3. France TuringBots Market Size and Forecast, By Technology (2025-2032)
6.5.2.4. France TuringBots Market Size and Forecast, By End User (2025-2032)
6.5.3. Germany
6.5.3.1. Germany TuringBots Market Size and Forecast, By Function (2025-2032)
6.5.3.2. Germany TuringBots Market Size and Forecast, By Deployment Type (2025-2032)
6.5.3.3. Germany TuringBots Market Size and Forecast, By Technology (2025-2032)
6.5.3.4. Germany TuringBots Market Size and Forecast, By End User (2025-2032)
6.5.4. Italy
6.5.4.1. Italy TuringBots Market Size and Forecast, By Function (2025-2032)
6.5.4.2. Italy TuringBots Market Size and Forecast, By Deployment Type (2025-2032)
6.5.4.3. Italy TuringBots Market Size and Forecast, By Technology (2025-2032)
6.5.4.4. Italy TuringBots Market Size and Forecast, By End User (2025-2032)
6.5.5. Spain
6.5.5.1. Spain TuringBots Market Size and Forecast, By Function (2025-2032)
6.5.5.2. Spain TuringBots Market Size and Forecast, By Deployment Type (2025-2032)
6.5.5.3. Spain TuringBots Market Size and Forecast, By Technology (2025-2032)
6.5.5.4. Spain TuringBots Market Size and Forecast, By End User (2025-2032)
6.5.6. Sweden
6.5.6.1. Sweden TuringBots Market Size and Forecast, By Function (2025-2032)
6.5.6.2. Sweden TuringBots Market Size and Forecast, By Deployment Type (2025-2032)
6.5.6.3. Sweden TuringBots Market Size and Forecast, By Technology (2025-2032)
6.5.6.4. Sweden TuringBots Market Size and Forecast, By End User (2025-2032)
6.5.7. Austria
6.5.7.1. Austria TuringBots Market Size and Forecast, By Function (2025-2032)
6.5.7.2. Austria TuringBots Market Size and Forecast, By Deployment Type (2025-2032)
6.5.7.3. Austria TuringBots Market Size and Forecast, By Technology (2025-2032)
6.5.7.4. Austria TuringBots Market Size and Forecast, By End User (2025-2032)
6.5.8. Rest of Europe
6.5.8.1. Rest of Europe TuringBots Market Size and Forecast, By Function (2025-2032)
6.5.8.2. Rest of Europe TuringBots Market Size and Forecast, By Deployment Type (2025-2032)
6.5.8.3. Rest of Europe TuringBots Market Size and Forecast, By Technology (2025-2032)
6.5.8.4. Rest of Europe TuringBots Market Size and Forecast, By End User (2025-2032)
7. Asia Pacific TuringBots Market Size and Forecast by Segmentation (by Value in USD Bn) (2025-2032)
7.1. Asia Pacific TuringBots Market Size and Forecast, By Function (2025-2032)
7.2. Asia Pacific TuringBots Market Size and Forecast, By Deployment Type (2025-2032)
7.3. Asia Pacific TuringBots Market Size and Forecast, By Technology (2025-2032)
7.4. Asia Pacific TuringBots Market Size and Forecast, By End User (2025-2032)
7.5. Asia Pacific TuringBots Market Size and Forecast, by Country (2025-2032)
7.5.1. China
7.5.1.1. China TuringBots Market Size and Forecast, By Function (2025-2032)
7.5.1.2. China TuringBots Market Size and Forecast, By Deployment Type (2025-2032)
7.5.1.3. China TuringBots Market Size and Forecast, By Technology (2025-2032)
7.5.1.4. China TuringBots Market Size and Forecast, By End User (2025-2032)
7.5.2. S Korea
7.5.2.1. S Korea TuringBots Market Size and Forecast, By Function (2025-2032)
7.5.2.2. S Korea TuringBots Market Size and Forecast, By Deployment Type (2025-2032)
7.5.2.3. S Korea TuringBots Market Size and Forecast, By Technology (2025-2032)
7.5.2.4. S Korea TuringBots Market Size and Forecast, By End User (2025-2032)
7.5.3. Japan
7.5.3.1. Japan TuringBots Market Size and Forecast, By Function (2025-2032)
7.5.3.2. Japan TuringBots Market Size and Forecast, By Deployment Type (2025-2032)
7.5.3.3. Japan TuringBots Market Size and Forecast, By Technology (2025-2032)
7.5.3.4. Japan TuringBots Market Size and Forecast, By End User (2025-2032)
7.5.4. India
7.5.4.1. India TuringBots Market Size and Forecast, By Function (2025-2032)
7.5.4.2. India TuringBots Market Size and Forecast, By Deployment Type (2025-2032)
7.5.4.3. India TuringBots Market Size and Forecast, By Technology (2025-2032)
7.5.4.4. India TuringBots Market Size and Forecast, By End User (2025-2032)
7.5.5. Australia
7.5.5.1. Australia TuringBots Market Size and Forecast, By Function (2025-2032)
7.5.5.2. Australia TuringBots Market Size and Forecast, By Deployment Type (2025-2032)
7.5.5.3. Australia TuringBots Market Size and Forecast, By Technology (2025-2032)
7.5.5.4. Australia TuringBots Market Size and Forecast, By End User (2025-2032)
7.5.6. Indonesia
7.5.6.1. Indonesia TuringBots Market Size and Forecast, By Function (2025-2032)
7.5.6.2. Indonesia TuringBots Market Size and Forecast, By Deployment Type (2025-2032)
7.5.6.3. Indonesia TuringBots Market Size and Forecast, By Technology (2025-2032)
7.5.6.4. Indonesia TuringBots Market Size and Forecast, By End User (2025-2032)
7.5.7. Philippines
7.5.7.1. Philippines TuringBots Market Size and Forecast, By Function (2025-2032)
7.5.7.2. Philippines TuringBots Market Size and Forecast, By Deployment Type (2025-2032)
7.5.7.3. Philippines TuringBots Market Size and Forecast, By Technology (2025-2032)
7.5.7.4. Philippines TuringBots Market Size and Forecast, By End User (2025-2032)
7.5.8. Malaysia
7.5.8.1. Malaysia TuringBots Market Size and Forecast, By Function (2025-2032)
7.5.8.2. Malaysia TuringBots Market Size and Forecast, By Deployment Type (2025-2032)
7.5.8.3. Malaysia TuringBots Market Size and Forecast, By Technology (2025-2032)
7.5.8.4. Malaysia TuringBots Market Size and Forecast, By End User (2025-2032)
7.5.9. Vietnam
7.5.9.1. Vietnam TuringBots Market Size and Forecast, By Function (2025-2032)
7.5.9.2. Vietnam TuringBots Market Size and Forecast, By Deployment Type (2025-2032)
7.5.9.3. Vietnam TuringBots Market Size and Forecast, By Technology (2025-2032)
7.5.9.4. Vietnam TuringBots Market Size and Forecast, By End User (2025-2032)
7.5.10. Thailand
7.5.10.1. Thailand TuringBots Market Size and Forecast, By Function (2025-2032)
7.5.10.2. Thailand TuringBots Market Size and Forecast, By Deployment Type (2025-2032)
7.5.10.3. Thailand TuringBots Market Size and Forecast, By Technology (2025-2032)
7.5.10.4. Thailand TuringBots Market Size and Forecast, By End User (2025-2032)
7.5.11. Rest of Asia Pacific
7.5.11.1. Rest of Asia Pacific TuringBots Market Size and Forecast, By Function (2025-2032)
7.5.11.2. Rest of Asia Pacific TuringBots Market Size and Forecast, By Deployment Type (2025-2032)
7.5.11.3. Rest of Asia Pacific TuringBots Market Size and Forecast, By Technology (2025-2032)
7.5.11.4. Rest of Asia Pacific TuringBots Market Size and Forecast, By End User (2025-2032)
8. Middle East and Africa TuringBots Market Size and Forecast by Segmentation (by Value in USD Bn) (2025-2032)
8.1. Middle East and Africa TuringBots Market Size and Forecast, By Function (2025-2032)
8.2. Middle East and Africa TuringBots Market Size and Forecast, By Deployment Type (2025-2032)
8.3. Middle East and Africa TuringBots Market Size and Forecast, By Technology (2025-2032)
8.4. Middle East and Africa TuringBots Market Size and Forecast, By End User (2025-2032)
8.5. Middle East and Africa TuringBots Market Size and Forecast, by Country (2025-2032)
8.5.1. South Africa
8.5.1.1. South Africa TuringBots Market Size and Forecast, By Function (2025-2032)
8.5.1.2. South Africa TuringBots Market Size and Forecast, By Deployment Type (2025-2032)
8.5.1.3. South Africa TuringBots Market Size and Forecast, By Technology (2025-2032)
8.5.1.4. South Africa TuringBots Market Size and Forecast, By End User (2025-2032)
8.5.2. GCC
8.5.2.1. GCC TuringBots Market Size and Forecast, By Function (2025-2032)
8.5.2.2. GCC TuringBots Market Size and Forecast, By Deployment Type (2025-2032)
8.5.2.3. GCC TuringBots Market Size and Forecast, By Technology (2025-2032)
8.5.2.4. GCC TuringBots Market Size and Forecast, By End User (2025-2032)
8.5.3. Nigeria
8.5.3.1. Nigeria TuringBots Market Size and Forecast, By Function (2025-2032)
8.5.3.2. Nigeria TuringBots Market Size and Forecast, By Deployment Type (2025-2032)
8.5.3.3. Nigeria TuringBots Market Size and Forecast, By Technology (2025-2032)
8.5.3.4. Nigeria TuringBots Market Size and Forecast, By End User (2025-2032)
8.5.4. Rest of ME&A
8.5.4.1. Rest of ME&A TuringBots Market Size and Forecast, By Function (2025-2032)
8.5.4.2. Rest of ME&A TuringBots Market Size and Forecast, By Deployment Type (2025-2032)
8.5.4.3. Rest of ME&A TuringBots Market Size and Forecast, By Technology (2025-2032)
8.5.4.4. Rest of ME&A TuringBots Market Size and Forecast, By End User (2025-2032)
9. South America TuringBots Market Size and Forecast by Segmentation (by Value in USD Bn) (2025-2032)
9.1. South America TuringBots Market Size and Forecast, By Function (2025-2032)
9.2. South America TuringBots Market Size and Forecast, By Deployment Type (2025-2032)
9.3. South America TuringBots Market Size and Forecast, By Technology (2025-2032)
9.4. South America TuringBots Market Size and Forecast, By End User (2025-2032)
9.5. South America TuringBots Market Size and Forecast, by Country (2025-2032)
9.5.1. Brazil
9.5.1.1. Brazil TuringBots Market Size and Forecast, By Function (2025-2032)
9.5.1.2. Brazil TuringBots Market Size and Forecast, By Deployment Type (2025-2032)
9.5.1.3. Brazil TuringBots Market Size and Forecast, By Technology (2025-2032)
9.5.1.4. Brazil TuringBots Market Size and Forecast, By End User (2025-2032)
9.5.2. Argentina
9.5.2.1. Argentina TuringBots Market Size and Forecast, By Function (2025-2032)
9.5.2.2. Argentina TuringBots Market Size and Forecast, By Deployment Type (2025-2032)
9.5.2.3. Argentina TuringBots Market Size and Forecast, By Technology (2025-2032)
9.5.2.4. Argentina TuringBots Market Size and Forecast, By End User (2025-2032)
9.5.3. Rest Of South America
9.5.3.1. Rest Of South America TuringBots Market Size and Forecast, By Function (2025-2032)
9.5.3.2. Rest Of South America TuringBots Market Size and Forecast, By Deployment Type (2025-2032)
9.5.3.3. Rest Of South America TuringBots Market Size and Forecast, By Technology (2025-2032)
9.5.3.4. Rest Of South America TuringBots Market Size and Forecast, By End User (2025-2032)
10. Company Profile: Key Players
10.1. Microsoft
10.1.1. Company Overview
10.1.2. Business Portfolio
10.1.3. Financial Overview
10.1.4. SWOT Analysis
10.1.5. Strategic Analysis
10.1.6. Recent Developments
10.2. Amazon
10.3. IBM
10.4. Google
10.5. OpenAI
10.6. Replit
10.7. CXR.Agency
10.8. Software Pro
10.9. VTC Tech
10.10. Webisoft
10.11. Napollo
10.12. DeepMind
10.13. Diffblue
10.14. Ponicode
10.15. Linnify
10.16. Huboxt
10.17. NEKLO
10.18. Future Forward
10.19. Web Optic
10.20. Tabnine
10.21. Vedlogic
10.22. Commoditech
10.23. Pandalatec
10.24. Tricky Mind Solution
10.25. SMV Experts
10.26. Thespian
10.27. SmithySoft
10.28. CI&T
10.29. Globant
10.30. Beyond Limits
11. Key Findings
12. Analyst Recommendations
13. TuringBots Market: Research Methodology


